|
|
|
|
|
|
|
| ||||||||||
|
|
|
|
|
|
|
||||
| ||||||||||
|
|
|
|
|
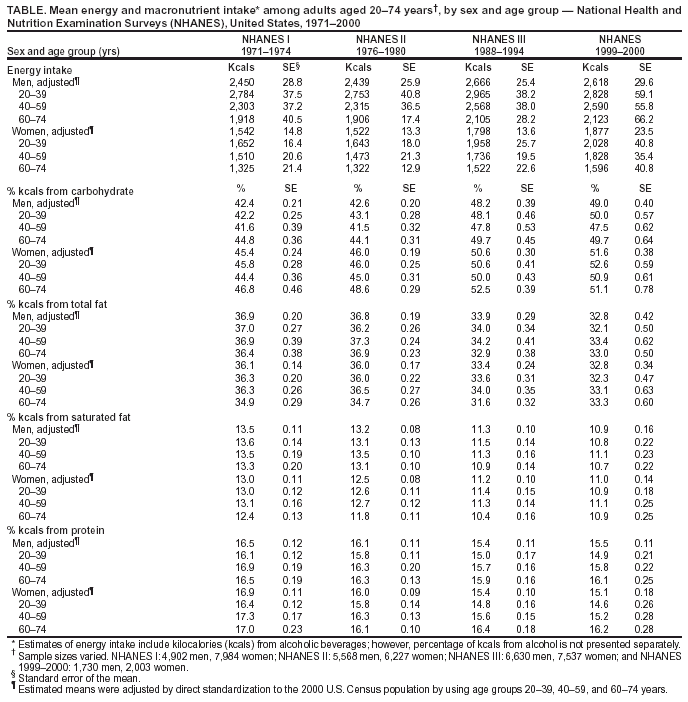
Persons using assistive technology might not be able to fully access information in this file. For assistance, please send e-mail to: mmwrq@cdc.gov. Type 508 Accommodation and the title of the report in the subject line of e-mail. Trends in Intake of Energy and Macronutrients --- United States, 1971--2000During 1971--2000, the prevalence of obesity in the United States increased from 14.5% to 30.9% (1). Unhealthy diets and sedentary behaviors have been identified as the primary causes of deaths attributable to obesity (2). Evaluating trends in dietary intake is an important step in understanding the factors that contribute to the increase in obesity. To assess trends in intake of energy (i.e., kilocalories [kcals]), protein, carbohydrate, total fat, and saturated fat during 1971--2000, CDC analyzed data from four National Health and Nutrition Examination Surveys (NHANES): NHANES I (conducted during 1971--1974), NHANES II (1976--1980), NHANES III (1988--1994), and NHANES 1999--2000. This report summarizes the results of that analysis, which indicate that, during 1971--2000, mean energy intake in kcals increased, mean percentage of kcals from carbohydrate increased, and mean percentage of kcals from total fat and saturated fat decreased (Figures 1 and 2). An expert advisory committee appointed by the U.S. Department of Health and Human Services and the U.S. Department of Agriculture (USDA) is conducting a review of the Dietary Guidelines for Americans (3). Revised guidelines will be published in 2005. NHANES provides information on the health and nutritional status of the U.S. civilian, noninstitutionalized population by using a complex, multistage probability sample design. NHANES I sampled persons residing in the contiguous 48 states; subsequent surveys sampled all 50 states. Surveys consisted of a household interview followed by an examination at a mobile examination center (MEC). All of the surveys included a dietary recall interview that was conducted at the MEC to obtain information on foods and beverages consumed during the preceding 24 hours. In this report, estimates of energy intake include kcals from alcoholic beverages; however, the percentage of kcals from alcohol is not presented separately. Age was recorded at the time of the household interview. The upper age limit was 74 years for NHANES I and NHANES II. No upper age limit was established for NHANES III and NHANES 1999--2000. To compare estimates across surveys, the analysis included only adults aged 20--74 years. Sample sizes ranged from 1,730 men and 2,003 women in NHANES 1999--2000 to 6,630 men and 7,537 women in NHANES III (Table). Statistical analyses were conducted by using SAS version 8.2 and SUDAAN version 8.0.0, which used sample weights and design variables to produce national estimates. The recommended age categories used are based on the survey sample domains (4). Because of differences in the relative age distribution, estimates for persons aged 20--74 years were adjusted by direct standardization to the 2000 U.S. Census population by using the age groups 20--39, 40--59, and 60--74 years. Six persons who reported fasting (i.e., consuming 0 kcals) during the preceding 24 hours were excluded from these analyses. During 1971--2000, a statistically significant increase in average energy intake occurred (Table). For men, average energy intake increased from 2,450 kcals to 2,618 kcals (p<0.01), and for women, from 1,542 kcals to 1,877 kcals (p<0.01). For men, the percentage of kcals from carbohydrate increased between 1971--1974 and 1999--2000, from 42.4% to 49.0% (p<0.01), and for women, from 45.4% to 51.6% (p<0.01) (Table). The percentage of kcals from total fat decreased from 36.9% to 32.8% (p<0.01) for men and from 36.1% to 32.8% (p<0.01) for women. In addition, the percentage of kcals from saturated fat decreased from 13.5% to 10.9% (p<0.01) for men and from 13.0% to 11.0% (p<0.01) for women. A slight decrease was observed in the percentage of kcals from protein, from 16.5% to 15.5% (p<0.01) for men and from 16.9% to 15.1% (p<0.01) for women. The decrease in the percentage of kcals from fat during 1971--1991 is attributed to an increase in total kcals consumed; absolute fat intake in grams increased (5). USDA food consumption survey data from 1989--1991 and 1994--1996 indicated that the increased energy intake was caused primarily by higher carbohydrate intake (6). Data from NHANES for 1971--2000 indicate similar trends. The increase in energy intake is attributable primarily to an increase in carbohydrate intake, with a 62.4-gram increase among women (p<0.01) and a 67.7-gram increase among men (p<0.01). Total fat intake in grams increased among women by 6.5 g (p<0.01) and decreased among men by 5.3 g (p<0.01). Reported by: JD Wright, MPH, J Kennedy-Stephenson, MS, CY Wang, PhD, MA McDowell, MPH, CL Johnson, MSPH, National Center for Health Statistics, CDC. Editorial Note:The increase in caloric intake described in this report is consistent with previously reported trends in dietary intake in the United States (7). USDA survey data for 1977--1996 suggest that factors contributing to the increase in energy intake in the United States include consumption of food away from home; increased energy consumption from salty snacks, soft drinks, and pizza (8); and increased portion sizes (9). The findings in this report are subject to at least two limitations. First, information on dietary intake is self-reported and subject to recall bias. Second, although the majority of the increase in average energy intake occurred between 1976--1980 and 1988--1994, changes in the 24-hour dietary recall interview method between these two periods might account for some of this difference. Beginning in 1988, dietary recalls were collected for weekend days as well as weekdays because food consumption differs on weekend days. The interview format was revised, and questions were added that might have allowed for collection of more complete dietary intake data. The latest national dietary data available indicate that the previously reported increase in energy intake has continued, reflecting primarily increased carbohydrate intake. A focus on total energy intake and energy balance (i.e., the balance of energy intake with energy expenditure) is fundamental to preventing and reducing obesity in the United States. Continuing efforts to decrease saturated fat intake are important to reduce the risk for cardiovascular disease and should include assessment of fat intake in grams in addition to fat intake as a percentage of kcals. The energy- and macronutrient-intake trends described in this report should help guide the forthcoming revision of Dietary Guidelines for Americans and reviews of USDA's Food Guide Pyramid and the Healthy People 2010 nutrition objectives. References
Figure 1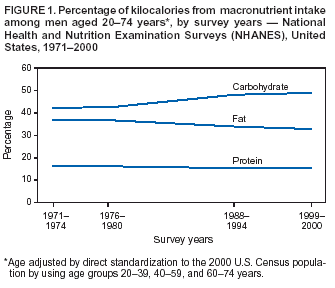 Return to top.
Figure 2
Disclaimer All MMWR HTML versions of articles are electronic conversions from ASCII text into HTML. This conversion may have resulted in character translation or format errors in the HTML version. Users should not rely on this HTML document, but are referred to the electronic PDF version and/or the original MMWR paper copy for the official text, figures, and tables. An original paper copy of this issue can be obtained from the Superintendent of Documents, U.S. Government Printing Office (GPO), Washington, DC 20402-9371; telephone: (202) 512-1800. Contact GPO for current prices. **Questions or messages regarding errors in formatting should be addressed to mmwrq@cdc.gov.Page converted: 2/5/2004 |
|||||||||
This page last reviewed 2/5/2004
|