|
|
|
|
|
|
|
| ||||||||||
|
|
|
|
|
|
|
||||
| ||||||||||
|
|
|
|
|
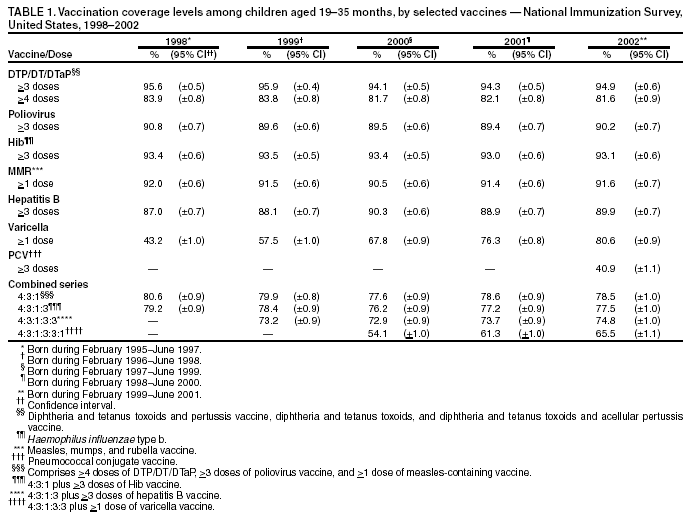
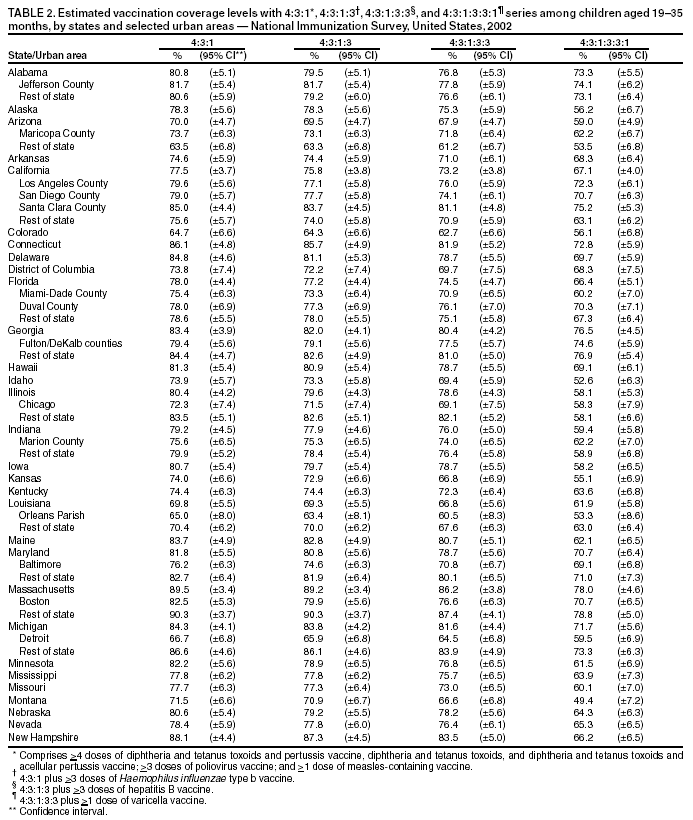
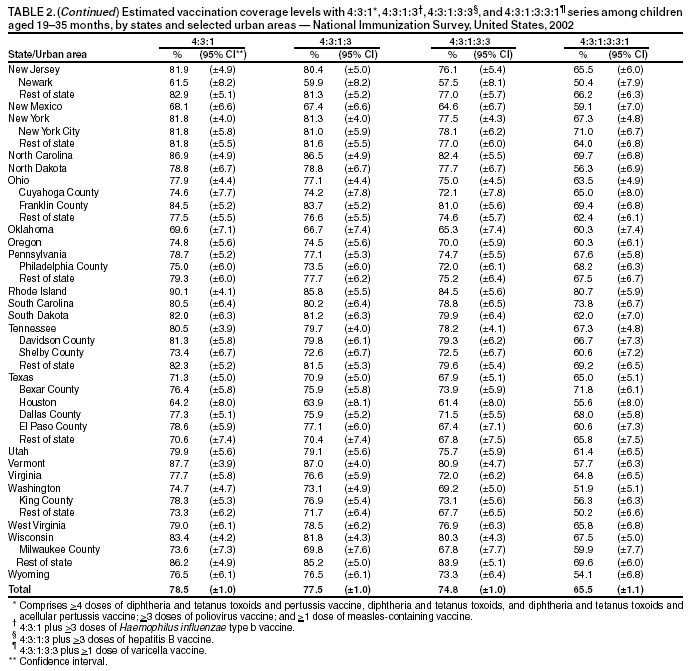
Persons using assistive technology might not be able to fully access information in this file. For assistance, please send e-mail to: mmwrq@cdc.gov. Type 508 Accommodation and the title of the report in the subject line of e-mail. National, State, and Urban Area Vaccination Levels Among Children Aged 19--35 Months --- United States, 2002Each annual birth cohort in the United States comprises approximately four million infants. Maintaining the gains in childhood vaccination coverage achieved during the 1990s among these children poses an ongoing challenge for public health. The National Immunization Survey (NIS) provides annual estimates of vaccination coverage among children aged 19--35 months for each of the 50 states and 28 selected urban areas*. This report presents NIS findings for 2002†, which indicate a marked nationwide increase in coverage with >1 dose of varicella vaccine (VAR), substantial uptake for >3 doses of pneumococcal conjugate vaccine (PCV), generally steady coverage levels for other vaccines nationwide, and continued wide variability in coverage among the states and selected urban areas. To collect vaccination data for all age-eligible children, NIS uses a quarterly random-digit--dialing sample of telephone numbers for each of the 78 survey areas. NIS methodology, including how the responses are weighted to represent the population of children aged 19--35 months, has been described previously (1,2). During 2002, health-care provider vaccination records were obtained for 21,317 children. The overall response rate for eligible households in 2002 was 62.3%. National vaccination coverage with >1 dose of VAR increased from 76.3% (95% confidence interval [CI] = ±0.8%) in 2001 to 80.6% (95% CI = ±0.9%) in 2002. Coverage for >3 doses of PCV, reported for the first time, was 40.9% (95% CI = ±1.1%). For all other vaccines, coverage levels remained steady during 2001--2002. For all combined vaccine series reported previously, coverage remained steady (Table 1). In 2002, coverage was reported for the 4:3:1:3:3:1§ series, which includes >1 dose of VAR. Coverage in 2002 for the 4:3:1:3:3:1 series was 65.5% (95% CI = ±1.1%), compared with 2000 and 2001, when coverage for this series was 54.1% (95% CI = ±1.0%) and 61.3% (95% CI = ±1.0%), respectively (Table 1). In 2002, substantial differences remained in estimated vaccination coverage among the states. The estimated coverage with the 4:3:1:3:3¶ series ranged from 86.2% in Massachusetts to 62.7% in Colorado (Table 2). Variability among the 28 selected urban areas was slightly less than that among the states. Among the 28 selected urban areas, the highest estimated coverage for the 4:3:1:3:3 series ranged from 81.1% in Santa Clara County, California, to 57.5% in Newark, New Jersey (Table 2). Reported by: L Barker, PhD, N Darling, MPH, Data Management Div; M McCauley, MTSC, Office of the Director; J Santoli, MD, Immunization Svcs Div, National Immunization Program, CDC. Editorial Note:The findings in the report indicate that among U.S. children aged 19--35 months, coverage with the recommended vaccines in 2002 remained near all-time highs. Changes in national level coverage from 2001 to 2002 with all vaccines other than VAR and PCV were so small that they are unlikely to have a major public health impact. Although coverage with recommended vaccines for each new birth cohort remains high, vigilance is needed to maintain these high levels. Eliminating the coverage disparity between states and urban areas with the highest and lowest coverage remains a priority. If vaccine-preventable disease is introduced in an area with low coverage, groups of susceptible children might serve as a reservoir to transmit disease. Because coverage with >1 dose of VAR attained a level approximately equal to that of >4 doses of DTaP, coverage for the 4:3:1:3:3:1 series, which includes VAR, was assessed and presented for the first time in this report. From 2000 to 2002, steady increases were observed. The 2002 NIS cohort was the first entire NIS birth cohort to be eligible for PCV. Coverage with >3 doses of PCV (40.9%) was similar to coverage for VAR in 1998 (43.2%), the first year for which the entire NIS birth cohort was eligible for that vaccine. Uptake for >3 doses of PCV showed steady quarterly increases (Q1 = 24.5%; Q2 = 35.3%; Q3 = 48.8%; Q4 = 56.3%), with a similar trend for >4 doses. The findings in this report are subject to at least three limitations. First, NIS is a telephone survey; although statistical weights adjust for nonresponse and households without telephones, some bias might remain. Second, although NIS relies on provider-verified vaccination histories, incomplete records and reporting could result in underestimates of coverage. The estimation procedure assumes that coverage among children whose providers do not respond is similar to that among children whose providers respond. Finally, although national level estimates are precise, estimates for states and urban areas should be interpreted with caution (3); CIs are wider for state and selected urban areas compared with national estimates. During the time that children in the 2002 cohort were to be vaccinated, vaccines in short supply included DTaP; measles, mumps, and rubella (MMR); VAR; and PCV (4--7). When DTaP was in short supply, approximately 86% of the NIS cohort needed >1 dose of the vaccine to stay on schedule. For MMR, VAR, and PCV, the percentages were approximately 6%, 21%, and 37%, respectively. NIS has sufficient power to detect a moderate (e.g., 15%) decrease in coverage even among the 6% of children due to receive a dose of MMR during the period it was in short supply; no effect on coverage was noted for any vaccine or series. These shortages affected children, their parents, and health-care providers; however, many aspects of vaccine delivery are not reflected by coverage attained among children aged 19--35 months. For example, if vaccine was unavailable at a health-care provider visit, another visit could have been made at a later time when vaccine was obtained. Such affected children, although lacking optimal protection for some period, still could show up as fully vaccinated through NIS. The impact of the shortages also might have been minimized if efforts by health-care providers, such as recalling children who missed doses and administering catch-up doses, had taken place. Further analysis of the 2002 data are ongoing to assess these potential impacts of the shortages, including changes in the percentage of children who received vaccines at recommended ages or the number of health-care provider visits required for children to be vaccinated fully. Health-care providers serving the cohort of children surveyed in 2002 also might have mitigated the effects of the shortages with vaccines already on hand that had been distributed during 1999--2001. Because many children affected by the shortages will be members of the 2003 NIS birth cohort, potential impacts on coverage and timeliness should be assessed in next year's data. References
* Jefferson County, Alabama; Maricopa County, Arizona; Los Angeles, San Diego, and Santa Clara counties, California; District of Columbia; Miami-Dade and Duval counties, Florida; Fulton/DeKalb counties, Georgia; Chicago, Illinois; Marion County, Indiana; Orleans Parish, Louisiana; Baltimore, Maryland; Boston, Massachusetts; Detroit, Michigan; Newark, New Jersey; New York, New York; Cuyahoga and Franklin counties, Ohio; Philadelphia County, Pennsylvania; Davidson and Shelby counties, Tennessee; Bexar, Dallas, and El Paso counties, and Houston, Texas; King County, Washington; and Milwaukee County, Wisconsin. † For the January--December 2002 reporting period, NIS included children born during February 1999--June 2001. § Comprises >4 doses of diphtheria and tetanus toxoids and pertussis vaccine, diphtheria and tetanus toxoids, and diphtheria and tetanus toxoids and acellular pertussis vaccine (DTP/DT/DTaP); >3 doses of poliovirus vaccine; >1 dose of measles-containing vaccine (MCV); >3 doses of Haemophilus influenzae type b vaccine (Hib); >3 doses of hepatitis B vaccine (hep B); and >1 dose of VAR vaccine. ¶ Comprises >4 doses of DTP vaccine, >3 doses of poliovirus vaccine, >1 dose of MCV, >3 doses of Hib vaccine, and >3 doses of hepB vaccine.
Table 1
Disclaimer All MMWR HTML versions of articles are electronic conversions from ASCII text into HTML. This conversion may have resulted in character translation or format errors in the HTML version. Users should not rely on this HTML document, but are referred to the electronic PDF version and/or the original MMWR paper copy for the official text, figures, and tables. An original paper copy of this issue can be obtained from the Superintendent of Documents, U.S. Government Printing Office (GPO), Washington, DC 20402-9371; telephone: (202) 512-1800. Contact GPO for current prices. **Questions or messages regarding errors in formatting should be addressed to mmwrq@cdc.gov.Page converted: 8/7/2003 |
|||||||||
This page last reviewed 8/7/2003
|