 |
|
|
|
|
|
|
| ||||||||||
|
|
|
|
|
|
|
||||
| ||||||||||
|
|
|
|
|
Persons using assistive technology might not be able to fully access information in this file. For assistance, please send e-mail to: mmwrq@cdc.gov. Type 508 Accommodation and the title of the report in the subject line of e-mail. Iron Deficiency --- United States, 1999--2000Iron deficiency, the most common nutritional deficiency worldwide, has negative effects on work capacity and on motor and mental development in infants, children, and adolescents, and maternal iron deficiency anemia might cause low birthweight and preterm delivery (1--3). Although iron deficiency is more common in developing countries, a significant prevalence was observed in the United States during the early 1990s among certain populations, such as toddlers and females of childbearing age (4). One of the national health objectives for 2010 is to reduce iron deficiency in these vulnerable populations by 3--4 percentage points (objective no. 19-12) (5). CDC has published recommendations to prevent iron deficiency in the United States (6). To characterize the iron status of persons in the United States, CDC calculated the prevalence of iron deficiency and iron deficiency anemia by applying a multiple-indicator model to data from the 1999--2000 National Health and Nutrition Examination Survey (NHANES 1999--2000). These values were compared with those observed in the third National Health and Nutrition Examination Survey (NHANES III [1988--1994]) using the same multiple-indicator model. This report summarizes the results of this analysis, which indicate that iron deficiency remains 2--5 percentage points above the 2010 national health objectives. To prevent iron deficiency, vulnerable populations should be encouraged to eat iron-rich foods and breast-feed or use iron-fortified formula for infants. Both NHANES surveys sampled the U.S. civilian, noninstitutionalized population and collected data through household interviews and physical examinations. In both surveys, blood was collected by venipuncture from all persons aged >1 year. Four biochemical measures of iron status were included in the analysis: hemoglobin, serum ferritin, transferrin saturation, and free erythrocyte protoporphyrin. Hemoglobin was measured in mobile examination centers in both surveys as part of a complete blood count by using an automated electronic counter: Coulter S-Plus Jr in NHANES III and Coulter MAXM in NHANES 1999--2000 (Coulter Electronics, Hialeah, Florida). In both surveys, the remaining three iron indicators were measured at CDC by using the same assay methods and comparable quality-control materials. Serum ferritin was measured with the Bio-Rad QuantImune Ferritin IRMA™ (Bio-Rad Laboratories, Hercules, California); transferrin saturation was calculated from serum iron and total iron-binding capacity, which were measured by a modification of the automated AAII-25 colorimetric method; and free erythrocyte protoporphyrin was measured by a modification of the Sassa method (7). Because abnormal values for these iron status indicators might be caused by inflammatory conditions rather than by poor iron status (8), a serum indicator of inflammation (C-reactive protein) also was used. This indicator was measured on participants aged >3 years by latex-enhanced nephelometry at the University of Washington (7). The definition of iron deficiency was an abnormal value for at least two of the following three indicators: serum ferritin, transferrin saturation, and free erythrocyte protoporphyrin. Persons with iron deficiency and a low hemoglobin value were considered to have iron deficiency anemia (4). The same threshold values to define abnormality for the four iron indicators were applied to both surveys. These thresholds were derived from NHANES III (4). The estimated prevalence of iron deficiency was greatest among toddlers aged 1--2 years (7%) and adolescent and adult females aged 12--49 years (9%--16%) (Table 1). The prevalence of iron deficiency was approximately two times higher among non-Hispanic black and Mexican-American females (19%--22%) than among non-Hispanic white females (10%). Excluding persons aged >3 years with elevated C-reactive protein levels (>1 mg/dL) from the analysis did not change prevalence estimates. The prevalence of iron deficiency was similar in NHANES III and NHANES 1999--2000 in most age and sex groups (Table 1). Exceptions included males aged 12--69 years and women aged 50--69 years; in these groups, the prevalence was substantially higher in NHANES 1999--2000 than in NHANES III as determined by a t-test (Table 1). The prevalence of iron deficiency anemia was examined for the populations in which iron deficiency was most common in NHANES 1999--2000 (Table 2). In these groups, the prevalence was <5%, which is similar to that observed in NHANES III (Table 2). Reported by: AC Looker, PhD, Div of Health Examination Statistics, National Center for Health Statistics; ME Cogswell, DrPH, Div of Nutrition and Physical Activity, National Center for Chronic Disease Prevention and Health Promotion; EW Gunter, MT(ASCP), Div of Laboratory Sciences, National Center for Environmental Health, CDC. Editorial Note:Data from NHANES 1999--2000 indicate that iron deficiency anemia is uncommon in the United States, but iron deficiency remains above the 2010 objectives of 5%, 1%, and 7% for toddlers, preschool children, and females aged 12--49 years, respectively (5). Among minority females aged 12--49 years, the prevalence of iron deficiency was approximately three times greater than the 2010 national health objectives. Multiple factors, including dietary intake, parity, and socioeconomic status (4,6), might explain the continued prevalence of iron deficiency in these groups. These factors were not included in this assessment of iron status. The findings in this report are subject to at least two limitations. First, because abnormal values for iron status indicators might reflect inflammation rather than poor iron status (8), confounding by inflammation might have affected results in some age groups. The confounding could not be addressed in toddlers because data on inflammation in this age group were not available. The confounding might have been only partially addressed in middle-aged and older adults because C-reactive protein is less sensitive for detecting chronic inflammatory conditions common in older persons than it is in detecting inflammation from acute infections (9). Second, insufficient sample size also might have limited the ability to detect trends in iron deficiency over time. Data from the Pediatric Nutrition Surveillance System (PNSS) indicated that anemia continued to decline among toddlers in low-income households during the 1990s (10). Anemia is not always caused by iron deficiency, but the PNSS data suggest progress in improving iron status among children. However, the prevalence of iron deficiency did not differ substantially between the two NHANES surveys among toddlers, adolescents, or females aged 12--49 years, possibly because of limited study power resulting from the smaller sample size in NHANES 1999--2000. For example, power calculations revealed that a sample size of approximately 1,300 would be needed in each survey to demonstrate that the difference in prevalence among females aged 16--19 years (11% versus 16%) was statistically significant. Thus, additional years of data will be needed to ascertain whether progress has been made in achieving the 2010 national health objectives for reducing iron deficiency in vulnerable populations. Many of the adverse consequences of iron deficiency are associated with its most severe form, iron deficiency anemia (1,3). However, iron deficiency without anemia has been linked to negative impacts on cognitive development in children and adolescents (2). Continued monitoring of iron status of the U.S. population is warranted because the prevalence of iron deficiency in vulnerable populations exceeds the 2010 national health objectives. References
Table 1 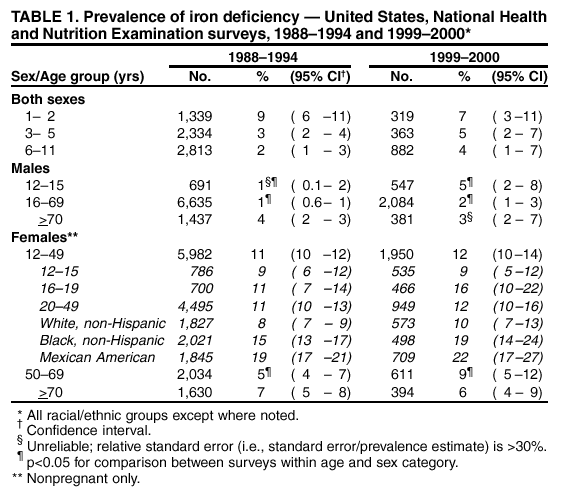 Return to top. Table 2 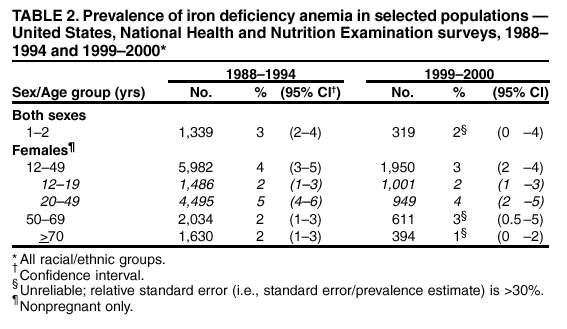 Return to top.
Disclaimer All MMWR HTML versions of articles are electronic conversions from ASCII text into HTML. This conversion may have resulted in character translation or format errors in the HTML version. Users should not rely on this HTML document, but are referred to the electronic PDF version and/or the original MMWR paper copy for the official text, figures, and tables. An original paper copy of this issue can be obtained from the Superintendent of Documents, U.S. Government Printing Office (GPO), Washington, DC 20402-9371; telephone: (202) 512-1800. Contact GPO for current prices. **Questions or messages regarding errors in formatting should be addressed to mmwrq@cdc.gov.Page converted: 10/10/2002 |
|||||||||
This page last reviewed 10/10/2002
|