 |
|
|
|
|
|
|
| ||||||||||
|
|
|
|
|
|
|
||||
| ||||||||||
|
|
|
|
|
Persons using assistive technology might not be able to fully access information in this file. For assistance, please send e-mail to: mmwrq@cdc.gov. Type 508 Accommodation and the title of the report in the subject line of e-mail. Update: Influenza Activity --- United States and Worldwide, 2001--02 Season, and Composition of the 2002--03 Influenza VaccineThe 2001--02 influenza season in the United States was mild to moderate. Influenza A (H3N2) viruses predominated, but influenza B viruses were identified more frequently than influenza A viruses toward the end of the season. Worldwide, influenza A (H3N2) and B viruses predominated. This report summarizes influenza activity in the United States* (September 30, 2001--May 18, 2002) and worldwide (October--May) during the 2001--02 influenza season and describes the composition of the 2002--03 influenza vaccine. United StatesInfluenza activity increased in mid-January and peaked during mid-to-late February. Influenza A (H3N2) viruses predominated; however, the number of influenza B viruses increased as the season progressed. Influenza B viruses were the most frequently identified influenza viruses from the week ending March 30 (week 13) through the week ending May 18 (week 20) (Figure). During September 30, 2001--May 18, 2002, the World Health Organization and National Respiratory and Enteric Virus Surveillance System collaborating laboratories in the United States tested 100,815 respiratory specimens for influenza; 15,671 (16%) were positive (Figure). Of these, 13,706 (87%) were influenza type A and 1,965 (13%) were influenza type B. Of the 4,507 subtyped influenza A viruses, 4,420 (98%) were H3 viruses and 87 (2%) were H1 viruses. Influenza A viruses predominated in all nine surveillance regions. The proportion of specimens testing positive for influenza first increased to >10% during the week ending January 12 (week 2), peaked at 26% during the week ending February 23 (week 8), and declined to <10% during the week ending April 27 (week 17). The peak percentage of specimens testing positive for influenza during the previous three seasons ranged from 23% to 31%. CDC has characterized antigenically 690 influenza viruses collected from U.S. laboratories since September 30: 393 influenza A (H3N2) viruses, 30 influenza A H1 viruses, and 267 influenza B viruses. All 393 influenza A (H3N2) viruses were similar to A/Panama/2007/99, the H3N2 component of the 2001--02 influenza vaccine. All 30 influenza A H1 viruses had an H1 protein similar antigenically to the A/New Caledonia/20/99, the H1N1 component of the 2001--02 influenza vaccine. Sixteen of the 30 H1 viruses were identified as influenza A (H1N2) viruses. These H1N2 viruses were collected in Hawaii, Massachusetts, New York, Pennsylvania, and Wisconsin. Two additional H1N2 viruses were identified from patient specimens collected during July and September in Texas and Nevada, respectively. Influenza B viruses circulating currently can be divided into two antigenically distinct lineages: B/Yamagata/16/88-like and B/Victoria/2/87-like viruses. CDC has characterized antigenically 267 influenza B viruses collected from U.S. laboratories since September 30; 61 were of the B/Yamagata lineage and 206 of the B/Victoria lineage. Of the 61 B/Yamagata lineage viruses, 13 were similar to the vaccine strain B/Sichuan/379/99, and 48 demonstrated reduced titers to ferret antisera produced against B/Sichuan/379/99. Most of the viruses that demonstrated reduced titers to ferret antisera produced against B/Sichuan/379/99 were related closely to B/Shizuoka/15/01, a minor antigenic variant of B/Sichuan/379/99. During the weeks ending December 29--January 5 (weeks 52--1) and the weeks ending January 19--March 16 (weeks 3--11), the weekly percentage of patient visits for influenza-like illness (ILI)† reported by U.S. sentinel physicians§ exceeded baseline levels (0--1.9%). The peak percentage of patient visits for ILI was 3.2% during the week ending February 16 (week 7). During the previous three seasons, the peak percentage of patient visits for ILI ranged from 4% to 6%. On the basis of data from state and territorial epidemiologists, influenza activity peaked during the week ending February 23 (week 8), when 40 states reported regional or widespread influenza activity.¶ Regional influenza activity was reported by one or more states during all but 1 week from the week ending October 27 (week 43) through the week ending May 4 (week 18). Widespread activity was reported by one or more states during all but 1 week from the week ending December 1 (week 48) through the week ending March 30 (week 13). The peak number of states reporting regional or widespread activity during the previous three seasons ranged from 38 to 44. As reported by the 122 Cities Mortality Reporting System, the percentage of deaths in the United States associated with pneumonia and influenza (P&I) exceeded the epidemic threshold** for 5 consecutive weeks (weeks ending March 2 [week 9] to March 30 [week 13]). During the previous three seasons, the number of consecutive weeks during which the percentage of deaths attributed to P&I exceeded the epidemic threshold ranged from 0 to13. WorldwideDuring October 2001--May 2002, influenza A (H3N2) and B viruses circulated widely in Africa, the Americas, Asia, Europe, and Oceania, and influenza A (H1N1) and A (H1N2) viruses were reported sporadically. Influenza A (H3N2) viruses predominated in Africa (Egypt, Madagascar, Mauritus, Senegal, and Tunisia), the Americas (Argentina, Canada, French Guiana, and Mexico), Asia (China and Hong Kong), Europe (Croatia, Czech Republic, Denmark, Finland, France, Germany, Iceland, Ireland, Israel, Latvia, the Netherlands, Norway, Portugal, Romania, Spain, and the United Kingdom), and Oceania (Australia). Influenza A (H3N2) viruses also were reported from Asia (Japan, the Philippines, the Republic of Korea, Singapore, Taiwan, and Thailand) and Europe (Bulgaria, Greece, Italy, Poland, the Russian Federation, and Switzerland), and Oceania (New Zealand). Influenza B viruses were identified more frequently than influenza A viruses in Austria, Chile, Greece, Italy, India, Paraguay, the Russian Federation, Slovakia, Slovenia, and Switzerland. Many of the influenza B viruses from the Americas, Asia, Europe, and Oceania were B/Sichuan/379/99-like viruses that were identified in Argentina, Australia, Canada, Croatia, France, Greece, Hong Kong, India, Israel, Italy, Malaysia, Norway, the Philippines, the Russian Federation, Singapore, Slovakia, Thailand, Taiwan, and the Ukraine. However, the majority of influenza B isolates from Canada, Hong Kong, India, Oman, and the Philippines were B/Hong Kong/330/01-like viruses; these viruses also were identified in China, Israel, Italy, Malaysia, the Netherlands, Norway, the Philippines, Singapore, and Switzerland. Influenza A (H1N1) viruses were reported from Africa (Egypt and South Africa) the Americas (Canada and Chile), Asia (China, Hong Kong, Iran, Japan, the Philippines, the Republic of Korea, Singapore, Taiwan, and Thailand), Europe (Bulgaria, Croatia, Finland, France, Ireland, Israel, Italy, Norway, Poland, Portugal, Romania, the Russian Federation, Spain, the Ukraine, and the United Kingdom), and Oceania (Australia, New Caledonia, and New Zealand). Since September 30, influenza A (H1N2) viruses have been identified from Canada, Egypt, Hong Kong, India, Israel, Malaysia, Romania, Singapore and the United Kingdom. Before September 30, H1N2 viruses also were collected from India and Oman. Influenza A (unsubtyped) viruses were reported from Belarus, Belgium, and Brazil. Composition of the 2002--03 Influenza VaccineThe Food and Drug Administration's Vaccines and Related Biological Products Advisory Committee (VRBPAC) recommended that the 2002--03 trivalent influenza vaccine for the United States contain A/New Caledonia/20/99-like (H1N1), A/Moscow/10/99-like (H3N2), and B/Hong Kong/330/01-like viruses. This recommendation was based on antigenic analyses of influenza viruses isolated recently, epidemiologic data, and postvaccination serologic studies in humans. Most influenza A (H3N2) viruses isolated worldwide during the 2001--02 season were similar to A/Panama/2007/99-like and A/Moscow/10/99-like (H3N2) viruses. Some influenza A (H3N2) viruses were distinguished antigenically from the reference strains but were heterogeneous antigenically and genetically. Antibodies produced following vaccination with the 2001--02 vaccine containing the A/Panama/2007/99 (H3N2) virus reacted equally well with recent influenza A (H3N2) viruses and the vaccine strain (2); therefore, VRBPAC recommended that an influenza A/Moscow/10/99-like (H3N2) virus be retained in the 2002--03 vaccine. U.S. vaccine manufacturers will use the antigenically equivalent virus A/Panama/2007/99 because of its growth properties. The hemagglutinin of most influenza A (H1N1) and A (H1N2) viruses were related antigenically to A/New Caledonia/20/99; therefore, VRBPAC recommended that an A/New Caledonia/20/99 (H1N1) virus be retained in the 2002--03 vaccine. Genetic analyses showed that the neuraminidase of influenza A (H1N2) viruses was related closely to the circulating H3N2 viruses. Current vaccines containing A/New Caledonia/20/99-like virus antigen induced antibodies to H1N2 strains, which were similar in titer and frequency to those of the vaccine strain. Many influenza B isolates were from the B/Yamagata/16/88 lineage represented in the 2001--02 vaccine by B/Sichuan/379/99. However, B/Hong Kong/330/01-like viruses, which belong to the B/Victoria/2/87 lineage, have spread to countries in Asia, Europe, and North America. Current vaccines containing antigen of B/Sichuan/379/99-like viruses induced antibodies that reacted poorly with viruses related to B/Hong Kong/330/01. Consequently, VRBPAC recommended that the influenza B component be updated for the 2002--03 vaccine to an influenza B/Hong Kong/330/01-like virus. U.S. manufacturers will use one of the antigenically equivalent viruses: B/Hong Kong/330/01 or B/Hong Kong/1434/02. Reported by: WHO Collaborating Center for Reference and Research on Influenza; A Postema, MPH, L Brammer, MPH, H Hall, A Klimov, PhD, K Fukuda, MD, N Cox, PhD, Div of Viral and Rickettsial Diseases, National Center for Infectious Diseases; P Terebuh, MD, EIS Officer, CDC. Editorial Note:Overall, the 2001--02 influenza season was mild to moderate. Influenza A (H3N2) viruses predominated; however, influenza B viruses were isolated more frequently during the late spring in the United States and continue to circulate. Since 1990, viruses of the B/Yamagata lineage have circulated widely. The influenza B component of this season's influenza vaccine belonged to the B/Yamagata lineage. However, during 2001--02, the majority of influenza B viruses characterized in the United States and worldwide was from the B/Victoria/2/87 lineage. Until March 2001, viruses of the B/Victoria lineage had not been identified outside of Asia since 1991. Since March 2001, B/Victoria lineage viruses have been identified in Africa, Asia, Europe, and North America. The 2002--03 influenza vaccine will contain a virus from the B/Victoria lineage. During the 2001--02 season, influenza A (H1N2) viruses were isolated from several countries, including the United States (3). These new A (H1N2) viruses resulted from gene reassortment among the circulating influenza A (H1N1) and A (H3N2) subtypes. Because hemagglutinin proteins of the A (H1N2) viruses were similar to those of this season's A (H1N1) viruses, and the neuraminidase proteins were similar to this season's A (H3N2) viruses, the 2001--02 vaccine should have provided protection against the A (H1N2) viruses (2). No information suggests that A (H1N2) viruses have been causing more severe illness than other influenza A viruses, and no unusual increases in influenza activity have been associated with these viruses. Influenza A (H1N2) viruses were isolated in China during the 1988--89 influenza season but were not reported in other parts of the world. Whether the new A (H1N2) viruses will persist is uncertain. Influenza vaccine manufacturers project that approximately 92--97 million doses will be available for distribution during the 2002--03 influenza season. This estimate is based on early projections and could change as the season progresses. In comparison, approximately 70.4 million doses were distributed in 2000 when there were difficulties with growing and processing the influenza A (H3N2) vaccine strain and other manufacturing problems resulted in substantial distribution delays (4). In 2001, a less severe delay occurred. By December 2001, approximately 87.7 million doses of vaccine were produced, more than in any year except the 1976--1977 swine influenza vaccine campaign (5). The 2002--03 recommendations of the Advisory Committee on Immunization Practices (ACIP) for the Prevention and Control of Influenza (6) contain important changes concerning the timing of vaccination and target groups for vaccination. The optimal time to receive influenza vaccine is during October--November. However, because of vaccine distribution delays during the previous 2 years and uncertainty about vaccine supply in future seasons, ACIP recommends that vaccination efforts during October focus on persons at greatest risk for influenza-related complications (e.g., persons aged >65 years and persons aged 6 months--64 years with certain medical conditions), household contacts of these high-risk persons, children aged 6 months to <9 years receiving vaccine for the first time, and health-care workers, and that vaccination of other groups begin in November. Vaccination efforts for all groups should continue into December and later, for as long as vaccine is available. Because young, healthy children are at increased risk for influenza-related hospitalization, vaccination of healthy children aged 6--23 months and close contacts of children aged 0--23 months is encouraged when feasible and should begin during October. Vaccination of children aged >6 months who have certain high-risk medical conditions continues to be recommended strongly (6). Although influenza epidemics in the temperate regions of the Northern Hemisphere typically peak during December--March, sporadic cases and outbreaks can occur during the summer (7--9). U.S. health-care providers should consider influenza types A and B when diagnosing a febrile respiratory illness during the summer, particularly among persons who have traveled recently in the tropics or Southern Hemisphere, or with large international groups. Acknowledgments This report is based on data contributed by participating state and territorial epidemiologists and state health laboratories. WHO collaborating laboratories. National Respiratory and Enteric Virus Surveillance System laboratories. Sentinel Physicians Influenza Surveillance System. Div of Public Health Surveillance and Informatics, Epidemiology Program Office; Div of Vital Statistics, National Center for Health Statistics, CDC. World Health Organization National Influenza Centers, Communicable Diseases, Surveillance and Response, World Health Organization, Geneva, Switzerland. A Hay, PhD, WHO Collaborating Center for Reference and Research on Influenza, National Institute for Medical Research, London, England. I Gust, MD, A Hampson, WHO Collaborating Center for Reference and Research on Influenza, Parkville, Australia. M Tashiro, MD, WHO Collaborating Center for Reference and Research on Influenza, National Institute of Infectious Diseases, Tokyo, Japan. References
* Data reported as of June 10, 2002. The four components of the influenza surveillance system have been described previously (1). † Temperature >100º F (>37.8º C) and either cough or sore throat in the absence of a known cause. § The national baseline was calculated as the mean percentage of patient visits for ILI during noninfluenza weeks plus two standard deviations. Because of wide variability in regional-level data, calculating region-specific baselines is not possible, and the national baseline cannot be applied to regional level data. ¶ Levels of activity are 1) no activity; 2) sporadic---sporadically occurring ILI or culture-confirmed influenza with no outbreaks detected; 3) regional---outbreaks of ILI or culture-confirmed influenza in counties with a combined population of <50% of the state's population; and 4) widespread---outbreaks of ILI or culture-confirmed influenza in counties with a combined population of >50% of the state's population. ** The expected baseline proportion of P&I deaths reported by the 122 Cities Mortality Reporting System is projected by using a robust regression procedure in which a periodic regression model is applied to the observed percentage of deaths from P&I over the previous 5 years. The epidemic threshold is 1.654 standard deviations above the seasonal baseline. Before the 1999--2000 season, a new case definition for a P&I death was introduced. During summer 2000, the baseline and epidemic thresholds were adjusted manually to account for the changes in case definition. For the 2001--02 season, sufficient data have been collected by using the new case definition to allow projection of the baseline using the regression procedure employed before the 2000--01 season. Figure 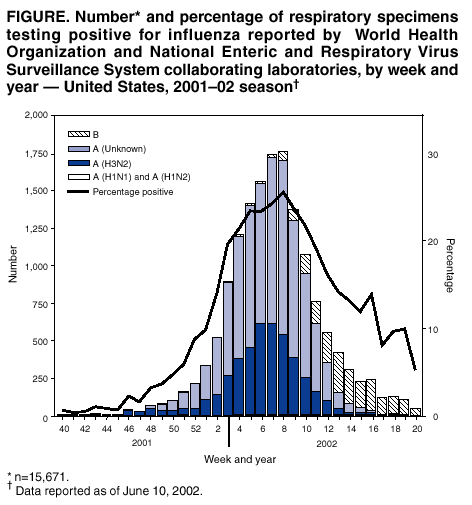 Return to top.
Disclaimer All MMWR HTML versions of articles are electronic conversions from ASCII text into HTML. This conversion may have resulted in character translation or format errors in the HTML version. Users should not rely on this HTML document, but are referred to the electronic PDF version and/or the original MMWR paper copy for the official text, figures, and tables. An original paper copy of this issue can be obtained from the Superintendent of Documents, U.S. Government Printing Office (GPO), Washington, DC 20402-9371; telephone: (202) 512-1800. Contact GPO for current prices. **Questions or messages regarding errors in formatting should be addressed to mmwrq@cdc.gov.Page converted: 6/13/2002 |
|||||||||
This page last reviewed 6/13/2002
|