 |
|
|
|
|
|
|
| ||||||||||
|
|
|
|
|
|
|
||||
| ||||||||||
|
|
|
|
|
Persons using assistive technology might not be able to fully access information in this file. For assistance, please send e-mail to: mmwrq@cdc.gov. Type 508 Accommodation and the title of the report in the subject line of e-mail. Update: Influenza Activity --- United States, 2001--02 SeasonAlthough influenza activity in the United States remained low from October through mid-January, the number and percentage of specimens testing positive for influenza viruses have increased in recent weeks. Laboratory-confirmed influenza infections have been reported from 45 states. The predominant influenza viruses isolated this season have been type A (H3N2) viruses that are well matched by this season's influenza vaccine. This report summarizes U.S. influenza activity from September 30, 2001 through January 19, 2002 and updates the previous summary* (1). During September 30--January 19, World Health Organization collaborating laboratories and National Respiratory and Enteric Virus Surveillance System laboratories in the United States tested 25,779 respiratory specimens for influenza viruses; 1,299 (5%) were positive. The weekly percentage of specimens testing positive for influenza increased from 3.9% during the week ending December 1 to 13.9% during the week ending January 19 (week 3) (Figure 1). The percentage of positive influenza infections identified each week is a key indicator of influenza activity and has peaked at 24%--33% during recent seasons. Since September 30, 1,299 influenza isolates have been reported; 1,278 (98%) were influenza A viruses, and 21 (2%) were influenza B viruses. Of the 477 influenza A viruses that have been subtyped, 469 (98%) were A (H3N2) viruses and eight (2%) were A (H1N1) viruses. CDC has characterized antigenically 94 influenza isolates collected in the United States since September: 89 influenza A (H3N2) viruses, four influenza A (H1N1) viruses, and one influenza B virus. All were similar to the vaccine strains A/Panama/2007/99 (H3N2), A/New Caledonia/20/99 (H1N1), and B/Sichuan/379/99. During November 25--January 19, the weekly percentage of patient visits for influenza-like illness (ILI)† reported by U.S. sentinel physicians in 47 states ranged from 1.3% to 2.2%. During week 3, the percentage of visits for ILI was 2.2%, slightly above the national baseline§ of 1.9%. During the same week, influenza activity¶ was reported by state epidemiologists as widespread in Colorado, New York, Utah, and Virginia and regional in 11 states. During week 3, 7.7% of recorded deaths in the 122 Cities Mortality Reporting System were attributed to pneumonia and influenza (P&I), which is below the epidemic threshold** of 8.1% for that week. The percentage of P&I deaths has remained below the epidemic threshold for each week during September 30--January 19. Reported by: WHO collaborating laboratories. National Respiratory and Enteric Virus Surveillance System laboratories. Sentinel Physicians Influenza Surveillance System. Div of Public Health Surveillance and Informatics, Epidemiology Program Office; Div of Vital Statistics, National Center for Health Statistics; WHO Collaborating Center for Surveillance, Epidemiology, and Control of Influenza, T Uyeki, MD, A Postema, MPH, L Brammer, MPH, H Hall, A Klimov, PhD, K Fukuda, MD, N Cox, PhD, Div of Viral and Rickettsial Diseases, National Center for Infectious Diseases, CDC. Editorial Note:During November 25--January 19, all four influenza surveillance system components indicated low levels of influenza activity nationally. However, influenza activity recently began to increase nationally and is expected to increase further in the coming weeks. During 15 of the past 25 seasons, influenza activity in the United States peaked during February or later. The predominant viruses isolated so far this season have been influenza A (H3N2) viruses, and all of the U.S. isolates characterized antigenically at CDC this season have been well matched by the vaccine strains. The best protection against influenza is vaccination, and approximately 10 million doses of 2001--02 influenza vaccine remain available. Health-care providers should continue to offer influenza vaccine during February because influenza activity is expected to increase, and unvaccinated persons can benefit from vaccination even after influenza has been detected in their communities. Influenza vaccine is strongly recommended for those at increased risk for serious complications from influenza (e.g., persons aged 6 months--64 years with certain chronic medical conditions and persons aged >65 years) and health-care providers (2). In addition, household contacts of high-risk persons, healthy persons aged 50--64 years, and any person who wants to reduce their risk for becoming ill with influenza should be vaccinated. Prompt laboratory diagnosis of influenza can guide clinical decision-making and confirm influenza as the cause of respiratory outbreaks in all settings (e.g., nursing homes and hospitals). Immunofluorescence and enzyme immunoassay are available in some laboratories. Commercially available rapid influenza diagnostic tests differ by their ability to detect and distinguish between influenza A and B virus infections, methodologies, processing time, acceptable respiratory specimens, and cost. Some rapid tests are approved for use in a physician's office, and others are considered moderately complex and must be performed at a clinical laboratory. One test detects only influenza A viruses, another test detects and distinguishes between influenza A and B viruses, and three tests detect but do not distinguish between infection with influenza A or B viruses. Respiratory specimens for rapid testing generally should be obtained within 3--4 days of illness onset. The sensitivities of the rapid tests are lower than viral culture of respiratory specimens and a negative result might not exclude influenza virus infection (3--5). When rapid tests are used to detect influenza outbreaks, respiratory specimens also should be obtained and sent for confirmatory viral culture. Information has been published about detection and control of influenza outbreaks in acute-care and long-term--care facilities (6--7). Antiviral medications can be useful for early treatment of influenza and as an adjunct to influenza vaccination for influenza prevention and control. Influenza antiviral drugs differ in approved ages, recommended dosages, routes of administration, adverse effects, development of antiviral resistance, and cost. When administered within 48 hours of symptom onset, antiviral treatment of influenza can reduce the duration of illness by approximately 1 day in healthy adults (8). Four prescription antiviral medications (amantadine, rimantadine, oseltamivir, and zanamivir) are approved for treatment of influenza A virus infections. Oseltamivir and zanamivir also are approved for treatment of influenza B virus infections. Antiviral chemoprophylaxis is approximately 70%--90% effective in preventing illness in healthy adults (8). Amantadine, rimantadine, and oseltamivir are approved for chemoprophylaxis of influenza A virus infections; only oseltamivir is approved for chemoprophylaxis of influenza B virus infections. Physicians should consult the package inserts of the antiviral drugs for information on approved age groups, dosing, and adverse effects. CDC collects and reports U.S. influenza surveillance data during October--May. This information is updated weekly and is available through CDC voice information, 888-232-3228, fax information, 888-232-3299 (request document number 361100), or at http://www.cdc.gov/ncidod/diseases/flu/weekly.htm. Acknowledgement This report was based on data contributed by participating state and territorial epidemiologists and state health laboratories; WHO collaborating laboratories; National Respiratory and Enteric Virus Surveillance System laboratories; Sentinel Physicians Influenza Surveillance System; Div of Public Health Surveillance and Informatics; Epidemiology Program Office; Div of Vital Statistics; and the National Center for Health Statistics, CDC. References
* As of January 24, 2002. † Temperature of >100.0 F (>37.8 C) and either cough or sore throat in the absence of a known cause. § The national baseline was calculated as the mean percentage of visits for ILI during noninfluenza weeks plus two standard deviations. Because of wide variability in regional level data, to calculate region-specific baselines is not possible and to apply the national baseline to regional level data is not appropriate. ¶ Levels of activity: 1) no activity, 2) sporadic---sporadically occurring ILI or laboratory-confirmed influenza with no outbreaks detected, 3) regional---outbreaks of ILI or laboratory-confirmed influenza in counties with a combined population of <50% of the state's population, and 4) widespread---outbreaks of ILI or laboratory-confirmed influenza in counties with a combined population of >50% of the state's population. ** The expected baseline proportion of P&I deaths reported by the 122 Cities Mortality Reporting System is projected using a robust regression procedure in which a periodic regression model is applied to the observed percentage of deaths from P&I since 1983. The epidemic threshold is 1.654 standard deviations above the seasonal baseline. Before the 1999--2000 season, a new case definition for a P&I death was introduced. During the summer of 2000, the baseline and epidemic thresholds were adjusted manually to account for these changes in case definition. For the 2001--02 season, sufficient data have been collected using the new case definition to allow projection of the baseline using the regression procedure employed before the 2000--01 season.
Figure 1 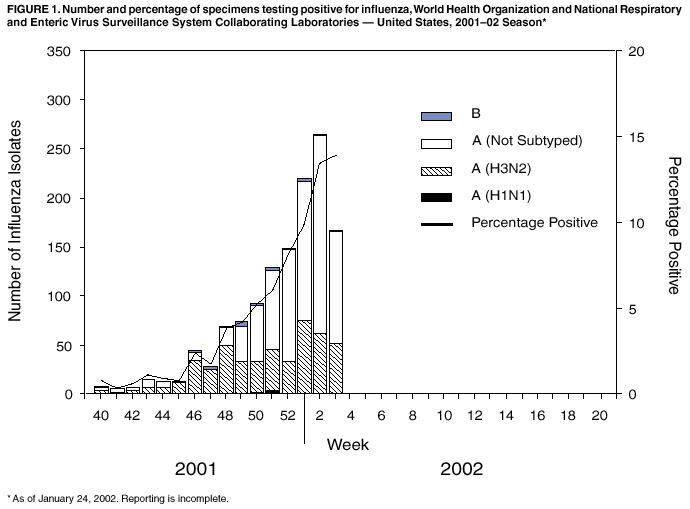 Return to top.
Disclaimer All MMWR HTML versions of articles are electronic conversions from ASCII text into HTML. This conversion may have resulted in character translation or format errors in the HTML version. Users should not rely on this HTML document, but are referred to the electronic PDF version and/or the original MMWR paper copy for the official text, figures, and tables. An original paper copy of this issue can be obtained from the Superintendent of Documents, U.S. Government Printing Office (GPO), Washington, DC 20402-9371; telephone: (202) 512-1800. Contact GPO for current prices. **Questions or messages regarding errors in formatting should be addressed to mmwrq@cdc.gov.Page converted: 1/31/2002 |
|||||||||
This page last reviewed 1/31/2002
|