Skip Navigation LinksSkip Navigation Links
Centers for Disease Control and Prevention
Safer Healthier People
Blue White
Blue White
bottom curve
CDC Home Search Health Topics A-Z spacer spacer
spacer
Blue curve MMWR spacer
spacer
spacer

Notifiable Diseases/Deaths in Selected Cities Weekly Information

Figure I   Selected notifiable disease reports, comparison of provisional 4-week totals ending December 11, 1999, with historical data -- United States

Table I   Summary -- provisional cases of selected notifiable diseases, United States, cumulative, week ending December 11, 1999 (49th Week)

Table II   Provisional cases of selected notifiable diseases, United States, weeks ending December 11, 1999 and December 12, 1998 (49th Week)

Table III   Provisional cases of selected notifiable diseases preventable by vaccination, United States, weeks ending December 11, 1999 and December 12, 1998 (49th Week)

Table IV   Deaths in 122 U.S. cities, week ending December 11, 1999 (49th Week)


Figure I

Figure I
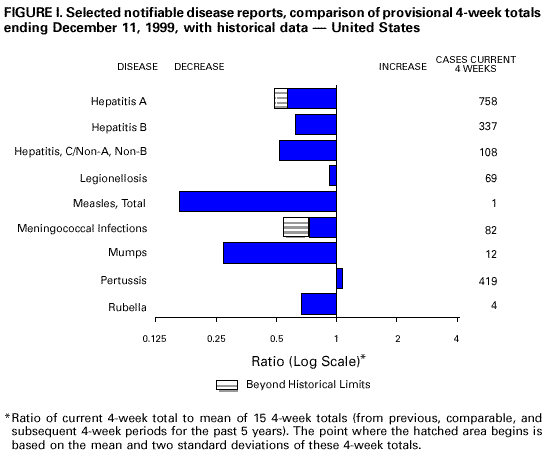
Return to top.

Table I
Note: To print large tables and graphs users may have to change their printer settings to landscape and use a small font size.
TABLE I. Summary -- provisional cases of selected notifiable diseases, United
States, cumulative, week ending December 11, 1999 (49th Week)
==================================================================================
                                             Cum. 1999
------------------------------------------------------
Anthrax                                              -
Brucellosis*                                        48
Cholera                                              3
Congenital rubella syndrome                          6
Cyclosporiasis*                                     50
Diphtheria                                           1
Encephalitis:  California*                          60
               eastern equine*                       6
               St. Louis*                            5
               western equine*                       1
Ehrlichiosis   human granulocytic (HGE)*           149
               human monocytic (HME)*               40
Hansen Disease*                                     93
Hantavirus pulmonary syndrome*+                     20
Hemolytic uremic syndrome, post-diarrheal*         117
HIV infection, pediatric*&                         137
Plague                                               8
Poliomyelitis, paralytic                             -
Psittacosis*                                        16
Rabies, human                                        -
Rocky Mountain spotted fever (RMSF)                534
Streptococcal disease, invasive Group A          2,014
Streptococcal toxic-shock syndrome*                 36
Syphilis, congenital@                              271
Tetanus                                             31
Toxic-shock syndrome                               113
Trichinosis                                          9
Typhoid fever                                      294
Yellow fever                                         1
------------------------------------------------------
-: no reported cases
 * Not notifiable in all states
 + Updated weekly from reports to the Division of Viral and Rickettsial
   Diseases, National Center for Infectious Diseases (NCID).
 & Updated monthly from reports to the Division of HIV/AIDS Prevention --
   Surveillance and Epidemiology, National Center for HIV, STD, and TB
   Prevention (NCHSTP), last update November 28, 1999.
 @ Updated from reports to the Division of STD Prevention, NCHSTP.

==================================================================================


Return to top.

Table II
Note: To print large tables and graphs users may have to change their printer settings to landscape and use a small font size.
TABLE II. (page 1) Provisional cases of selected notifiable diseases, United States, weeks ending
December 11, 1999, and December 12, 1998 (49th Week)

                                                                                                    Escherichia
                                                                                                   coli O157:H7*
                                                                                     -----------------------------------------
                          AIDS              Chlamydia          Cryptosporidiosis            NETSS                  PHLIS
                   -----------------   --------------------   -------------------    -------------------      ----------------
                     Cum.       Cum.        Cum.       Cum.       Cum.       Cum.        Cum.       Cum.       Cum.       Cum.
Reporting Area       1999**     1998        1999       1998       1999       1999        1999       1998       1999       1998
------------------------------------------------------------------------------------------------------------------------------
UNITED STATES      40,933     42,308     558,680    558,222      2,265      3,566       3,319      2,832      2,225      2,118

NEW ENGLAND         2,090      1,664      19,769     18,990        158        147         393        324        341        274
Maine                  75         28         904        963         30         31          39         36          -          -
N.H.                   45         34         903        914         19         16          34         46         33         45
Vt.                    16         18         438        389         36         26          32         21         20         18
Mass.               1,338        844       8,616      7,862         52         67         170        144        183        154
R.I.                   96        119       2,159      2,171          6          7          27         13         26          1
Conn.                 520        621       6,749      6,691         15          U          91         64         79         56

MID. ATLANTIC      10,473     11,353      55,879     58,213        411        559         308        294         92         86
Upstate N.Y.        1,196      1,322           N          N        169        328         246        213          -          -
N.Y. City           5,571      6,520      21,963     24,764        116        206          11         14         17         13
N.J.                1,932      2,007      10,095     11,130         36         25          51         67         46         52
Pa.                 1,774      1,504      23,821     22,319         90          N           N          N         29         21

E.N. CENTRAL        2,801      3,061      81,247     94,937        564        720         687        448        484        367
Ohio                  448        645      26,294     25,697         66         71         246        123        199         76
Ind.                  320        473      10,586     10,458         38         59         107        101         64         54
Ill.                1,345      1,188      24,169     25,116         67         84         221        110         81         80
Mich.                 555        577      20,198     20,469         48         38         113        114         76         69
Wis.                  133        178           U     13,197        345        468           N          N         64         88

W.N. CENTRAL          940        827      33,074     33,165        202        334         586        470        406        398
Minn.                 178        163       6,441      6,660         78        142         229        195        178        209
Iowa                   77         62       4,649      4,245         55         65         115         91         73         59
Mo.                   449        400      12,427     11,885         29         26          60         51         64         63
N. Dak.                 6          5         707        977         18         30          17         12         14         15
S. Dak.                15         15       1,496      1,477          7         25          47         35         62         38
Nebr.                  65         66       3,128      2,657         14         35          97         50          -          -
Kans.                 150        116       4,226      5,264          1         11          21         36         15         14

S. ATLANTIC        11,305     11,023     119,300    108,094        373        341         341        245        163        168
Del.                  159        152       2,604      2,461          -          3           6          -          3          2
Md.                 1,344      1,482      10,616      6,888         17         19          42         42          4         14
D.C.                  637        808           N          N          8         25           1          1          U          U
Va.                   782        908      13,268     12,983         27         20          73          N         59         52
W. Va.                 64         77       1,240      2,293          3          2          14         13         11         10
N.C.                  739        753      20,705     20,644         33          N          74         56         52         47
S.C.                  919        720      11,346     16,770          -          -          20         15         14         12
Ga.                 1,581      1,173      30,893     22,576        132        127          36         76          -          -
Fla.                5,080      4,950      28,628     23,479        153        145          75         42         20         31

E.S. CENTRAL        1,796      1,681      42,694     38,802         35         25         132        118         58         64
Ky.                   255        262       7,014      6,083          7         10          46         35          -          -
Tenn.                 706        621      13,081     13,021         11          9          54         53         38         40
Ala.                  449        455      12,004      9,704         12          N          26         24         16         20
Miss.                 386        343      10,595      9,994          5          6           6          6          4          4

W.S. CENTRAL        4,177      5,129      79,259     84,486         84        909         128        102        124        106
Ark.                  188        189       5,585      3,871          2          6          15         11          8         10
La.                   813        874      11,220     14,301         22         16           9          5         14          7
Okla.                 123        274       7,763      8,878         12          N          31         24         27          9
Tex.                3,053      3,792      54,691     57,436         48        887          73         62         75         80

MOUNTAIN            1,608      1,478      29,725     31,557         98        122         320        360        224        246
Mont.                  13         28       1,496      1,205         13         10          25         16          -          5
Idaho                  22         28       1,631      1,917          8         17          65         41         43         25
Wyo.                   11          3         741        665          1          2          15         53         14         55
Colo.                 290        286       5,417      7,963         14         19         107         89         88         69
N. Mex.                82        203       3,870      3,699         42         47          13         19          6         20
Ariz.                 819        588      11,767     10,890         12         18          37         43         23         26
Utah                  142        128       2,021      2,053          N          N          38         75         48         22
Nev.                  229        214       2,782      3,165          8          9          20         24          2         24

PACIFIC             5,743      6,092      97,733     89,978        340        409         424        471        333        409
Wash.                 337        386      11,370     10,356          N          N         167        109        159        130
Oreg.                 208        166       5,698      5,376         93         67          74        107         68        100
Calif.              5,089      5,364      76,276     69,991        247        338         171        248         94        163
Alaska                 15         17       1,770      1,791          -          1           1          7          1          -
Hawaii                 94        159       2,619      2,464          -          3          11          -         11         16

Guam                   10          1         299        404          -          -           N          N          U          U
P.R.                1,180      1,601           U          U          -          N           9          5          U          U
V.I.                   35         31           U          U          U          U           U          U          U          U
Amer. Samoa             -          -           U          U          U          U           U          U          U          U
C.N.M.I.                -          -           U          U          U          U           U          U          U          U
------------------------------------------------------------------------------------------------------------------------------
N: Not notifiable    U: Unavailable    -: no reported cases    C.N.M.I.: Commonwealth of North Mariana Islands

 * Individual cases may be reported through both the National Electronic Telecommunications System for Surveillance (NETSS)
   and the Public Health Laboratory Information System (PHLIS).
** Updated monthly from reports to the Division of HIV/AIDS Prevention -- Surveillance and Epidemiology, National Center for HIV,
   STD, and TB Prevention, last update November 28, 1999.

=======================================================================================================================================================

TABLE II. (page 2) Provisional cases of selected notifiable diseases, United States, weeks ending
December 11, 1999, and December 12, 1998 (49th Week)

                                            Hepatitis                                       Lyme
                       Gonorrhea             C/NA,NB             Legionellosis             Disease
                   -----------------   --------------------   -------------------    -------------------
                     Cum.       Cum.        Cum.       Cum.       Cum.       Cum.        Cum.       Cum.
Reporting Area       1999       1998        1999       1998       1999       1998        1999       1998
--------------------------------------------------------------------------------------------------------
UNITED STATES     306,829    333,630       2,992      3,151        896      1,221      12,207     15,094

NEW ENGLAND         6,177      5,724          14         58         78         84       3,389      4,533
Maine                  71         63           2          -          3          1          41         78
N.H.                  105         88           -          -          8          7          23         43
Vt.                    44         35           7          6         14          7          23         11
Mass.               2,383      2,147           2         49         28         33         945        690
R.I.                  543        394           3          3         11         21         464        650
Conn.               3,031      2,997           -          -         14         15       1,893      3,061

MID. ATLANTIC      35,884     36,402          92        205        182        309       6,920      8,402
Upstate N.Y.        6,395      6,923          57        102         56        107       3,760      3,910
N.Y. City          11,762     11,305           -          -          9         35          39        230
N.J.                5,962      7,491           -          U         18         18         922      1,802
Pa.                11,765     10,683          35        103         99        149       2,199      2,460

E.N. CENTRAL       53,864     65,262       1,423        648        243        398         176        754
Ohio               15,957     16,870           4          8         79        125          73         46
Ind.                5,791      6,132           1          5         43         75          21         37
Ill.               17,967     20,791          41         40         23         52          12         14
Mich.              14,149     15,424         786        455         60         80           1         12
Wis.                    U      6,045         591        140         38         66          69        645

W.N. CENTRAL       14,198     16,724         299         43         51         63         288        226
Minn.               2,484      2,578          10         11         13          7         220        173
Iowa                1,155      1,415           -          8         15         10          19         26
Mo.                 7,179      8,847         277         15         14         16          26         12
N. Dak.                71         77           1          -          2          -           1          -
S. Dak.               186        209           -          -          3          3           -          -
Nebr.               1,297      1,120           5          5          4         19          10          4
Kans.               1,826      2,478           6          4          -          8          12         11

S. ATLANTIC        89,820     89,821         193        115        146        140       1,123        867
Del.                1,582      1,454           1          -         14         13          64         66
Md.                 9,012      9,135          41         21         32         35         785        608
D.C.                3,316      4,009           1          -          4          8           6          4
Va.                 9,015      9,106          11         12         38         20         118         68
W. Va.                387        824          17          7          N          N          17         13
N.C.               18,440     17,841          34         25         15         14          73         57
S.C.                6,744     10,728          22         11         11         11           7          7
Ga.                20,955     18,686           1          9          3          8           -          5
Fla.               20,369     18,038          65         30         29         31          53         39

E.S. CENTRAL       34,186     37,438         243        267         45         64          92        111
Ky.                 3,192      3,577          21         20         20         26          10         26
Tenn.              10,498     11,366          95        160         21         23          50         44
Ala.               10,812     12,322           1          4          4          8          19         24
Miss.               9,684     10,173         126         83          -          7          13         17

W.S. CENTRAL       43,893     52,174         314        543         23         31          43         31
Ark.                2,984      3,800          18         22          -          1           4          7
La.                 8,880     12,326         102        112          2          4           -          7
Okla.               3,792      4,960          15         16          3         12           4          2
Tex.               28,237     31,088         179        393         18         14          35         15

MOUNTAIN            8,881      8,665         146        362         47         71          18         18
Mont.                  54         44           5          7          -          2           -          -
Idaho                  80        168           7         86          3          2           5          6
Wyo.                   34         33          45         90          -          1           3          1
Colo.               2,316      1,956          22         31         12         18           -          -
N. Mex.               802        894           8         96          1          2           1          4
Ariz.               4,185      3,982          45         11          7         17           2          1
Utah                  216        217           6         21         18         21           5          -
Nev.                1,194      1,371           8         20          6          8           2          6

PACIFIC            19,926     21,420         268        910         81         61         158        152
Wash.               2,013      1,850          20         22         17         12          10          7
Oreg.                 827        803          22         19          N          N          14         21
Calif.             16,436     17,987         226        815         63         47         134        123
Alaska                275        300           -          -          1          1           -          1
Hawaii                375        480           -         54          -          1           N          N

Guam                   38         67           1          1          -          2           -          1
P.R.                  328        363           -          -          -          -           N          N
V.I.                    U          U           U          U          U          U           U          U
Amer. Samoa             U          U           U          U          U          U           U          U
C.N.M.I.                U          U           U          U          U          U           U          U

--------------------------------------------------------------------------------------------------------
N: Not notifiable    U: Unavailable    -: no reported cases
=======================================================================================================================================================

TABLE II. (page 3) Provisional cases of selected notifiable diseases, United States, weeks ending
December 11, 1999, and December 12, 1998 (49th Week)

                                                                            Salmonellosis*
                                                              ------------------------------------------
                        Malaria           Rabies, Animal             NETSS                  PHLIS
                   -----------------   --------------------   -------------------    -------------------
                     Cum.       Cum.        Cum.       Cum.       Cum.       Cum.        Cum.       Cum.
Reporting Area       1999       1998        1999       1998       1999       1998        1999       1998
--------------------------------------------------------------------------------------------------------
UNITED STATES       1,271      1,408       5,668      6,928     36,293     40,176      29,030     32,380

NEW ENGLAND            63         69         862      1,397      2,086      2,419       2,025      2,205
Maine                   3          5         171        232        128        162          99         64
N.H.                    2          5          50         77        136        178         140        215
Vt.                     4          1          88         65         91        138          85        109
Mass.                  24         26         216        489      1,113      1,267       1,118      1,296
R.I.                    5         14          93         97        121        142         147         34
Conn.                  25         18         244        437        497        532         436        487

MID. ATLANTIC         320        406       1,092      1,536      4,610      6,313       4,082      5,566
Upstate N.Y.           67         87         776      1,055      1,305      1,536       1,268      1,309
N.Y. City             167        230           U          U      1,298      1,825       1,173      1,407
N.J.                   48         56         166        213        989      1,402         685      1,334
Pa.                    38         33         150        268      1,018      1,550         956      1,516

E.N. CENTRAL          140        141         146        123      5,153      6,024       3,273      4,656
Ohio                   18         15          36         57      1,257      1,445       1,011      1,103
Ind.                   19         10          13         12        512        645         406        509
Ill.                   54         57          10          N      1,495      1,853         399      1,512
Mich.                  39         47          87         35        920      1,115         906      1,041
Wis.                   10         12           -         19        969        966         551        491

W.N. CENTRAL           72         91         664        686      2,120      2,191       2,183      2,251
Minn.                  41         56         107        114        619        550         657        636
Iowa                   13          7         153        147        264        352         197        285
Mo.                    14         14          14         41        689        592         876        820
N. Dak.                 -          2         137        138         51         59          49         67
S. Dak.                 -          1         163        151         93        120         115        127
Nebr.                   -          1           3          7        185        174          78         46
Kans.                   4         10          87         88        219        344         211        270

S. ATLANTIC           341        302       2,031      2,248      8,560      8,249       6,002      5,934
Del.                    1          3          43         49        138         74         153        116
Md.                    93         86         381        424        841        877         952        866
D.C.                   18         19           -          -         69         83           U          U
Va.                    70         56         554        534      1,206      1,057         943        835
W. Va.                  3          2         106         76        163        147         148        158
N.C.                   31         29         404        538      1,269      1,243       1,243      1,383
S.C.                   17          6         133        143        675        605         479        527
Ga.                    28         36         231        290      1,474      1,631       1,644      1,494
Fla.                   80         65         179        194      2,725      2,532         440        555

E.S. CENTRAL           24         32         252        264      1,995      2,245       1,062      1,528
Ky.                     7          7          35         31        393        347           -        124
Tenn.                   8         16          93        135        513        574         509        686
Ala.                    7          6         123         96        575        668         476        561
Miss.                   2          3           1          2        514        656          77        157

W.S. CENTRAL           16         54          94         28      3,598      4,699       3,546      3,102
Ark.                    3          1          14         28        626        589         120        367
La.                    10         14           -          -        334        744         568        787
Okla.                   2          3          80          N        406        468         320        225
Tex.                    1         36           -          -      2,232      2,898       2,538      1,723

MOUNTAIN               43         61         197        246      2,918      2,435       2,411      1,938
Mont.                   4          1          59         53         81         76           1         43
Idaho                   3          8           5          N        125        118          98         94
Wyo.                    1          -          44         64         67         63          49         57
Colo.                  17         18           1         42        679        518         689        488
N. Mex.                 2         12           9          6        362        288         245        255
Ariz.                   8          9          66         48        913        798         762        663
Utah                    4          1           8         27        506        341         514        122
Nev.                    4         12           5          6        185        233          53        216

PACIFIC               252        252         330        400      5,253      5,601       4,446      5,200
Wash.                  27         20           -          -        634        493         795        666
Oreg.                  21         15           2          7        409        314         480        322
Calif.                192        207         321        370      3,833      4,457       2,875      3,881
Alaska                  1          3           7         23         53         56          30         36
Hawaii                 11          7           -          -        324        281         266        295

Guam                    -          2           -          -         24         42           U          U
P.R.                    -          -          66         49        433        769           U          U
V.I.                    U          U           U          U          U          U           U          U
Amer. Samoa             U          U           U          U          U          U           U          U
C.N.M.I.                U          U           U          U          U          U           U          U

--------------------------------------------------------------------------------------------------------
N: Not notifiable    U: Unavailable    -: no reported cases

* Individual cases may be reported through both the National Electronic Telecommunications System for Surveillance (NETSS)
  and the Public Health Laboratory Information System (PHLIS).
=======================================================================================================================================================

TABLE II. (page 4) Provisional cases of selected notifiable diseases, United States, weeks ending
December 11, 1999, and December 12, 1998 (49th Week)

                                  Shigellosis*
                    ---------------------------------------          Syphilis
                         NETSS                  PHLIS          (Primary & Secondary)      Tuberculosis
                    ----------------       ----------------    ---------------------    ------------------
                     Cum.       Cum.        Cum.       Cum.       Cum.       Cum.        Cum.       Cum.
Reporting Area       1999       1998        1999       1998       1999       1998        1999**     1998**
----------------------------------------------------------------------------------------------------------
UNITED STATES      15,097     21,128       7,476     11,831      6,146      6,697      13,220     16,101

NEW ENGLAND           821        401         786        355         57         76         406        414
Maine                   5         14           -          -          -          1          18         11
N.H.                   17         16          17         20          1          2          10          -
Vt.                     6          7           4          4          3          4           2          5
Mass.                 703        258         687        253         35         43         232        239
R.I.                   23         36          18         13          2          1          39         52
Conn.                  67         70          60         65         16         25         105        107

MID. ATLANTIC         897      2,296         454      1,657        186        310       2,380      2,882
Upstate N.Y.          266        613          67        220         23         36         304        360
N.Y. City             281        689          82        575         79         79       1,264      1,363
N.J.                  194        650         155        608         51        101         479        583
Pa.                   156        344         150        254         33         94         333        576

E.N. CENTRAL        2,843      2,842       1,274      1,517      1,328        978       1,186      1,588
Ohio                  411        495         136        141         87        128         228        221
Ind.                  324        171         101         43        646        201          93        152
Ill.                1,048      1,518         592      1,261        365        396         508        766
Mich.                 474        262         368          4        230        194         272        344
Wis.                  586        396          77         68          U         59          85        105

W.N. CENTRAL        1,069      1,035         721        600        108        131         447        467
Minn.                 238        298         229        325          9          9         187        146
Iowa                   66         66          48         45          9          2          50         51
Mo.                   638        190         352        129         72         99         152        163
N. Dak.                 3         10           2          3          -          -           6         10
S. Dak.                18         32          10         23          -          1          17         17
Nebr.                  69        367          35         19          8          7          16         28
Kans.                  37         72          45         56         10         13          19         52

S. ATLANTIC         2,385      4,132         485      1,233      1,925      2,439       2,784      3,032
Del.                   13         44           9         37          8         21          12         34
Md.                   157        197          58         66        310        643         248        279
D.C.                   51         37           U          U         59         85          47        102
Va.                   129        192          61         87        148        144         265        280
W. Va.                  8         11           5          8          2          3          37         41
N.C.                  200        339          86        179        421        691         394        448
S.C.                  123        178          62         94        245        309         218        270
Ga.                   227      1,051          85        240        396        276         556        514
Fla.                1,477      2,083         119        522        336        267       1,007      1,064

E.S. CENTRAL        1,064      1,445         483      1,123      1,084      1,163         847      1,152
Ky.                   229        145           -         45         99        103         166        157
Tenn.                 600        801         426        852        602        545         334        436
Ala.                  111        445          47        219        202        270         291        355
Miss.                 124         54          10          7        181        245          56        204

W.S. CENTRAL        2,438      4,434       2,337      1,392        898      1,022       1,462      2,328
Ark.                   74        201          23         61         79        107         161        143
La.                   118        332         128        281        208        409           U        278
Okla.                 456        617         153        191        175         92         122        155
Tex.                1,790      3,284       2,033        859        436        414       1,179      1,752

MOUNTAIN            1,127      1,246         722        728        223        229         427        534
Mont.                   9          8           -          3          1          -          13         19
Idaho                  28         19          12         14          1          2          15         11
Wyo.                    3          3           1          1          -          1           3          4
Colo.                 193        222         155        159          2         10           U         67
N. Mex.               139        289          89        173         11         22          59         65
Ariz.                 599        594         395        324        200        175         215        205
Utah                   66         46          64         34          2          4          40         48
Nev.                   90         65           6         20          6         15          82        115

PACIFIC             2,453      3,297         214      3,226        337        349       3,281      3,704
Wash.                 117        219          99        188         64         27         168        242
Oreg.                  95        190          85        151         10          5          99        126
Calif.              2,205      2,830           -      2,830        259        313       2,793      3,119
Alaska                  3          9           3          7          1          1          53         51
Hawaii                 33         49          27         50          3          3         168        166

Guam                    8         36           U          U          1          1          11         84
P.R.                  106         62           U          U        151        167          41        140
V.I.                    U          U           U          U          U          U           U          U
Amer. Samoa             U          U           U          U          U          U           U          U
C.N.M.I.                U          U           U          U          U          U           U          U

----------------------------------------------------------------------------------------------------------
N: Not notifiable    U: Unavailable    -: no reported cases

 * Individual cases may be reported through both the National Electronic Telecommunications System for Surveillance (NETSS)
   and the Public Health Laboratory Information System (PHLIS).
** Cumulative reports of provisional tuberculosis cases for 1998 and 1999 are unavailable ('U') for some
   areas using the Tuberculosis Information Management System (TIMS).

=======================================================================================================================================================


Return to top.

Table III
Note: To print large tables and graphs users may have to change their printer settings to landscape and use a small font size.
TABLE III. (page 1) Provisional cases of selected notifiable diseases preventable by vaccination, United
States, weeks ending December 11, 1999, and December 12, 1998 (49th Week)

                                                Hepatitis (Viral), by type                                    Measles (Rubeola)
                     H. influenzae,       ---------------------------------------        ------------------------------------------------------------
                        invasive                  A                     B                  Indigenous            Imported*                 Total
                    ----------------      -----------------     -----------------        ---------------       ---------------        ---------------
                     Cum.       Cum.        Cum.       Cum.       Cum.       Cum.                   Cum.                  Cum.        Cum.       Cum.
Reporting Area       1999**     1998        1999       1998       1999       1998        1999       1999       1999       1999        1999       1998
-----------------------------------------------------------------------------------------------------------------------------------------------------
UNITED STATES       1,088      1,003      15,794     21,068      6,003      9,059           -         60          1         25          85         90

NEW ENGLAND            94         68         283        281        134        212           -          6          -          5          11          3
Maine                   8          3          14         20          1          5           -          -          -          -           -          -
N.H.                   21         10          18         15         16         19           -          -          -          1           1          -
Vt.                     5          9          19         17          3         10           -          -          -          -           -          1
Mass.                  36         39         108        119         41         77           -          5          -          3           8          2
R.I.                    6          6          21         17         34         68           U          -          U          -           -          -
Conn.                  18          1         103         93         39         33           -          1          -          1           2          -

MID. ATLANTIC         169        166         913      1,638        555      1,167           -          -          -          2           2         14
Upstate N.Y.           76         62         256        346        172        231           -          -          -          2           2          2
N.Y. City              41         43         300        579        186        409           -          -          -          -           -          -
N.J.                   49         51         112        331         41        194           U          -          U          -           -          8
Pa.                     3         10         245        382        156        333           -          -          -          -           -          4

E.N. CENTRAL          159        171       2,628      3,441        625      1,362           -          1          -          2           3         16
Ohio                   56         46         628        312         88         74           -          -          -          -           -          1
Ind.                   23         43         107        156         43        107           -          1          -          1           2          3
Ill.                   66         62         646        761          1        225           -          -          -          -           -          1
Mich.                  13         13       1,180      2,029        469        463           -          -          -          1           1         10
Wis.                    1          7          67        183         24        493           -          -          -          -           -          1

W.N. CENTRAL           88         87         874      1,273        344        391           -          1          -          -           1          -
Minn.                  47         66          95        124         54         49           -          1          -          -           1          -
Iowa                   10          3         143        394         39         53           -          -          -          -           -          -
Mo.                    22         10         534        590        207        235           -          -          -          -           -          -
N. Dak.                 1          -           3          3          2          4           -          -          -          -           -          -
S. Dak.                 1          1           9         32          1          2           -          -          -          -           -          -
Nebr.                   3          1          50         26         14         21           -          -          -          -           -          -
Kans.                   4          6          40        104         27         27           U          -          U          -           -          -

S. ATLANTIC           252        176       1,950      1,925      1,168        991           -         14          -          6          20          8
Del.                    -          1           2          6          1          4           -          -          -          -           -          1
Md.                    66         52         339        394        165        132           -          -          -          -           -          1
D.C.                    5          -          58         64         24         18           U          -          U          -           -          -
Va.                    20         18         171        199         96         99           -         14          -          4          18          2
W. Va.                  7          6          39          7         23         10           -          -          -          -           -          -
N.C.                   35         24         156        123        212        227           -          -          -          -           -          -
S.C.                    6          3          47         38         65         46           -          -          -          -           -          -
Ga.                    67         44         446        638        159        138           -          -          -          -           -          2
Fla.                   46         28         692        456        423        317           -          -          -          2           2          2

E.S. CENTRAL           62         61         390        382        414        479           -          2          -          -           2          2
Ky.                     7          7          62         30         42         47           -          2          -          -           2          -
Tenn.                  35         36         174        211        211        266           -          -          -          -           -          1
Ala.                   17         15          50         73         78         72           -          -          -          -           -          1
Miss.                   3          3         104         68         83         94           -          -          -          -           -          -

W.S. CENTRAL           46         53       3,612      3,857        803      1,993           -         10          -          4          14          -
Ark.                    2          -          68         79         69        104           -          5          -          -           5          -
La.                     7         21          73        114         77        163           U          -          U          -           -          -
Okla.                  33         29         435        591        129        108           -          -          -          -           -          -
Tex.                    4          3       3,036      3,073        528      1,618           -          5          -          4           9          -

MOUNTAIN              105        110       1,231      2,994        543        783           -          4          -          -           4          5
Mont.                   3          -          17         93         17          5           -          -          -          -           -          -
Idaho                   1          2          43        231         29         46           -          -          -          -           -          -
Wyo.                    1          1           7         37         13          9           -          -          -          -           -          -
Colo.                  11         21         206        324         91        102           -          -          -          -           -          -
N. Mex.                18          7          50        147        169        306           -          -          -          -           -          -
Ariz.                  56         55         715      1,760        139        170           -          1          -          -           1          5
Utah                   11          5          62        186         37         65           -          2          -          -           2          -
Nev.                    4         19         131        216         48         80           U          1          U          -           1          -

PACIFIC               113        111       3,913      5,277      1,417      1,681           -         22          1          6          28         42
Wash.                   7          9         372        927         73        108           -          -          -          -           -          1
Oreg.                  40         40         238        422        100        193           -          9          -          -           9          -
Calif.                 48         49       3,271      3,858      1,213      1,352           -         13          -          4          17          8
Alaska                  9          4          12         17         17         13           -          -          -          -           -         33
Hawaii                  9          9          20         53         14         15           -          -          1          2           2          -

Guam                    -          -           2          1          2          2           U          1          U          -           1          -
P.R.                    1          2         187         79        145        240           -          -          -          -           -          -
V.I.                    U          U           U          U          U          U           U          U          U          U           U          U
Amer. Samoa             U          U           U          U          U          U           U          U          U          U           U          U
C.N.M.I.                U          U           U          U          U          U           U          U          U          U           U          U
-----------------------------------------------------------------------------------------------------------------------------------------------------
N: Not notifiable    U: Unavailable     -: no reported cases

 * For imported measles, cases include only those resulting from importation from other countries.
** Of 212 cases among children aged <5 years, serotype was reported for 107 and of those, 31 were type b.
=======================================================================================================================================================

TABLE III. (page 2) Provisional cases of selected notifiable diseases preventable by vaccination, United
States, weeks ending December 11, 1999, and December 12, 1998 (49th Week)

                     Meningococcal
                        Disease                      Mumps                           Pertussis                          Rubella
                   -----------------        --------------------------       ---------------------------       ---------------------------
                     Cum.       Cum.                   Cum.       Cum.                   Cum.       Cum.                  Cum.        Cum.
Reporting Area       1999       1998        1999       1999       1998       1999        1999       1998       1999       1999        1998
------------------------------------------------------------------------------------------------------------------------------------------
UNITED STATES       2,197      2,484           4        322        614        127       5,560      6,494          1        232         352

NEW ENGLAND           107        112           -          8          9          7         686      1,009          -          7          38
Maine                   5          6           -          -          -          -           -          5          -          -           -
N.H.                   13         12           -          1          -          -          78        121          -          -           -
Vt.                     5          5           -          1          -          4          75         76          -          -           -
Mass.                  61         56           -          4          6          3         469        748          -          7           8
R.I.                    7          8           U          2          1          U          33         13          U          -           1
Conn.                  16         25           -          -          2          -          31         46          -          -          29

MID. ATLANTIC         204        266           2         35        191         18         913        620          -         25         149
Upstate N.Y.           64         76           1         14         12         11         723        317          -         21         114
N.Y. City              50         32           -          3        155          -          10         46          -          -          19
N.J.                   47         57           U          -          6          U          12         28          U          1          14
Pa.                    43        101           1         18         18          7         168        229          -          3           2

E.N. CENTRAL          372        379           -         43         77         48         542        830          -          2           -
Ohio                  126        133           -         18         28         44         268        279          -          -           -
Ind.                   67         72           -          5          7          1          74        173          -          1           -
Ill.                   96         99           -         11         10          1          82        127          -          1           -
Mich.                  45         44           -          7         29          2          66         69          -          -           -
Wis.                   38         31           -          2          3          -          52        182          -          -           -

W.N. CENTRAL          231        216           -         13         32         17         421        574          -        124          40
Minn.                  50         32           -          1         13         17         226        337          -          5           -
Iowa                   43         43           -          7         11          -          70         71          -         29           -
Mo.                    93         76           -          1          3          -          61         35          -          3           2
N. Dak.                 4          5           -          1          2          -          18          4          -          -           -
S. Dak.                11          8           -          -          -          -           7          8          -          -           -
Nebr.                  12         17           -          -          -          -           4         17          -         87           -
Kans.                  18         35           U          3          3          U          35        102          U          -          38

S. ATLANTIC           403        427           1         50         47          7         414        322          1         37          19
Del.                    8          2           -          -          -          -           5          5          -          -           -
Md.                    54         34           -          7          -          1         108         63          -          1           1
D.C.                    2          3           U          2          -          U           1          1          U          -           -
Va.                    53         45           -         10          8          -          51         41          -          -           1
W. Va.                  8         17           -          -          -          -           3          4          -          -           -
N.C.                   46         57           -          8         11          3          93         98          -         35          13
S.C.                   43         55           1          5          7          -          18         27          -          -           -
Ga.                    59         97           -          4          1          -          40         27          -          -           -
Fla.                  130        117           -         14         20          3          95         56          1          1           4

E.S. CENTRAL          144        195           -         13         18          -          89        148          -          1           2
Ky.                    31         37           -          -          1          -          25         79          -          -           -
Tenn.                  59         68           -          -          2          -          40         37          -          -           2
Ala.                   32         53           -         10          8          -          21         26          -          1           -
Miss.                  22         37           -          3          7          -           3          6          -          -           -

W.S. CENTRAL          174        290           -         33         59          1         158        359          -         15          88
Ark.                   35         30           -          -         13          1          19         82          -          6           -
La.                    34         55           U          3          7          U           3          9          U          -           -
Okla.                  31         40           -          1          -          -          12         32          -          -           -
Tex.                   74        165           -         29         39          -         124        236          -          9          88

MOUNTAIN              137        141           -         28         39         21         737      1,169          -         16           5
Mont.                   4          4           -          -          -          -           2         13          -          -           -
Idaho                  13         13           -          3          7          -         139        232          -          -           -
Wyo.                    5          8           -          -          1          -           2          8          -          -           -
Colo.                  35         28           -          5          6          8         207        324          -          1           -
N. Mex.                14         26           N          N          N          9         200         98          -          -           1
Ariz.                  42         39           -          8          6          4         117        191          -         13           1
Utah                   16         13           -          7          5          -          59        262          -          1           2
Nev.                    8         10           U          5         14          U          11         41          U          1           1

PACIFIC               425        458           1         99        142          8       1,600      1,463          -          5          11
Wash.                  63         64           -          2         11          6         609        329          -          -           6
Oreg.                  77         85           N          N          N          -          58         89          -          -           -
Calif.                271        301           1         82        104          2         894      1,005          -          5           3
Alaska                  6          3           -          3          3          -           5         15          -          -           -
Hawaii                  8          5           -         12         24          -          34         25          -          -           2

Guam                    2          2           U          1          5          U           1          1          U          -           -
P.R.                    7         11           -          -          7          1          20          9          -          -          14
V.I.                    U          U           U          U          U          U           U          U          U          U           U
Amer. Samoa             U          U           U          U          U          U           U          U          U          U           U
C.N.M.I.                U          U           U          U          U          U           U          U          U          U           U

------------------------------------------------------------------------------------------------------------------------------------------
N: Not notifiable    U: Unavailable     -: no reported cases

=======================================================================================================================================================


Return to top.

Table IV
Note: To print large tables and graphs users may have to change their printer settings to landscape and use a small font size.
TABLE IV. Deaths in 122 U.S. cities,* week ending
December 11, 1999 (49th Week)
===================================================================================================================================
                                                 All Causes, By Age (Years)
                          ------------------------------------------------------------------------        P&I**
Reporting Area            All Ages         >=65        45-64       25-44         1-24           <1        Total
---------------------------------------------------------------------------------------------------------------
NEW ENGLAND                    562          421           86          38           11            6           46
Boston, Mass.                  153          105           24          15            6            3           15
Bridgeport, Conn.               43           38            4           1            -            -            3
Cambridge, Mass.                22           17            2           2            -            1            2
Fall River, Mass.               35           30            5           -            -            -            1
Hartford, Conn.                 46           33           10           2            -            1            1
Lowell, Mass.                   28           20            7           1            -            -            3
Lynn, Mass.                      7            5            1           1            -            -            -
New Bedford, Mass.              25           22            1           1            1            -            1
New Haven, Conn.                43           30            7           4            2            -            6
Providence, R.I.                49           40            5           3            1            -            2
Somerville, Mass.                3            1            2           -            -            -            -
Springfield, Mass.              39           28            8           2            1            -            4
Waterbury, Conn.                 9            6            -           2            -            1            2
Worcester, Mass.                60           46           10           4            -            -            6

MID. ATLANTIC                2,429        1,697          496         162           35           38          110
Albany, N.Y.                    47           30           11           3            1            2            3
Allentown, Pa.                   U            U            U           U            U            U            U
Buffalo, N.Y.                  102           81           11           5            3            1            9
Camden, N.J.                    42           27            6           5            2            2            2
Elizabeth, N.J.                 10            9            1           -            -            -            2
Erie, Pa.                       38           30            5           3            -            -            2
Jersey City, N.J.               50           26           14           7            -            3            -
New York City, N.Y.          1,236          862          260          84           10           20           22
Newark, N.J.                    66           26           20          15            3            2            3
Paterson, N.J.                  32           18           10           3            -            1            1
Philadelphia, Pa.              419          296           88          22            9            4           29
Pittsburgh, Pa.***              59           36           14           5            4            -            2
Reading, Pa.                    28           21            7           -            -            -            1
Rochester, N.Y.                121           95           19           4            1            2           16
Schenectady, N.Y.               26           20            5           1            -            -            2
Scranton, Pa.                   43           37            3           2            1            -            2
Syracuse, N.Y.                  54           39           11           3            1            -            7
Trenton, N.J.                   30           20            9           -            -            1            5
Utica, N.Y.                     26           24            2           -            -            -            2
Yonkers, N.Y.                    U            U            U           U            U            U            U

E.N. CENTRAL                 2,072        1,388          421         148           60           55          162
Akron, Ohio                     62           50            8           2            1            1            6
Canton, Ohio                    34           28            5           1            -            -            4
Chicago, Ill.                  413          249           96          33           19           16           38
Cincinnati, Ohio                58           40           11           5            1            1            5
Cleveland, Ohio                131           75           30          14            6            6            8
Columbus, Ohio                 188          133           35          15            3            2           18
Dayton, Ohio                   153          107           31          10            3            2           14
Detroit, Mich.                 213          121           49          29            8            6           20
Evansville, Ind.                42           31            9           2            -            -            1
Fort Wayne, Ind.                57           39           11           1            3            3            -
Gary, Ind.                      10            6            4           -            -            -            -
Grand Rapids, Mich.             57           38           12           2            2            3            6
Indianapolis, Ind.             185          127           41           9            4            4            8
Lansing, Mich.                  47           34            8           5            -            -            5
Milwaukee, Wis.                128           99           20           5            2            2            9
Peoria, Ill.                    40           28            6           3            2            1            3
Rockford, Ill.                  49           32           12           3            2            -            2
South Bend, Ind.                63           48           12           1            -            2            5
Toledo, Ohio                    84           62           12           7            -            3            6
Youngstown, Ohio                58           41            9           1            4            3            4

W.N. CENTRAL                   935          671          178          45           18           23           70
Des Moines, Iowa               100           76           16           6            1            1            7
Duluth, Minn.                   55           42            8           3            1            1            1
Kansas City, Kans.              25           17            6           1            -            1            3
Kansas City, Mo.               111           77           24           6            2            2            5
Lincoln, Nebr.                  42           34            6           2            -            -            3
Minneapolis, Minn.             222          172           38           3            6            3           28
Omaha, Nebr.                    90           65           14           7            1            3            5
St. Louis, Mo.                 141           72           43          12            5            9            -
St. Paul, Minn.                 68           54           12           1            1            -           13
Wichita, Kans.                  81           62           11           4            1            3            5

S. ATLANTIC                  1,014          676          186          90           35           27           81
Atlanta, Ga.                     U            U            U           U            U            U            U
Baltimore, Md.                 118           72           30          10            5            1           11
Charlotte, N.C.                 93           66           16           7            3            1            8
Jacksonville, Fla.             141           99           24          13            5            -           15
Miami, Fla.                     98           68           18           8            3            1            9
Norfolk, Va.                    55           32            9           7            2            5            1
Richmond, Va.                   56           33           11           6            4            2            5
Savannah, Ga.                   56           39           12           3            1            1            6
St. Petersburg, Fla.            59           47            5           5            -            2            5
Tampa, Fla.                    225          166           37          10            8            4           19
Washington, D.C.                88           41           24           9            4           10            2
Wilmington, Del.                25           13            -          12            -            -            -

E.S. CENTRAL                   928          631          180          64           25           27           76
Birmingham, Ala.               177          115           37          11            4            9           21
Chattanooga, Tenn.              84           61           19           3            1            -            4
Knoxville, Tenn.                78           59           13           4            -            2            6
Lexington, Ky.                  85           49           24           5            5            2            6
Memphis, Tenn.                 215          136           43          23            6            7           20
Mobile, Ala.                    79           62            8           5            2            2            1
Montgomery, Ala.                64           46           12           5            -            1            6
Nashville, Tenn.               146          103           24           8            7            4           12

W.S. CENTRAL                 1,066          719          215          88           22           22           60
Austin, Tex.                    79           56           12           8            1            2            4
Baton Rouge, La.                30           21            6           1            1            1            1
Corpus Christi, Tex.            50           38            9           3            -            -            5
Dallas, Tex.                   200          131           42          22            3            2            5
El Paso, Tex.                   95           65           17           6            3            4            3
Ft. Worth, Tex.                111           77           25           8            1            -           11
Houston, Tex.                    U            U            U           U            U            U            U
Little Rock, Ark.               65           47           13           2            -            3            4
New Orleans, La.               108           55           29          14            6            4            4
San Antonio, Tex.              170          116           32          17            2            3           11
Shreveport, La.                 33           23            6           2            2            -            1
Tulsa, Okla.                   125           90           24           5            3            3           11

MOUNTAIN                     1,082          742          210          80           31           19           91
Albuquerque, N.M.              120           86           19           9            5            1           12
Boise, Idaho                    40           28            7           3            1            1            3
Colo. Springs, Colo.            59           44            8           3            1            3            4
Denver, Colo.                  106           63           21          10            5            7           15
Las Vegas, Nev.                260          183           55          18            4            -           14
Ogden, Utah                     18           15            2           1            -            -            -
Phoenix, Ariz.                 187          114           45          14            9            5           11
Pueblo, Colo.                   35           27            4           3            1            -            3
Salt Lake City, Utah           121           83           24           9            3            2           18
Tucson, Ariz.                  136           99           25          10            2            -           11

PACIFIC                      1,598        1,131          300         104           39           23          131
Berkeley, Calif.                20           14            4           1            -            1            2
Fresno, Calif.                 141           96           29           8            5            3           18
Glendale, Calif.                18           12            4           -            1            1            1
Honolulu, Hawaii                81           61           14           4            1            1            5
Long Beach, Calif.              77           64            7           5            1            -           15
Los Angeles, Calif.            337          223           65          29           13            7           13
Pasadena, Calif.                24           18            6           -            -            -            3
Portland, Oreg.                194          129           51           8            4            2           15
Sacramento, Calif.               U            U            U           U            U            U            U
San Diego, Calif.              183          131           29          10            6            7           14
San Francisco, Calif.            U            U            U           U            U            U            U
San Jose, Calif.               162          112           33          13            4            -           13
Santa Cruz, Calif.              33           30            1           2            -            -            5
Seattle, Wash.                 150          101           30          14            4            1           14
Spokane, Wash.                  61           47            7           7            -            -            9
Tacoma, Wash.                  117           93           20           3            -            -            4

TOTAL                   11,686****        8,076        2,272         819          276          240          827

---------------------------------------------------------------------------------------------------------------
U: Unavailable    -: no reported cases

   * Mortality data in this table are voluntarily reported from 122 cities in the United States, most of which have populations
     of 100,000 or more. A death is reported by the place of its occurrence and by the week that the death certificate was
     filed. Fetal deaths are not included.
  ** Pneumonia and influenza.
 *** Because of changes in reporting methods in this Pennsylvania city, these numbers are partial counts for the current
     week. Complete counts will be available in 4 to 6 weeks.
**** Total includes unknown ages.
===================================================================================================================================


Return to top.

Disclaimer   All MMWR HTML versions of articles are electronic conversions from ASCII text into HTML. This conversion may have resulted in character translation or format errors in the HTML version. Users should not rely on this HTML document, but are referred to the electronic PDF version and/or the original MMWR paper copy for the official text, figures, and tables. An original paper copy of this issue can be obtained from the Superintendent of Documents, U.S. Government Printing Office (GPO), Washington, DC 20402-9371; telephone: (202) 512-1800. Contact GPO for current prices.

**Questions or messages regarding errors in formatting should be addressed to mmwrq@cdc.gov.

Page converted: 12/16/99

HOME  |  ABOUT MMWR  |  MMWR SEARCH  |  DOWNLOADS  |  RSSCONTACT
POLICY  |  DISCLAIMER  |  ACCESSIBILITY

Safer, Healthier People

Morbidity and Mortality Weekly Report
Centers for Disease Control and Prevention
1600 Clifton Rd, MailStop E-90, Atlanta, GA 30333, U.S.A

USA.GovDHHS

Department of Health
and Human Services

This page last reviewed 5/2/01