Skip Navigation LinksSkip Navigation Links
Centers for Disease Control and Prevention
Safer Healthier People
Blue White
Blue White
bottom curve
CDC Home Search Health Topics A-Z spacer spacer
spacer
Blue curve MMWR spacer
spacer
spacer

Notifiable Diseases/Deaths in Selected Cities Weekly Information

Figure I   Selected notifiable disease reports, comparison of provisional 4-week totals ending November 20, 1999, with historical data -- United States

Table I   Summary -- provisional cases of selected notifiable diseases, United States, cumulative, week ending November 20, 1999 (46th Week)

Table II   Provisional cases of selected notifiable diseases, United States, weeks ending November 20, 1999 and November 21, 1998 (46th Week)

Table III   Provisional cases of selected notifiable diseases preventable by vaccination, United States, weeks ending November 20, 1999 and November 21, 1998 (46th Week)

Table IV   Deaths in 122 U.S. cities, week ending November 20, 1999 (46th Week)


Figure I

Figure I
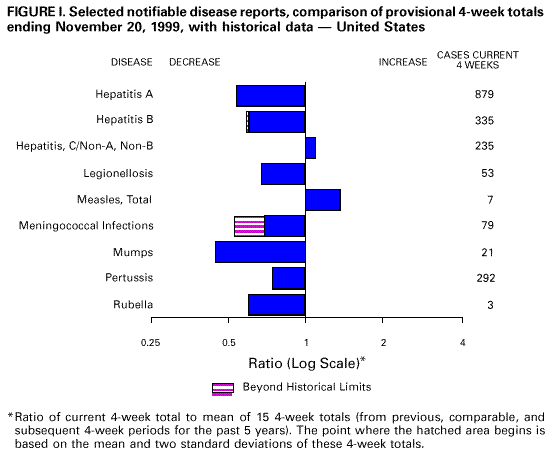
Return to top.

Table I
Note: To print large tables and graphs users may have to change their printer settings to landscape and use a small font size.
TABLE I. Summary -- provisional cases of selected notifiable diseases, United
States, cumulative, week ending November 20, 1999 (46th Week)
==================================================================================
                                             Cum. 1999
------------------------------------------------------
Anthrax                                              -
Brucellosis*                                        45
Cholera                                              3
Congenital rubella syndrome                          6
Cyclosporiasis*                                     49
Diphtheria                                           2
Encephalitis:  California*                          54
               eastern equine*                       6
               St. Louis*                            6
               western equine*                       1
Ehrlichiosis   human granulocytic (HGE)*           133
               human monocytic (HME)*               37
Hansen Disease*                                     90
Hantavirus pulmonary syndrome*+                     18
Hemolytic uremic syndrome, post-diarrheal*          93
HIV infection, pediatric*&                         121
Plague                                               8
Poliomyelitis, paralytic                             -
Psittacosis*                                        15
Rabies, human                                        -
Rocky Mountain spotted fever (RMSF)                476
Streptococcal disease, invasive Group A          1,838
Streptococcal toxic-shock syndrome*                 30
Syphilis, congenital@                              204
Tetanus                                             30
Toxic-shock syndrome                               101
Trichinosis                                          8
Typhoid fever                                      276
Yellow fever                                         1
------------------------------------------------------
-: no reported cases
 * Not notifiable in all states
 + Updated weekly from reports to the Division of Viral and Rickettsial
   Diseases, National Center for Infectious Diseases (NCID).
 & Updated monthly from reports to the Division of HIV/AIDS Prevention --
   Surveillance and Epidemiology, National Center for HIV, STD, and TB
   Prevention (NCHSTP), last update October 24, 1999.
 @ Updated from reports to the Division of STD Prevention, NCHSTP.

==================================================================================


Return to top.

Table II
Note: To print large tables and graphs users may have to change their printer settings to landscape and use a small font size.
TABLE II. (page 1) Provisional cases of selected notifiable diseases, United States, weeks ending
November 20, 1999, and November 21, 1998 (46th Week)

                                                                                                    Escherichia
                                                                                                   coli O157:H7*
                                                                                     -----------------------------------------
                          AIDS              Chlamydia          Cryptosporidiosis            NETSS                  PHLIS
                   -----------------   --------------------   -------------------    -------------------      ----------------
                     Cum.       Cum.        Cum.       Cum.       Cum.       Cum.        Cum.       Cum.       Cum.       Cum.
Reporting Area       1999**     1998        1999       1998       1999       1999        1999       1998       1999       1998
------------------------------------------------------------------------------------------------------------------------------
UNITED STATES      37,420     40,205     517,388    524,226      2,138      3,434       3,052      2,687      2,098      2,046

NEW ENGLAND         1,904      1,602      17,713     17,832        134        143         293        306        323        260
Maine                  68         26         904        950         27         29          36         35          -          -
N.H.                   38         25         845        864         17         15          31         43         31         44
Vt.                    15         18         417        375         35         26          32         19         20         17
Mass.               1,231        843       8,166      7,417         49         66         166        139        175        148
R.I.                   90        118       2,075      2,021          6          7          28         12         26          1
Conn.                 462        572       5,306      6,205          -          -           U         58         71         50

MID. ATLANTIC       9,663     10,597      53,094     54,848        396        529         286        277         78         84
Upstate N.Y.        1,146      1,311           N          N        157        314         226        199          -          -
N.Y. City           5,100      5,853      21,963     23,302        116        191          10         12         17         12
N.J.                1,741      1,930       9,152     10,499         36         24          50         66         32         51
Pa.                 1,676      1,503      21,979     21,047         87          N           N          N         29         21

E.N. CENTRAL        2,519      2,806      71,473     88,033        536        689         654        415        454        344
Ohio                  403        568      21,000     24,027         60         70         228        111        181         69
Ind.                  285        447       9,913      9,864         38         52          99         93         59         49
Ill.                1,201      1,038      22,015     23,799         67         81         216        108         81         76
Mich.                 504        577      18,545     17,936         45         37         111        103         73         64
Wis.                  126        176           U     12,407        326        449           N          N         60         86

W.N. CENTRAL          846        769      31,605     31,228        200        313         573        450        386        384
Minn.                 161        147       6,045      6,282         77        130         223        188        168        201
Iowa                   72         62       4,214      4,058         54         63         112         91         73         58
Mo.                   408        365      12,030     11,048         29         25          60         47         58         61
N. Dak.                 6          5         707        935         18         30          16         11         14         15
S. Dak.                13         15       1,338      1,381          7         24          44         32         59         36
Nebr.                  61         60       3,045      2,596         14         35          97         48          -          -
Kans.                 125        115       4,226      4,928          1          6          21         33         14         13

S. ATLANTIC        10,275     10,643     112,358    101,355        345        323         312        234        155        165
Del.                  147        122       2,400      2,291          -          3           6          -          3          2
Md.                 1,242      1,479      10,333      6,560         18         18          41         40          4         14
D.C.                  496        750           N          N          8         25           1          1          U          U
Va.                   689        882      12,624     12,023         26         20          69          N         55         51
W. Va.                 61         70       1,204      2,160          3          2          11         12          8         10
N.C.                  688        753      19,221     19,847         23          N          66         54         51         47
S.C.                  847        684      10,513     14,761          -          -          20         15         14         12
Ga.                 1,466      1,063      29,738     21,598        123        115          32         73          -          -
Fla.                4,639      4,840      26,325     22,115        144        140          66         39         20         29

E.S. CENTRAL        1,666      1,680      39,822     36,270         27         24         117        114         58         64
Ky.                   236        262       6,633      5,705          6         10          46         34          -          -
Tenn.                 643        620      12,221     12,097          6          8          43         51         38         40
Ala.                  423        455      11,157      9,060         11          N          23         23         16         20
Miss.                 364        343       9,811      9,408          4          6           5          6          4          4

W.S. CENTRAL        3,822      5,088      72,032     79,738         82        899         125         97        118         99
Ark.                  158        189       5,307      3,536          2          6          15         11          8         10
La.                   742        835      11,220     13,470         22         15           9          5         14          7
Okla.                 113        274       7,269      8,518         10          N          28         23         24          8
Tex.                2,809      3,790      48,236     54,214         48        878          73         58         72         74

MOUNTAIN            1,469      1,411      27,329     29,196         90        120         306        351        195        243
Mont.                  11         28       1,393      1,204         10         10          24         15          -          5
Idaho                  21         28       1,517      1,809          8         17          63         38         20         25
Wyo.                   10          3         670        625          1          2          15         53         14         55
Colo.                 271        286       5,180      7,026         12         18         108         85         87         67
N. Mex.                78        188       3,308      3,280         39         46          12         19          5         20
Ariz.                 745        550      10,769     10,325         12         18          30         43         20         26
Utah                  129        114       1,910      1,927          N          N          38         74         47         21
Nev.                  204        214       2,582      3,000          8          9          16         24          2         24

PACIFIC             5,256      5,609      91,962     85,726        328        394         386        443        331        403
Wash.                 305        369      10,702      9,740          N          N         147        102        158        127
Oreg.                 185        146       5,204      5,034         88         65          73        102         68         98
Calif.              4,673      4,918      71,906     67,000        240        326         155        232         94        162
Alaska                 13         17       1,611      1,670          -          -           1          7          1          -
Hawaii                 80        159       2,539      2,282          -          3          10          -         10         16

Guam                    5          1         302        377          -          -           N          N          U          U
P.R.                1,094      1,585           U          U          -          N           5          5          U          U
V.I.                   36         31           U          U          U          U           U          U          U          U
Amer. Samoa             -          -           U          U          U          U           U          U          U          U
C.N.M.I.                -          -           U          U          U          U           U          U          U          U
------------------------------------------------------------------------------------------------------------------------------
N: Not notifiable    U: Unavailable    -: no reported cases    C.N.M.I.: Commonwealth of North Mariana Islands

 * Individual cases may be reported through both the National Electronic Telecommunications System for Surveillance (NETSS)
   and the Public Health Laboratory Information System (PHLIS).
** Updated monthly from reports to the Division of HIV/AIDS Prevention -- Surveillance and Epidemiology, National Center for HIV,
   STD, and TB Prevention, last update October 24, 1999.

=======================================================================================================================================================

TABLE II. (page 2) Provisional cases of selected notifiable diseases, United States, weeks ending
November 20, 1999, and November 21, 1998 (46th Week)

                                            Hepatitis                                       Lyme
                       Gonorrhea             C/NA,NB             Legionellosis             Disease
                   -----------------   --------------------   -------------------    -------------------
                     Cum.       Cum.        Cum.       Cum.       Cum.       Cum.        Cum.       Cum.
Reporting Area       1999       1998        1999       1998       1999       1998        1999       1998
--------------------------------------------------------------------------------------------------------
UNITED STATES     284,215    312,812       2,911      2,981        810      1,168      11,395     14,560

NEW ENGLAND         5,397      5,333          12         57         73         79       3,124      4,427
Maine                  71         61           2          -          3          1          41         76
N.H.                   94         82           -          -          8          7          21         42
Vt.                    42         34           6          5         14          7          23         11
Mass.               2,259      2,005           1         49         28         32         890        678
R.I.                  522        359           3          3          9         19         464        598
Conn.               2,409      2,792           -          -         11         13       1,685      3,022

MID. ATLANTIC      34,035     34,089         118        197        175        296       6,578      8,085
Upstate N.Y.        6,031      6,480          83        100         57        104       3,512      3,767
N.Y. City          11,762     10,511           -          -          9         34          32        225
N.J.                5,508      7,107           -          U         18         15         922      1,761
Pa.                10,734      9,991          35         97         91        143       2,112      2,332

E.N. CENTRAL       47,774     60,874       1,379        619        220        385         118        739
Ohio               12,752     15,731           3          8         65        121          70         44
Ind.                5,386      5,820           1          5         38         70          19         36
Ill.               16,618     19,732          41         38         22         50          12         14
Mich.              13,018     13,945         743        430         59         79           1         12
Wis.                    U      5,646         591        138         36         65          16        633

W.N. CENTRAL       13,657     15,585         286         39         43         60         246        203
Minn.               2,332      2,415          10         10          9          6         179        152
Iowa                1,053      1,362           -          8         11          9          19         26
Mo.                 6,930      8,115         264         13         14         16          25         11
N. Dak.                71         75           1          -          2          -           1          -
S. Dak.               160        203           -          -          3          3           -          -
Nebr.               1,285      1,099           5          5          4         18          10          3
Kans.               1,826      2,316           6          3          -          8          12         11

S. ATLANTIC        84,640     84,121         188        104        127        133       1,047        826
Del.                1,476      1,350           1          -         13         12          51         65
Md.                 8,853      8,561          39         18         29         34         743        583
D.C.                3,166      3,829           1          -          3          7           4          4
Va.                 8,527      8,335          10         11         30         19         112         65
W. Va.                363        784          17          6          N          N          16         12
N.C.               17,041     17,088          34         21         14         14          67         54
S.C.                6,181      9,335          22          9         11         10           7          7
Ga.                20,377     17,806           1          9          1          8           -          5
Fla.               18,656     17,033          63         30         26         29          47         31

E.S. CENTRAL       31,788     35,050         226        260         37         60          71        101
Ky.                 3,005      3,315          21         20         19         26           9         25
Tenn.               9,901     10,583          79        153         14         21          30         41
Ala.                9,925     11,591           1          4          4          6          19         21
Miss.               8,957      9,561         125         83          -          7          13         14

W.S. CENTRAL       40,315     49,144         313        506         23         30          43         21
Ark.                2,824      3,525          18         21          -          1           4          6
La.                 8,880     11,564         102        101          2          4           -          4
Okla.               3,585      4,718          14         14          3         12           4          2
Tex.               25,026     29,337         179        370         18         13          35          9

MOUNTAIN            8,141      8,117         132        355         42         67          18         17
Mont.                  48         43           5          7          -          2           -          -
Idaho                  77        152           7         86          2          2           5          5
Wyo.                   28         29          37         89          -          1           3          1
Colo.               2,159      1,854          21         31         11         16           -          -
N. Mex.               664        795           8         91          1          2           1          4
Ariz.               3,888      3,749          40         11          6         17           2          1
Utah                  200        204           6         21         16         21           5          -
Nev.                1,077      1,291           8         19          6          6           2          6

PACIFIC            18,468     20,499         257        844         70         58         150        141
Wash.               1,874      1,742          18         22         13         12          10          7
Oreg.                 759        732          17         18          N          N          12         20
Calif.             15,210     17,288         222        750         56         44         128        113
Alaska                260        280           -          -          1          1           -          1
Hawaii                365        457           -         54          -          1           N          N

Guam                   39         63           1          1          -          2           -          1
P.R.                  297        340           -          -          -          -           N          N
V.I.                    U          U           U          U          U          U           U          U
Amer. Samoa             U          U           U          U          U          U           U          U
C.N.M.I.                U          U           U          U          U          U           U          U

--------------------------------------------------------------------------------------------------------
N: Not notifiable    U: Unavailable    -: no reported cases
=======================================================================================================================================================

TABLE II. (page 3) Provisional cases of selected notifiable diseases, United States, weeks ending
November 20, 1999, and November 21, 1998 (46th Week)

                                                                            Salmonellosis*
                                                              ------------------------------------------
                        Malaria           Rabies, Animal             NETSS                  PHLIS
                   -----------------   --------------------   -------------------    -------------------
                     Cum.       Cum.        Cum.       Cum.       Cum.       Cum.        Cum.       Cum.
Reporting Area       1999       1998        1999       1998       1999       1998        1999       1998
--------------------------------------------------------------------------------------------------------
UNITED STATES       1,170      1,322       5,364      6,621     33,317     37,950      25,669     30,850

NEW ENGLAND            59         64         803      1,324      1,504      2,298       1,867      2,112
Maine                   3          5         160        215        124        153          95         61
N.H.                    2          5          50         74        124        174         131        208
Vt.                     4          1          86         61         87        129          76        103
Mass.                  22         25         194        468      1,047      1,211       1,025      1,245
R.I.                    4         10          89         88        122        132         147         34
Conn.                  24         18         224        418          U        499         393        461

MID. ATLANTIC         280        386       1,033      1,449      4,080      6,035       3,545      5,367
Upstate N.Y.           68         85         743      1,007      1,224      1,476       1,127      1,271
N.Y. City             126        217           U          U      1,219      1,743         927      1,369
N.J.                   48         53         160        202        665      1,338         535      1,260
Pa.                    38         31         130        240        972      1,478         956      1,467

E.N. CENTRAL          135        139         143        120      4,808      5,708       3,102      4,383
Ohio                   18         15          34         55      1,189      1,395         953      1,042
Ind.                   18         10          13         11        479        597         376        481
Ill.                   54         56          10          N      1,485      1,745         399      1,416
Mich.                  37         46          83         35        858      1,054         856        975
Wis.                    8         12           3         19        797        917         518        469

W.N. CENTRAL           72         86         645        652      2,026      2,102       2,080      2,144
Minn.                  41         52         101        107        574        522         625        611
Iowa                   13          7         147        139        242        344         197        269
Mo.                    14         14          14         38        678        566         817        775
N. Dak.                 -          2         130        129         43         59          49         67
S. Dak.                 -          -         163        149         89        108         108        118
Nebr.                   -          1           3          7        181        170          78         44
Kans.                   4         10          87         83        219        333         206        260

S. ATLANTIC           313        283       1,912      2,168      7,950      7,786       4,791      5,615
Del.                    1          3          37         47        129         72         144        110
Md.                    86         83         367        417        807        845         891        823
D.C.                   17         18           -          -         67         73           U          U
Va.                    67         52         523        515      1,161      1,012         905        802
W. Va.                  2          2          99         70        147        143         142        147
N.C.                   26         27         376        523      1,186      1,154       1,211      1,310
S.C.                   17          6         132        136        639        586         454        500
Ga.                    22         35         204        274      1,376      1,528         651      1,398
Fla.                   75         57         174        186      2,438      2,373         393        525

E.S. CENTRAL           21         32         238        253      1,719      2,119         938      1,450
Ky.                     7          7          35         30        374        333           -        124
Tenn.                   6         16          82        129        317        544         487        643
Ala.                    7          6         120         92        544        635         374        533
Miss.                   1          3           1          2        484        607          77        150

W.S. CENTRAL           16         34          89         28      3,549      4,341       2,880      2,939
Ark.                    3          1          14         28        597        567         120        340
La.                    10         14           -          -        334        653         472        741
Okla.                   2          3          75          N        386        445         291        211
Tex.                    1         16           -          -      2,232      2,676       1,997      1,647

MOUNTAIN               41         60         178        242      2,767      2,297       2,254      1,839
Mont.                   4          1          55         51         70         74           1         43
Idaho                   3          8           -          N        112        113          81         90
Wyo.                    1          -          42         63         65         59          49         55
Colo.                  16         18           1         42        649        492         657        463
N. Mex.                 2         12           9          6        354        272         217        240
Ariz.                   8          8          58         48        858        742         709        623
Utah                    4          1           8         26        486        326         487        122
Nev.                    3         12           5          6        173        219          53        203

PACIFIC               233        238         323        385      4,914      5,264       4,212      5,001
Wash.                  25         17           -          -        593        462         777        614
Oreg.                  19         15           2          7        389        278         455        301
Calif.                177        199         314        355      3,572      4,211       2,707      3,778
Alaska                  1          2           7         23         51         53          15         32
Hawaii                 11          5           -          -        309        260         258        276

Guam                    -          2           -          -         24         36           U          U
P.R.                    -          -          64         47        255        725           U          U
V.I.                    U          U           U          U          U          U           U          U
Amer. Samoa             U          U           U          U          U          U           U          U
C.N.M.I.                U          U           U          U          U          U           U          U

--------------------------------------------------------------------------------------------------------
N: Not notifiable    U: Unavailable    -: no reported cases

* Individual cases may be reported through both the National Electronic Telecommunications System for Surveillance (NETSS)
  and the Public Health Laboratory Information System (PHLIS).
=======================================================================================================================================================

TABLE II. (page 4) Provisional cases of selected notifiable diseases, United States, weeks ending
November 20, 1999, and November 21, 1998 (46th Week)

                                  Shigellosis*
                    ---------------------------------------          Syphilis
                         NETSS                  PHLIS          (Primary & Secondary)      Tuberculosis
                    ----------------       ----------------    ---------------------    ------------------
                     Cum.       Cum.        Cum.       Cum.       Cum.       Cum.        Cum.       Cum.
Reporting Area       1999       1998        1999       1998       1999       1998        1999**     1998**
----------------------------------------------------------------------------------------------------------
UNITED STATES      14,049     19,564       6,500     11,104      5,782      6,358      12,183     14,937

NEW ENGLAND           714        388         710        340         51         69         367        390
Maine                   5         12           -          -          -          1          16         11
N.H.                   16         16          14         19          1          2          10          -
Vt.                     6          6           4          2          3          4           2          4
Mass.                 664        253         621        244         32         40         209        223
R.I.                   23         34          18         13          2          1          39         49
Conn.                   U         67          53         62         13         21          91        103

MID. ATLANTIC         839      2,188         415      1,611        222        287       2,262      2,706
Upstate N.Y.          254        570          62        201         25         35         280        338
N.Y. City             258        663          82        568         79         72       1,220      1,280
N.J.                  195        619         121        593         48         91         451        546
Pa.                   132        336         150        249         70         89         311        542

E.N. CENTRAL        2,533      2,653       1,159      1,426      1,240        916       1,136      1,463
Ohio                  379        459         124        129         84        128         214        214
Ind.                  293        150          94         39        613        184          83        141
Ill.                  993      1,456         592      1,187        335        370         508        685
Mich.                 388        242         280          4        208        176         246        328
Wis.                  480        346          69         67          U         58          85         95

W.N. CENTRAL        1,030        965         668        576        108        122         427        427
Minn.                 222        287         212        321          9          9         178        131
Iowa                   57         63          48         44          9          2          40         43
Mo.                   633        151         327        113         72         91         151        155
N. Dak.                 3          9           2          3          -          -           6          8
S. Dak.                13         31           6         22          -          1          17         17
Nebr.                  65        358          35         19          8          6          16         26
Kans.                  37         66          38         54         10         13          19         47

S. ATLANTIC         2,201      3,878         406      1,185      1,803      2,356       2,487      2,772
Del.                   12         35           8         33          8         20          12         33
Md.                   147        193          50         64        307        617         241        270
D.C.                   50         30           U          U         59         84          45         97
Va.                   122        183          51         81        142        137         247        250
W. Va.                  8         11           5          7          2          3          35         38
N.C.                  189        299          80        169        400        664         348        398
S.C.                  120        167          60         88        235        305         218        250
Ga.                   212      1,005          37        233        368        263         532        459
Fla.                1,341      1,955         115        510        282        263         809        977

E.S. CENTRAL          954      1,239         456        979      1,011      1,091         768      1,041
Ky.                   225        126           -         45         94         94         166        148
Tenn.                 508        627         399        716        561        513         272        364
Ala.                  108        433          47        211        196        257         274        330
Miss.                 113         53          10          7        160        227          56        199

W.S. CENTRAL        2,429      3,985       1,849      1,279        837        960       1,265      2,208
Ark.                   73        198          23         60         76        104         147        136
La.                   118        315         111        272        208        384           U        256
Okla.                 448        491         149        152        164         81         120        149
Tex.                1,790      2,981       1,566        795        389        391         998      1,667

MOUNTAIN            1,038      1,176         636        677        205        217         384        493
Mont.                   9          8           -          3          1          -          13         18
Idaho                  25         19           9         14          1          2          14         10
Wyo.                    3          3           1          1          -          1           3          4
Colo.                 180        207         137        152          2         10           U         60
N. Mex.               128        276          62        159         11         22          54         62
Ariz.                 551        563         360        301        182        163         184        189
Utah                   61         39          61         28          2          4          38         47
Nev.                   81         61           6         19          6         15          78        103

PACIFIC             2,311      3,092         201      3,031        305        340       3,087      3,437
Wash.                 102        201          98        171         64         27         156        231
Oreg.                  80        176          76        146          9          5          90        123
Calif.              2,097      2,660           -      2,660        228        304       2,630      2,881
Alaska                  3          9           2          5          1          1          51         47
Hawaii                 29         46          25         49          3          3         160        155

Guam                    8         34           U          U          1          1          11         82
P.R.                   62         57           U          U        143        162          41        140
V.I.                    U          U           U          U          U          U           U          U
Amer. Samoa             U          U           U          U          U          U           U          U
C.N.M.I.                U          U           U          U          U          U           U          U

----------------------------------------------------------------------------------------------------------
N: Not notifiable    U: Unavailable    -: no reported cases

 * Individual cases may be reported through both the National Electronic Telecommunications System for Surveillance (NETSS)
   and the Public Health Laboratory Information System (PHLIS).
** Cumulative reports of provisional tuberculosis cases for 1998 and 1999 are unavailable ('U') for some
   areas using the Tuberculosis Information Management System (TIMS).

=======================================================================================================================================================


Return to top.

Table III
Note: To print large tables and graphs users may have to change their printer settings to landscape and use a small font size.
TABLE III. (page 1) Provisional cases of selected notifiable diseases preventable by vaccination, United
States, weeks ending November 20, 1999, and November 21, 1998 (46th Week)

                                                Hepatitis (Viral), by type                                    Measles (Rubeola)
                     H. influenzae,       ---------------------------------------        ------------------------------------------------------------
                        invasive                  A                     B                  Indigenous            Imported*                 Total
                    ----------------      -----------------     -----------------        ---------------       ---------------        ---------------
                     Cum.       Cum.        Cum.       Cum.       Cum.       Cum.                   Cum.                  Cum.        Cum.       Cum.
Reporting Area       1999**     1998        1999       1998       1999       1998        1999       1999       1999       1999        1999       1998
-----------------------------------------------------------------------------------------------------------------------------------------------------
UNITED STATES       1,000        956      15,088     19,930      5,592      8,530           -         58          -         24          82         88

NEW ENGLAND            88         64         263        261         93        196           -          6          -          5          11          3
Maine                   7          3          12         19          1          4           -          -          -          -           -          -
N.H.                   20         10          18         14         15         18           -          -          -          1           1          -
Vt.                     5          8          19         15          3          8           -          -          -          -           -          1
Mass.                  34         37          90        114         38         71           -          5          -          3           8          2
R.I.                    5          5          21         16         34         66           -          -          -          -           -          -
Conn.                  17          1         103         83          2         29           -          1          -          1           2          -

MID. ATLANTIC         159        156         871      1,534        538      1,104           -          -          -          2           2         14
Upstate N.Y.           76         55         244        321        166        221           -          -          -          2           2          2
N.Y. City              37         40         270        538        175        386           -          -          -          -           -          -
N.J.                   45         51         112        319         41        186           U          -          U          -           -          8
Pa.                     1         10         245        356        156        311           U          -          U          -           -          4

E.N. CENTRAL          152        164       2,523      3,207        571      1,280           -          1          -          2           3         15
Ohio                   51         46         599        278         84         72           -          -          -          -           -          1
Ind.                   22         40         100        144         36        103           -          1          -          1           2          3
Ill.                   65         59         643        720          1        214           -          -          -          -           -          -
Mich.                  13         12       1,123      1,888        431        413           U          -          U          1           1         10
Wis.                    1          7          58        177         19        478           U          -          U          -           -          1

W.N. CENTRAL           83         84         843      1,244        332        368           -          1          -          -           1          -
Minn.                  43         65          93        118         50         45           -          1          -          -           1          -
Iowa                    9          2         127        392         35         52           -          -          -          -           -          -
Mo.                    22         10         521        579        203        220           -          -          -          -           -          -
N. Dak.                 1          -           3          3          2          4           U          -          U          -           -          -
S. Dak.                 1          -           9         31          1          2           U          -          U          -           -          -
Nebr.                   3          1          50         25         14         20           -          -          -          -           -          -
Kans.                   4          6          40         96         27         25           U          -          U          -           -          -

S. ATLANTIC           216        169       1,816      1,808      1,094        927           -         14          -          6          20          8
Del.                    -          -           2          3          1          3           U          -          U          -           -          1
Md.                    55         50         319        371        151        124           -          -          -          -           -          1
D.C.                    4          -          54         56         23         11           U          -          U          -           -          -
Va.                    18         16         164        190         86         90           -         14          -          4          18          2
W. Va.                  6          6          34          7         22          8           U          -          U          -           -          -
N.C.                   31         23         145        115        208        212           U          -          U          -           -          -
S.C.                    5          3          44         37         65         41           -          -          -          -           -          -
Ga.                    55         43         439        580        159        127           -          -          -          -           -          2
Fla.                   42         28         615        449        379        311           U          -          U          2           2          2

E.S. CENTRAL           51         56         353        374        366        460           -          2          -          -           2          2
Ky.                     6          7          61         30         42         46           -          2          -          -           2          -
Tenn.                  27         32         142        205        165        252           -          -          -          -           -          1
Ala.                   15         14          54         72         77         68           -          -          -          -           -          1
Miss.                   3          3          96         67         82         94           -          -          -          -           -          -

W.S. CENTRAL           45         51       3,579      3,663        779      1,878           -          9          -          4          13          -
Ark.                    2          -          58         78         64         99           -          4          -          -           4          -
La.                     7         21          73         98         77        152           U          -          U          -           -          -
Okla.                  32         27         412        539        110         92           -          -          -          -           -          -
Tex.                    4          3       3,036      2,948        528      1,535           -          5          -          4           9          -

MOUNTAIN              101        106       1,160      2,864        512        733           -          3          -          -           3          4
Mont.                   3          -          17         91         17          5           U          -          U          -           -          -
Idaho                   1          1          40        226         27         40           -          -          -          -           -          -
Wyo.                    1          1           7         36         13          9           -          -          -          -           -          -
Colo.                  11         21         201        301         87         98           -          -          -          -           -          -
N. Mex.                18          6          47        137        156        284           -          -          -          -           -          -
Ariz.                  54         54         670      1,692        132        160           U          1          U          -           1          4
Utah                   10          4          56        176         34         65           -          2          -          -           2          -
Nev.                    3         19         122        205         46         72           U          -          U          -           -          -

PACIFIC               105        106       3,680      4,975      1,307      1,584           -         22          -          5          27         42
Wash.                   6          9         299        906         63        100           -          -          -          -           -          1
Oreg.                  39         38         221        405         81        177           U          9          U          -           9          -
Calif.                 46         47       3,135      3,595      1,136      1,279           -         13          -          4          17          8
Alaska                  6          4          10         17         14         13           U          -          U          -           -         33
Hawaii                  8          8          15         52         13         15           -          -          -          1           1          -

Guam                    -          -           2          1          2          2           U          1          U          -           1          -
P.R.                    1          2         112         67        102        225           U          -          U          -           -          -
V.I.                    U          U           U          U          U          U           U          U          U          U           U          U
Amer. Samoa             U          U           U          U          U          U           U          U          U          U           U          U
C.N.M.I.                U          U           U          U          U          U           U          U          U          U           U          U
-----------------------------------------------------------------------------------------------------------------------------------------------------
N: Not notifiable    U: Unavailable     -: no reported cases

 * For imported measles, cases include only those resulting from importation from other countries.
** Of 192 cases among children aged <5 years, serotype was reported for 98 and of those, 27 were type b.
=======================================================================================================================================================

TABLE III. (page 2) Provisional cases of selected notifiable diseases preventable by vaccination, United
States, weeks ending November 20, 1999, and November 21, 1998 (46th Week)

                     Meningococcal
                        Disease                      Mumps                           Pertussis                          Rubella
                   -----------------        --------------------------       ---------------------------       ---------------------------
                     Cum.       Cum.                   Cum.       Cum.                   Cum.       Cum.                  Cum.        Cum.
Reporting Area       1999       1998        1999       1999       1998       1999        1999       1998       1999       1999        1998
------------------------------------------------------------------------------------------------------------------------------------------
UNITED STATES       2,073      2,348           3        308        590         89       5,031      5,996          2        230         348

NEW ENGLAND           102        107           -          8          8          7         606        935          -          7          38
Maine                   5          6           -          -          -          -           -          5          -          -           -
N.H.                   13         11           -          1          -          -          78        109          -          -           -
Vt.                     5          5           -          1          -          4          67         71          -          -           -
Mass.                  58         52           -          4          5          3         400        698          -          7           8
R.I.                    6          8           -          2          1          -          33          9          -          -           1
Conn.                  15         25           -          -          2          -          28         43          -          -          29

MID. ATLANTIC         195        255           2         32        185         24         840        574          2         24         147
Upstate N.Y.           62         72           2         12          7         24         669        300          2         20         114
N.Y. City              49         31           -          3        155          -          10         41          -          -          19
N.J.                   45         55           U          -          6          U          12         25          U          1          13
Pa.                    39         97           U         17         17          U         149        208          U          3           1

E.N. CENTRAL          355        358           -         39         76          3         429        771          -          2           -
Ohio                  124        127           -         17         27          -         188        261          -          -           -
Ind.                   61         66           -          4          7          3          71        159          -          1           -
Ill.                   96         92           -         11         10          -          68        115          -          1           -
Mich.                  42         42           U          7         29          U          54         66          U          -           -
Wis.                   32         31           U          -          3          U          48        170          U          -           -

W.N. CENTRAL          226        202           -         13         32          1         366        538          -        124          39
Minn.                  49         31           -          1         13          -         188        306          -          5           -
Iowa                   41         39           -          7         11          -          54         68          -         29           -
Mo.                    91         71           -          1          3          1          61         35          -          3           2
N. Dak.                 4          5           U          1          2          U          18          4          U          -           -
S. Dak.                11          7           U          -          -          U           6          8          U          -           -
Nebr.                  12         16           -          -          -          -           4         16          -         87           -
Kans.                  18         33           U          3          3          U          35        101          U          -          37

S. ATLANTIC           373        403           -         49         47         25         392        307          -         36          19
Del.                    8          2           U          -          -          U           5          5          U          -           -
Md.                    51         30           -          7          -          3         106         61          -          1           1
D.C.                    1          1           U          2          -          U           -          1          U          -           -
Va.                    50         40           -         10          8         20          50         36          -          -           1
W. Va.                  7         17           U          -          -          U           3          2          U          -           -
N.C.                   41         55           U          8         11          U          86         98          U         35          13
S.C.                   43         53           -          4          7          -          17         27          -          -           -
Ga.                    59         91           -          4          1          2          40         27          -          -           -
Fla.                  113        114           U         14         20          U          85         50          U          -           4

E.S. CENTRAL          127        181           -         13         15          -          72        131          -          1           2
Ky.                    30         34           -          -          -          -          21         64          -          -           -
Tenn.                  43         63           -          -          1          -          27         35          -          -           2
Ala.                   32         49           -         10          8          -          21         26          -          1           -
Miss.                  22         35           -          3          6          -           3          6          -          -           -

W.S. CENTRAL          167        274           -         33         56          -         157        348          -         15          88
Ark.                   32         28           -          -         12          -          18         81          -          6           -
La.                    34         53           U          3          7          U           3          9          U          -           -
Okla.                  27         39           -          1          -          -          12         32          -          -           -
Tex.                   74        154           -         29         37          -         124        226          -          9          88

MOUNTAIN              128        133           1         28         37         23         673      1,065          -         16           5
Mont.                   4          4           U          -          -          U           2         12          U          -           -
Idaho                  10         11           1          3          5          2         139        216          -          -           -
Wyo.                    4          6           -          -          1          -           2          8          -          -           -
Colo.                  32         26           -          5          6          5         190        274          -          1           -
N. Mex.                14         25           N          N          N         16         175         94          -          -           1
Ariz.                  42         39           U          8          6          U         102        191          U         13           1
Utah                   15         13           -          7          5          -          56        229          -          1           2
Nev.                    7          9           U          5         14          U           7         41          U          1           1

PACIFIC               400        435           -         93        134          6       1,496      1,327          -          5          10
Wash.                  61         59           -          2         10          4         598        305          -          -           5
Oreg.                  71         76           N          N          N          U          55         85          U          -           -
Calif.                255        292           -         77         98          2         805        903          -          5           3
Alaska                  6          3           U          2          2          U           5         14          U          -           -
Hawaii                  7          5           -         12         24          -          33         20          -          -           2

Guam                    2          2           U          1          5          U           1          1          U          -           -
P.R.                    5         10           U          -          3          U          16          9          U          -          14
V.I.                    U          U           U          U          U          U           U          U          U          U           U
Amer. Samoa             U          U           U          U          U          U           U          U          U          U           U
C.N.M.I.                U          U           U          U          U          U           U          U          U          U           U

------------------------------------------------------------------------------------------------------------------------------------------
N: Not notifiable    U: Unavailable     -: no reported cases

=======================================================================================================================================================


Return to top.

Table IV
Note: To print large tables and graphs users may have to change their printer settings to landscape and use a small font size.
TABLE IV. Deaths in 122 U.S. cities,* week ending
November 20, 1999 (46th Week)
===================================================================================================================================
                                                 All Causes, By Age (Years)
                          ------------------------------------------------------------------------        P&I**
Reporting Area            All Ages         >=65        45-64       25-44         1-24           <1        Total
---------------------------------------------------------------------------------------------------------------
NEW ENGLAND                    386          287           71          20            4            4           37
Boston, Mass.                    U            U            U           U            U            U            U
Bridgeport, Conn.               44           36            7           -            1            -            4
Cambridge, Mass.                17           13            4           -            -            -            3
Fall River, Mass.               17           11            4           2            -            -            -
Hartford, Conn.                 59           41           11           4            1            2            2
Lowell, Mass.                   20           15            3           2            -            -            2
Lynn, Mass.                     15           11            4           -            -            -            6
New Bedford, Mass.              25           22            2           1            -            -            2
New Haven, Conn.                54           36           11           5            1            1            4
Providence, R.I.                61           45           12           2            1            1            5
Somerville, Mass.                5            2            2           1            -            -            2
Springfield, Mass.              43           36            6           1            -            -            5
Waterbury, Conn.                26           19            5           2            -            -            2
Worcester, Mass.                 U            U            U           U            U            U            U

MID. ATLANTIC                2,633        1,855          512         173           50           42          112
Albany, N.Y.                    61           47            9           3            -            2            3
Allentown, Pa.                   U            U            U           U            U            U            U
Buffalo, N.Y.                   81           56           14           7            4            -            1
Camden, N.J.                    32           17           11           1            1            2            2
Elizabeth, N.J.                 24           20            3           1            -            -            -
Erie, Pa.                       49           34           10           3            2            -            5
Jersey City, N.J.               31           23            5           3            -            -            -
New York City, N.Y.          1,420          995          289          95           23           17           36
Newark, N.J.                    48           21           15          11            1            -            6
Paterson, N.J.                  21           11            5           2            -            3            -
Philadelphia, Pa.              397          272           84          24           13            4           14
Pittsburgh, Pa.***              83           51           16           7            -            9            4
Reading, Pa.                    28           24            -           3            1            -            2
Rochester, N.Y.                153          122           22           6            3            -           20
Schenectady, N.Y.               22           19            1           2            -            -            -
Scranton, Pa.                   40           34            6           -            -            -            4
Syracuse, N.Y.                  99           77           17           1            1            3           12
Trenton, N.J.                   44           32            5           4            1            2            3
Utica, N.Y.                      U            U            U           U            U            U            U
Yonkers, N.Y.                    U            U            U           U            U            U            U

E.N. CENTRAL                 1,972        1,345          387         136           50           52          133
Akron, Ohio                     62           44           13           3            -            2            6
Canton, Ohio                    41           24           12           1            -            4            4
Chicago, Ill.                  386          232           80          30           13           29           30
Cincinnati, Ohio                 U            U            U           U            U            U            U
Cleveland, Ohio                137           90           35           8            2            2           11
Columbus, Ohio                 212          162           32          13            -            5            9
Dayton, Ohio                   127           93           20           9            3            2            5
Detroit, Mich.                 157           87           39          23            8            -           14
Evansville, Ind.                61           43           13           4            1            -            5
Fort Wayne, Ind.                78           62           12           4            -            -            8
Gary, Ind.                       U            U            U           U            U            U            U
Grand Rapids, Mich.             46           31           11           3            -            1            3
Indianapolis, Ind.             146           93           33          14            5            1            8
Lansing, Mich.                  39           25            8           4            2            -            3
Milwaukee, Wis.                156          114           27           7            6            2            9
Peoria, Ill.                    49           35            9           1            3            1            3
Rockford, Ill.                  46           32            7           2            5            -            4
South Bend, Ind.                49           36            7           3            -            3            2
Toledo, Ohio                   108           81           22           3            2            -            6
Youngstown, Ohio                72           61            7           4            -            -            3

W.N. CENTRAL                   680          495          107          41           16           21           54
Des Moines, Iowa                58           44           11           1            2            -           12
Duluth, Minn.                   40           29            7           2            1            1            1
Kansas City, Kans.              39           25            7           3            1            3            4
Kansas City, Mo.                85           59           11           7            4            4            4
Lincoln, Nebr.                  37           32            5           -            -            -            5
Minneapolis, Minn.             221          167           33          12            2            7           22
Omaha, Nebr.                    94           71           14           3            3            3            3
St. Louis, Mo.                   U            U            U           U            U            U            U
St. Paul, Minn.                  U            U            U           U            U            U            U
Wichita, Kans.                 106           68           19          13            3            3            3

S. ATLANTIC                    979          652          185          97           27           18           49
Atlanta, Ga.                     U            U            U           U            U            U            U
Baltimore, Md.                 147           81           36          23            6            1           13
Charlotte, N.C.                110           74           24           7            3            2            8
Jacksonville, Fla.             139           99           22          13            2            3            8
Miami, Fla.                      U            U            U           U            U            U            U
Norfolk, Va.                    47           35            4           5            -            3            2
Richmond, Va.                   63           39           14           7            2            1            4
Savannah, Ga.                   43           33            7           3            -            -            1
St. Petersburg, Fla.             U            U            U           U            U            U            U
Tampa, Fla.                    225          161           39          17            4            4            7
Washington, D.C.               194          121           37          22           10            4            6
Wilmington, Del.                11            9            2           -            -            -            -

E.S. CENTRAL                   900          604          190          61           17           26           80
Birmingham, Ala.               201          133           44          15            3            4           26
Chattanooga, Tenn.              76           52           13           6            2            3            6
Knoxville, Tenn.                63           41           15           5            1            1            5
Lexington, Ky.                  65           46           13           4            1            1            4
Memphis, Tenn.                 222          144           46          13            7           12           18
Mobile, Ala.                    65           50           13           2            -            -            5
Montgomery, Ala.                59           40           14           4            -            1            8
Nashville, Tenn.               149           98           32          12            3            4            8

W.S. CENTRAL                 1,168          794          221          84           36           33           62
Austin, Tex.                    83           58           15           4            2            4            5
Baton Rouge, La.                67           51           10           3            3            -            3
Corpus Christi, Tex.            49           34            9           2            1            3            -
Dallas, Tex.                   205          127           43          23           10            2            4
El Paso, Tex.                   80           49           16           2            6            7            1
Ft. Worth, Tex.                129           82           25          14            4            4           15
Houston, Tex.                    U            U            U           U            U            U            U
Little Rock, Ark.               76           52           10           9            2            3            3
New Orleans, La.                 U            U            U           U            U            U            U
San Antonio, Tex.              268          188           51          19            4            6           16
Shreveport, La.                 74           46           22           2            2            2            6
Tulsa, Okla.                   137          107           20           6            2            2            9

MOUNTAIN                     1,005          713          176          76           20           19           58
Albuquerque, N.M.              109           80           16          10            2            1           11
Boise, Idaho                    52           38           10           3            1            -            5
Colo. Springs, Colo.            74           51           11           7            2            3            6
Denver, Colo.                   95           73           11           7            -            4            5
Las Vegas, Nev.                202          145           39          16            1            1           12
Ogden, Utah                      U            U            U           U            U            U            U
Phoenix, Ariz.                 167          106           34          16            6            5            2
Pueblo, Colo.                   26           19            3           2            1            1            2
Salt Lake City, Utah           109           73           20           8            4            3           10
Tucson, Ariz.                  171          128           32           7            3            1            5

PACIFIC                      1,525        1,067          284         102           35           37          133
Berkeley, Calif.                13            8            3           -            -            2            -
Fresno, Calif.                 134           99           23           6            5            1           12
Glendale, Calif.                26           18            7           1            -            -            4
Honolulu, Hawaii                89           59           16           9            2            3            6
Long Beach, Calif.              63           42           11           6            3            1           13
Los Angeles, Calif.            333          235           59          22           10            7           20
Pasadena, Calif.                29           23            6           -            -            -            4
Portland, Oreg.                222          156           45          14            1            6           21
Sacramento, Calif.               U            U            U           U            U            U            U
San Diego, Calif.              169          114           27          16            7            5           17
San Francisco, Calif.            U            U            U           U            U            U            U
San Jose, Calif.               114           80           22           6            1            5            5
Santa Cruz, Calif.              30           23            5           2            -            -            -
Seattle, Wash.                 147           81           41          18            3            4           10
Spokane, Wash.                  40           34            4           -            -            2            8
Tacoma, Wash.                  116           95           15           2            3            1           13

TOTAL                   11,248****        7,812        2,133         790          255          252          718

---------------------------------------------------------------------------------------------------------------
U: Unavailable    -: no reported cases

   * Mortality data in this table are voluntarily reported from 122 cities in the United States, most of which have populations
     of 100,000 or more. A death is reported by the place of its occurrence and by the week that the death certificate was
     filed. Fetal deaths are not included.
  ** Pneumonia and influenza.
 *** Because of changes in reporting methods in this Pennsylvania city, these numbers are partial counts for the current
     week. Complete counts will be available in 4 to 6 weeks.
**** Total includes unknown ages.
===================================================================================================================================


Return to top.

Disclaimer   All MMWR HTML versions of articles are electronic conversions from ASCII text into HTML. This conversion may have resulted in character translation or format errors in the HTML version. Users should not rely on this HTML document, but are referred to the electronic PDF version and/or the original MMWR paper copy for the official text, figures, and tables. An original paper copy of this issue can be obtained from the Superintendent of Documents, U.S. Government Printing Office (GPO), Washington, DC 20402-9371; telephone: (202) 512-1800. Contact GPO for current prices.

**Questions or messages regarding errors in formatting should be addressed to mmwrq@cdc.gov.

Page converted: 11/24/99

HOME  |  ABOUT MMWR  |  MMWR SEARCH  |  DOWNLOADS  |  RSSCONTACT
POLICY  |  DISCLAIMER  |  ACCESSIBILITY

Safer, Healthier People

Morbidity and Mortality Weekly Report
Centers for Disease Control and Prevention
1600 Clifton Rd, MailStop E-90, Atlanta, GA 30333, U.S.A

USA.GovDHHS

Department of Health
and Human Services

This page last reviewed 5/2/01