 |
|
|
|
|
|
|
| ||||||||||
|
|
|
|
|
|
|
||||
| ||||||||||
|
|
|
|
|
Persons using assistive technology might not be able to fully access information in this file. For assistance, please send e-mail to: mmwrq@cdc.gov. Type 508 Accommodation and the title of the report in the subject line of e-mail. Influenza and Pneumococcal Vaccination Rates Among Persons with Diabetes Mellitus -- United States, 1997Vaccination is an important public health intervention for reducing morbidity and mortality from influenza and pneumonia among persons with diabetes (1,2). A national health objective for 2000 is to increase influenza and pneumococcal vaccination rates to greater than or equal to 60% among persons at high risk for complications from influenza and pneumonia, including persons with diabetes (objective 20.11) (3). Although the Advisory Committee on Immunization Practices (ACIP) recommends that all persons with diabetes be vaccinated, data from the 1993 Behavioral Risk Factor Surveillance System (BRFSS) showed that 40% of persons with diabetes reported receiving an influenza vaccination within the previous year, and 21% reported ever receiving a pneumococcal vaccination (4). To assess the vaccination rates among persons with diabetes in 52 reporting areas (i.e., 50 states, the District of Columbia, and Puerto Rico), CDC and the Council of State and Territorial Epidemiologists (CSTE) analyzed data from the 1997 BRFSS. This report summarizes the findings of this analysis, which indicate that most states did not reach the national health objectives for influenza and pneumococcal vaccination in their populations with diabetes. BRFSS is an ongoing, state-based, random-digit-dialed telephone survey of non-institutionalized civilian adults aged greater than or equal to 18 years. The analysis included only respondents who answered "yes" to the question, "Has a doctor ever told you that you have diabetes?" Women who were told they had diabetes only during pregnancy were not classified as having diabetes. In 1997, influenza and pneumococcal vaccination rates for the 52 reporting areas were examined; 7011 respondents with diabetes from the reporting areas were included in this analysis. Responses for two questions related to vaccination status were analyzed: "During the past 12 months, have you had a flu shot?" and "Have you ever had a pneumonia vaccination?" Of the 7011 respondents, 181 (2.6%) and 384 (5.5%) did not report or did not know their influenza and pneumococcal vaccination status, respectively, and were excluded from the analysis. Data from all of the reporting areas were analyzed to determine sociodemographic characteristics associated with receipt of influenza and pneumococcal vaccinations. Racial/ethnic groups other than non-Hispanic whites, non-Hispanic blacks, and Hispanics were not included because numbers, when presented separately, were too small for meaningful analysis. Data were weighted by age, sex, and racial/ethnic distribution to reflect the adult population of each of the 52 reporting areas. SUDAAN was used to calculate point estimates, 95% confidence intervals (CIs), and significant differences (p less than 0.05). Among adults with diabetes, 52.1% reported receiving influenza vaccine during the previous 12 months, and 33.2% reported ever receiving pneumococcal vaccine (Table 1). Non-Hispanic whites were significantly more likely to report receiving influenza and pneumococcal vaccines (56.6% and 38.8%, respectively) than non-Hispanic blacks (48.1% and 24.9%, respectively) and Hispanics (41.0% and 20.9%, respectively). Women were slightly more likely than men to report vaccination, but this difference was significant only for pneumococcal vaccine. As age increased, report of vaccination significantly increased, from 27.7% (ages 18-44 years) to 69.6% (ages greater than or equal to 75 years) for influenza vaccination and from 11.2% (ages 18-44 years) to 53.4% (ages greater than or equal to 75 years) for pneumococcal vaccination. No significant association was noted between receipt of vaccination and level of education. Receipt of influenza and pneumococcal vaccinations varied by reporting area (Figure 1 and Figure 2, Table 2). Rates for influenza vaccination ranged from 29.1% in Puerto Rico to 79.9% in Maine (Table 2). Twelve of the reporting areas met the national health objective of greater than or equal to 60% for influenza vaccination, and another 23 areas were within 5 percentage points of the objective. Rates for pneumococcal vaccination ranged from 22.0% in Arkansas and Puerto Rico to 48.6% in Montana (Table 2); no reporting areas reached the national health objective. Overall, rates for both vaccines were lowest in the southeast regions and highest in the northwest regions. Reported by: SM Benjamin, PhD, Council of State and Territorial Epidemiologists, Atlanta, Georgia. The following BRFSS coordinators: J Cook, MBA, Alabama; P Owen, Alaska; B Bender, MBA, Arizona; T Clark, Arkansas; B Davis, PhD, California; M Leff, MSPH, Colorado; M Adams, MPH, Connecticut; F Breukelman, Delaware; I Bullo, District of Columbia; S Hoecherl, Florida; L Martin, MS, Georgia; A Onaka, PhD, Hawaii; J Aydelotte, MA, Idaho; B Steiner, MS, Illinois; K Horvath, Indiana; K MacIntyre, Iowa; J Tasheff, Kansas; T Sparks, Kentucky; B Bates, MSPH, Louisiana; D Maines, Maine; A Weinstein, MA, Maryland; D Brooks, MPH, Massachusetts; H McGee, MPH, Michigan; N Salem, PhD, Minnesota; D Johnson, MS, Mississippi; T Murayi, PhD, Missouri; P Feigley, PhD, Montana; L Andelt, PhD, Nebraska; E DeJan, MPH, Nevada; L Powers, MA, New Hampshire; G Boeselager, MS, New Jersey; W Honey, MPH, New Mexico; C Baker, New York; P Buescher, PhD, North Carolina; L Shireley, MPH, North Dakota; P Pullen, Ohio; N Hann, MPH, Oklahoma; J Grant-Worley, MS, Oregon; L Mann, Pennsylvania; Y Cintron, MPH, Puerto Rico; J Hesser, PhD, Rhode Island; M Wu, MD, South Carolina; M Gildemaster, South Dakota; D Ridings, Tennessee; K Condon, Texas; K Marti, Utah; C Roe, MS, Vermont; K Carswell, MPH, Virginia; K Wynkoop-Simmons, PhD, Washington; F King, West Virginia; P Imm, MS, Wisconsin; M Futa, MA, Wyoming. Epidemiology and Statistics Br, Div of Diabetes Translation, National Center for Chronic Disease Prevention and Health Promotion, CDC. Editorial Note:Although the vaccination rates in this report are higher than those reported in 1993, a large gap remains between influenza and pneumococcal vaccination rates among persons with diabetes and the national health objective for 2000. Pneumonia and influenza are more likely to be listed as a cause of death for persons with diabetes than for persons without diabetes, and many deaths associated with pneumonia and influenza can be attributed to diabetes (1). For persons with diabetes, influenza and pneumococcal vaccines can reduce the number of respiratory infections, the number and length of hospitalizations for respiratory infections, the number of deaths from these infections, and medical expenses associated with influenza and pneumonia (2). The national health objective for 2000 was reached only for influenza vaccination among persons aged greater than or equal to 65 years with diabetes. Since the ACIP recommends that everyone aged greater than or equal to 65 years receive influenza and pneumococcal vaccinations (5,6), it may be routine for providers to offer vaccinations to persons aged greater than or equal to 65 years with diabetes. The findings indicate that many patients and providers may not be aware of the ACIP guidelines for persons with diabetes. Increased efforts are necessary to heighten awareness of the need for increased vaccination and to improve routine use of vaccination among persons of all ages with diabetes. These efforts should include incorporating recommendations for influenza and pneumococcal vaccinations into standard-of-care guidelines for persons with diabetes. The findings that Hispanics and non-Hispanic blacks had lower vaccination rates than non-Hispanic whites are consistent with the 1993 examination of vaccination rates among persons with diabetes (4). These disparities may result from differences in access to vaccination services across these groups, differences in the quality of care received by different racial/ethnic groups, or social and cultural factors that impact vaccine acceptance. These disparities must be investigated further to improve vaccination rates in these populations. Vaccination rates varied substantially among reporting areas, perhaps because of differences in demographic distribution, provision of adult vaccination programs, physician practice patterns, access to health care, and patient attitudes. CDC is evaluating these patterns to learn why they occur and how reporting areas with low coverage levels can improve them. The findings in this analysis are subject to at least two limitations. First, persons residing in nursing homes and in households without telephones were not included in this survey; therefore, these results cannot be generalized to these segments of the population. Second, because data were self-reported, they are subject to recall bias. Self-report of diabetes and of influenza vaccination are highly accurate (7,8), but self-report of pneumococcal vaccination may be less accurate than self-report of influenza vaccination (9). Most reporting areas did not meet the national vaccination objectives among their populations with diabetes. Recognizing the importance of preventive-care practices in reducing morbidity and mortality among persons with diabetes, CSTE has recommended that receipt of preventive-care practices among persons with diabetes, including influenza and pneumococcal vaccination, be placed under national public health surveillance. CDC and other federal agencies have implemented the racial/ethnic disparities initiative. One objective is to eliminate racial/ethnic health disparities in vaccination rates by 2010. Additional information about the initiative is available from the World-Wide Web at http://raceandhealth.hhs.gov/* and http://www.cdc.gov/diabetes/projs/racial_init.htm. In 1998, to improve vaccination rates among persons with diabetes, CDC implemented the Diabetes Flu/Pneumococcal Campaign entitled "Diabetes. One Disease. Many Risks." Through state-based diabetes-control programs (DCPs), the campaign encourages persons with diabetes to receive influenza and pneumococcal vaccinations. DCPs are implementing health systems-based interventions to encourage health-care professionals to recommend influenza and pneumococcal vaccinations. Because persons with diabetes report a high rate of routine medical care, these interventions can have a large impact on improving vaccination rates. Interventions that include standing orders for vaccination, using provider and patient recalls and reminders, and feedback on vaccination levels have been shown to be effective in increasing vaccination rates (10). In addition, opportunities for vaccination outside of traditional health-care settings should be extended to persons with diabetes who routinely do not have access to traditional health-care facilities (10). Additional information about the Diabetes Flu/Pneumococcal Campaign is available from the World-Wide Web at http://www.cdc.gov/diabetes/projs/cdc-flu.htm and http://www.cdc.gov/diabetes/states/states.htm. References
* References to sites of non-CDC organizations on the Internet are provided as a service to MMWR readers and do not constitute or imply endorsement of these organizations or their programs by CDC or the U.S. Department of Health and Human Services. CDC is not responsible for the content of pages found at these sites. Table 1 Note: To print large tables and graphs users may have to change their printer settings to landscape and use a small font size. TABLE 1. Percentage of persons aged >=18 years with diabetes in the 50 states, the District of Columbia, and Puerto Rico who reported receiving influenza or pneumococcal vaccine, by selected characteristics -- United States, Behavioral Risk Factor Surveillance System, 1997
* Confidence interval. Return to top. Figure 1 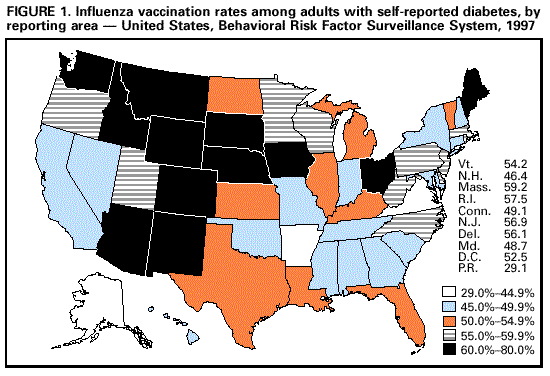 Return to top. Table 2 Note: To print large tables and graphs users may have to change their printer settings to landscape and use a small font size. TABLE 2. Percentage of persons aged >=18 years with diabetes in the 50 states, the District of Columbia, and Puerto Rico who reported receiving influenza or pneumococcal vaccine, by reporting area -- United States, Behavioral Risk Factor Surveillance System, 1997
* Confidence interval. Return to top. Figure 2 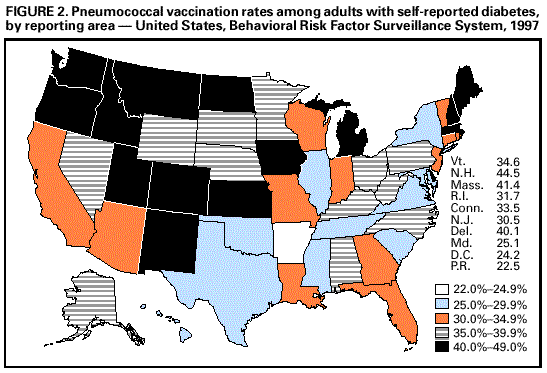 Return to top. Disclaimer All MMWR HTML versions of articles are electronic conversions from ASCII text into HTML. This conversion may have resulted in character translation or format errors in the HTML version. Users should not rely on this HTML document, but are referred to the electronic PDF version and/or the original MMWR paper copy for the official text, figures, and tables. An original paper copy of this issue can be obtained from the Superintendent of Documents, U.S. Government Printing Office (GPO), Washington, DC 20402-9371; telephone: (202) 512-1800. Contact GPO for current prices. **Questions or messages regarding errors in formatting should be addressed to mmwrq@cdc.gov.Page converted: 10/28/1999 |
||||||||||||||||||||||||||||||||||||||||||||||||||||||||||||||||||||||||||||||||||||||||||||||||||||||||||||||||||||||||||||||||||||||||||||||||||||||||||||||||||||||||||||||||||||||||||||||||||||||||||||||||||||||||||||||||||||||||||||||||||||||||||||||||||||||||||||||||||||||||||||||||||||||||||||||||||||||||||||||||||||||||||||||||||||||||||||||||||||||||||||||||||||||||||||||||||||||||||||||||||||||||||||||||||||||||||||||||||||||||||||||||||||||||||||||||||||||||||||||||||||||||||||||||||||||||||||||||||||||||
This page last reviewed 5/2/01
| ||||||||||||||||||||||||||||||||||||||||||||||||||||||||||||||||||||||||||||||||||||||||||||||||||||||||||||||||||||||||||||||||||||||||||||||||||||||||||||||||||||||||||||||||||||||||||||||||||||||||||||||||||||||||||||||||||||||||||||||||||||||||||||||||||||||||||||||||||||||||||||||||||||||||||||||||||||||||||||||||||||||||||||||||||||||||||||||||||||||||||||||||||||||||||||||||||||||||||||||||||||||||||||||||||||||||||||||||||||||||||||||||||||||||||||||||||||||||||||||||||||||||||||||||||||||||||||||||||||||||