Skip Navigation LinksSkip Navigation Links
Centers for Disease Control and Prevention
Safer Healthier People
Blue White
Blue White
bottom curve
CDC Home Search Health Topics A-Z spacer spacer
spacer
Blue curve MMWR spacer
spacer
spacer

Notifiable Diseases/Deaths in Selected Cities Weekly Information

Figure I   Selected notifiable disease reports, comparison of provisional 4-week totals ending August 7, 1999, with historical data -- United States

Table I   Summary -- provisional cases of selected notifiable diseases, United States, cumulative, week ending August 7, 1999 (31st Week)

Table II   Provisional cases of selected notifiable diseases, United States, weeks ending August 7, 1999 and August 8, 1998 (31st Week)

Table III   Provisional cases of selected notifiable diseases preventable by vaccination, United States, weeks ending August 7, 1999 and August 8, 1998 (31st Week)

Table IV   Deaths in 122 U.S. cities, week ending August 7, 1999 (31st Week)


Figure I

Figure I
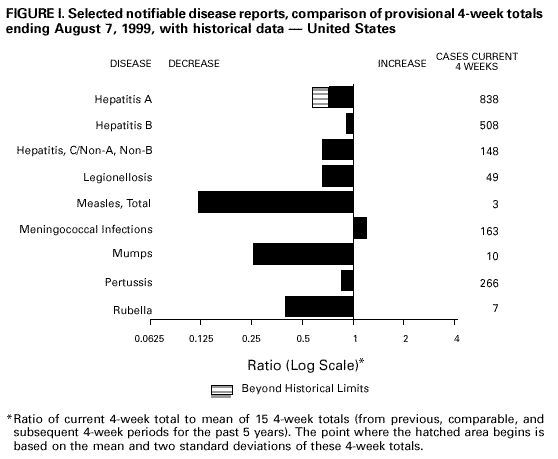
Return to top.

Table I
Note: To print large tables and graphs users may have to change their printer settings to landscape and use a small font size.
TABLE I. Summary -- provisional cases of selected notifiable diseases, United
States, cumulative, week ending August 7, 1999 (31st Week)
==================================================================================
                                             Cum. 1999
------------------------------------------------------
Anthrax                                              -
Brucellosis*                                        23
Cholera                                              4
Congenital rubella syndrome                          3
Cyclosporiasis*                                     16
Diphtheria                                           2
Encephalitis:  California*                           6
               eastern equine*                       2
               St. Louis*                            -
               western equine*                       -
Ehrlichiosis   human granulocytic (HGE)*            77
               human monocytic (HME)*               18
Hansen Disease*                                     50
Hantavirus pulmonary syndrome*+                     11
Hemolytic uremic syndrome, post-diarrheal*          41
HIV infection, pediatric*&                          86
Plague                                               2
Poliomyelitis, paralytic                             -
Psittacosis*                                        16
Rabies, human                                        -
Rocky Mountain spotted fever (RMSF)                283
Streptococcal disease, invasive Group A          1,364
Streptococcal toxic-shock syndrome*                 27
Syphilis, congenital@                              109
Tetanus                                             16
Toxic-shock syndrome                                72
Trichinosis                                          6
Typhoid fever                                      174
Yellow fever                                         -
------------------------------------------------------
-: no reported cases
 * Not notifiable in all states
 + Updated weekly from reports to the Division of Viral and Rickettsial
   Diseases, National Center for Infectious Diseases (NCID).
 & Updated monthly from reports to the Division of HIV/AIDS Prevention --
   Surveillance and Epidemiology, National Center for HIV, STD, and TB
   Prevention (NCHSTP), last update July 25, 1999.
 @ Updated from reports to the Division of STD Prevention, NCHSTP.

==================================================================================


Return to top.

Table II
Note: To print large tables and graphs users may have to change their printer settings to landscape and use a small font size.
TABLE II. (page 1) Provisional cases of selected notifiable diseases, United States, weeks ending
August 7, 1999, and August 8, 1998 (31st Week)

                                                                                                    Escherichia
                                                                                                   coli O157:H7*
                                                                                     -----------------------------------------
                          AIDS              Chlamydia          Cryptosporidiosis            NETSS                  PHLIS
                   -----------------   --------------------   -------------------    -------------------      ----------------
                     Cum.       Cum.        Cum.       Cum.       Cum.       Cum.        Cum.       Cum.       Cum.       Cum.
Reporting Area       1999**     1998        1999       1998       1999       1999        1999       1998       1999       1998
------------------------------------------------------------------------------------------------------------------------------
UNITED STATES      26,427     27,228     345,146    343,124        834      1,254       1,266      1,373        761      1,188

NEW ENGLAND         1,298      1,007      11,121     12,170         50         96         150        176        119        165
Maine                  43         21         193        607         13         21          17         21          -          -
N.H.                   31         23         550        575          7         11          19         22         21         32
Vt.                     6         14         282        244         12         15          16          8          7          7
Mass.                 842        506       5,354      4,978         18         44          82         95         52         91
R.I.                   70         81       1,383      1,416          -          5          16          5          6          1
Conn.                 306        362       3,359      4,350          -          -           U         25         33         34

MID. ATLANTIC       6,746      7,543      43,265     35,961        117        337          88        145         31         51
Upstate N.Y.          846        966           N          N         76        198          80         97          -          -
N.Y. City           3,592      4,053      21,963     15,786         22        126           2          8          8          9
N.J.                1,278      1,458       6,300      6,935          9         13           6         40         23         31
Pa.                 1,030      1,066      15,002     13,240         10          -           N          N          -         11

E.N. CENTRAL        1,719      2,071      49,570     58,149         85        148         246        244        152        206
Ohio                  262        435      14,051     15,798         26         47          95         59         53         40
Ind.                  224        353       6,548      6,256         14         30          35         58         22         31
Ill.                  783        818      16,512     15,567         16         43          71         68         33         43
Mich.                 360        350      12,459     12,486         29         18          45         59         17         38
Wis.                   90        115           U      8,042          -         10           N          N         27         54

W.N. CENTRAL          611        528      18,994     20,253         76        171         262        205        141        197
Minn.                 105        102       3,264      4,123         14         58          81         79         80         95
Iowa                   55         49       1,398      2,274         22         41          55         55         26         35
Mo.                   295        243       8,279      7,362         15         14          26         19         26         35
N. Dak.                 4          4         325        572         11         18           3          6          1         12
S. Dak.                13         11         832        955          4         18          27         12          4         14
Nebr.                  45         48       1,933      1,707          9         18          56         19          -          -
Kans.                  94         71       2,963      3,260          1          4          14         15          4          6

S. ATLANTIC         7,281      6,810      76,483     65,779        191        136         157        101         91         95
Del.                   95         90       1,610      1,473          -          1           2          -          1          1
Md.                   793        824       6,397      4,779         10         12          10         19          -          9
D.C.                  274        566           N          N          7          4           -          1          -          -
Va.                   372        501       8,603      7,291         10          2          35          -         29         34
W. Va.                 40         59       1,088      1,440          -          1           7          6          1          3
N.C.                  482        459      13,619     12,688          5          -          30         20         27         32
S.C.                  683        449       8,635     11,208          -          -          17          5         13          3
Ga.                 1,091        727      18,651     13,699         94         47          14         39          -          -
Fla.                3,451      3,135      17,880     13,201         65         69          42         11         20         13

E.S. CENTRAL        1,145      1,079      24,786     23,714         14         17          77         77         34         44
Ky.                   176        155       4,442      3,645          4          7          22         24          -          -
Tenn.                 442        374       8,282      7,854          4          6          34         32         18         27
Ala.                  287        329       7,013      5,978          4          -          17         18         13         16
Miss.                 240        221       5,049      6,237          2          4           4          3          3          1

W.S. CENTRAL        2,858      3,318      50,230     51,712         34         32          43         54         47         64
Ark.                  107        123       3,500      2,177          -          5           7          6          5          8
La.                   541        581       7,726      8,260         21         10           3          3          6          2
Okla.                  74        184       4,937      5,928          3          3          15         10          9          5
Tex.                2,136      2,430      34,067     35,347         10         14          18         35         27         49

MOUNTAIN            1,021        965      19,611     19,173         52         81         109        186         63        154
Mont.                   5         18         817        731          8          6           8          8          -          2
Idaho                  16         19         988      1,156          3         15           9         19          6         13
Wyo.                    4          1         445        386          -          -           3         49          5         53
Colo.                 197        186       4,228      4,816          5          8          38         35         28         33
N. Mex.                65        153       2,711      2,172         22         33           5         16          2         13
Ariz.                 518        376       7,628      6,548          9         12          19         21         12         16
Utah                   84         70       1,169      1,378          -          -          20         30          8         15
Nev.                  132        142       1,625      1,986          5          7           7          8          2          9

PACIFIC             3,748      3,907      51,086     56,213        215        236         134        185         83        212
Wash.                 218        266       6,982      6,582          -          -          36         31         26         60
Oreg.                 118        117       3,548      3,149         79         25          32         56         23         60
Calif.              3,348      3,411      37,724     43,962        136        208          66         96         28         82
Alaska                 13         17       1,099      1,131          -          -           -          2          -          -
Hawaii                 51         96       1,733      1,389          -          3           -          -          6         10

Guam                    5          -         226        232          -          -           N          N          -          -
P.R.                  821      1,136           U          U          -          -           5          2          U          U
V.I.                   19         18           N          N          -          -           N          N          U          U
Amer. Samoa             -          -           U          U          -          -           N          N          U          U
C.N.M.I.                -          -           N          N          -          -           N          N          U          U
------------------------------------------------------------------------------------------------------------------------------
N: Not notifiable    U: Unavailable    -: no reported cases    C.N.M.I.: Commonwealth of North Mariana Islands

 * Individual cases may be reported through both the National Electronic Telecommunications System for Surveillance (NETSS)
   and the Public Health Laboratory Information System (PHLIS).
** Updated monthly from reports to the Division of HIV/AIDS Prevention -- Surveillance and Epidemiology, National Center for HIV,
   STD, and TB Prevention, last update July 25, 1999.

=======================================================================================================================================================

TABLE II. (page 2) Provisional cases of selected notifiable diseases, United States, weeks ending
August 7, 1999, and August 8, 1998 (31st Week)

                                            Hepatitis                                       Lyme
                       Gonorrhea             C/NA,NB             Legionellosis             Disease
                   -----------------   --------------------   -------------------    -------------------
                     Cum.       Cum.        Cum.       Cum.       Cum.       Cum.        Cum.       Cum.
Reporting Area       1999       1998        1999       1998       1999       1998        1999       1998
--------------------------------------------------------------------------------------------------------
UNITED STATES     185,921    201,328       2,158      1,954        535        731       4,870      7,446

NEW ENGLAND         3,369      3,464          59         46         36         45       1,327      2,681
Maine                  15         37           2          -          4          1          15         43
N.H.                   58         54           -          -          3          3           2         25
Vt.                    33         21           4          2          8          4           4          7
Mass.               1,500      1,219          50         41         12         21         470        530
R.I.                  358        211           3          3          3          8         225        214
Conn.               1,405      1,922           -          -          6          8         611      1,862

MID. ATLANTIC      23,553     21,550          97        128        102        174       2,671      3,586
Upstate N.Y.        3,679      3,950          62         64         32         47       1,819      1,721
N.Y. City           9,463      7,081           -          -          7         28          14        122
N.J.                3,465      4,458           -          -          5          9         124        683
Pa.                 6,946      6,061          35         64         58         90         714      1,060

E.N. CENTRAL       32,785     39,405       1,126        445        144        252          74        454
Ohio                8,541     10,073           1          7         51         90          48         23
Ind.                3,868      3,602           1          5         43         45          23         17
Ill.               11,650     12,788          22         30         10         29           2         11
Mich.               8,726      9,423         520        296         37         47           1         11
Wis.                    U      3,519         582        107          3         41           U        392

W.N. CENTRAL        8,103      9,807          84         25         29         37          87         79
Minn.               1,208      1,518           4          7          1          3          37         46
Iowa                  367        714           -          7         13          5          17         18
Mo.                 4,285      5,275          71          8         10          9          16          8
N. Dak.                31         49           -          -          -          -           1          -
S. Dak.                83        150           -          -          2          2           -          -
Nebr.                 881        684           3          2          3         15           6          3
Kans.               1,248      1,417           6          1          -          3          10          4

S. ATLANTIC        55,840     54,167         139         63         72         82         497        491
Del.                  999        815           1          -          6          8          19         37
Md.                 5,625      5,443          30          8         12         25         339        352
D.C.                1,456      2,674           -          -          1          5           3          4
Va.                 5,844      4,153          10          7         16          9          53         35
W. Va.                307        496          13          4          N          N          13          8
N.C.               11,832     11,050          29         14         13          6          44         35
S.C.                4,645      7,255          14          3          7          7           5          3
Ga.                12,392     11,659           1          9          -          3           -          3
Fla.               12,740     10,622          41         18         17         19          21         14

E.S. CENTRAL       19,711     22,493         193        159         66         40          76         56
Ky.                 1,959      2,087          10         16         49         17          20         12
Tenn.               6,649      6,715          84         85         14         11          30         24
Ala.                6,245      7,645           1          3          3          5          15         11
Miss.               4,858      6,046          98         55          -          7          11          9

W.S. CENTRAL       27,655     31,756         143        312          3         13          17         16
Ark.                1,769      2,413           9         12          -          1           2          6
La.                 6,054      7,205         100         19          1          2           -          2
Okla.               2,413      3,230          12          7          2          8           4          2
Tex.               17,419     18,908          22        274          -          2          11          6

MOUNTAIN            5,399      5,248          89        277         31         43          10          7
Mont.                  22         26           4          7          -          2           -          -
Idaho                  49        107           4         85          -          2           1          2
Wyo.                   14         18          30         63          -          1           3          1
Colo.               1,311      1,203          15         17          9          8           -          -
N. Mex.               553        526           5         64          1          2           1          2
Ariz.               2,687      2,375          21          4          4          9           -          -
Utah                  107        150           5         19         11         16           3          -
Nev.                  656        843           5         18          6          3           2          2

PACIFIC             9,506     13,438         228        499         52         45         111         76
Wash.               1,210      1,132          10         12          9          8           3          5
Oreg.                 489        442          15         10          N          N           7         11
Calif.              7,389     11,385         203        423         42         35         101         59
Alaska                181        191           -          -          1          1           -          1
Hawaii                237        288           -         54          -          1           -          -

Guam                   32         29           -          -          -          2           -          -
P.R.                  176        238           -          -          -          -           -          -
V.I.                    U          U           U          U          U          U           U          U
Amer. Samoa             U          U           U          U          U          U           U          U
C.N.M.I.                -         24           -          -          -          -           -          -

--------------------------------------------------------------------------------------------------------
N: Not notifiable    U: Unavailable    -: no reported cases
=======================================================================================================================================================

TABLE II. (page 3) Provisional cases of selected notifiable diseases, United States, weeks ending
August 7, 1999, and August 8, 1998 (31st Week)

                                                                            Salmonellosis*
                                                              ------------------------------------------
                        Malaria           Rabies, Animal             NETSS                  PHLIS
                   -----------------   --------------------   -------------------    -------------------
                     Cum.       Cum.        Cum.       Cum.       Cum.       Cum.        Cum.       Cum.
Reporting Area       1999       1998        1999       1998       1999       1998        1999       1998
--------------------------------------------------------------------------------------------------------
UNITED STATES         672        764       3,273      4,456     17,687     20,972      13,933     18,626

NEW ENGLAND            27         42         486        823        914      1,354         951      1,293
Maine                   2          3          90        138         84        101          53         40
N.H.                    2          3          31         44         76         97          86        141
Vt.                     2          -          63         37         46         73          37         56
Mass.                  10         16         102        271        651        759         498        761
R.I.                    3          2          61         47         57         83          48         31
Conn.                   8         18         139        286          U        241         229        264

MID. ATLANTIC         143        214         636        961      1,991      3,604       1,601      3,515
Upstate N.Y.           43         48         450        668        674        839         580        836
N.Y. City              50        117           U          U        458      1,168         579      1,009
N.J.                   29         29         113        119        332        732         442        719
Pa.                    21         20          73        174        527        865           -        951

E.N. CENTRAL           66         83          67         69      2,389      3,575       1,853      2,649
Ohio                   14          5          23         43        650        863         448        731
Ind.                   10          7           -          5        256        393         201        345
Ill.                   19         35           3          -        881      1,096         399        687
Mich.                  21         31          38         19        564        698         534        597
Wis.                    2          5           3          2         38        525         271        289

W.N. CENTRAL           34         51         360        486      1,230      1,304       1,062      1,348
Minn.                   6         26          64         80        303        314         371        361
Iowa                   12          4          83        109        157        221          71        183
Mo.                    12         12           9         24        397        377         477        498
N. Dak.                 -          2          88         89         20         36           4         50
S. Dak.                 -          -          44        111         62         54          26         67
Nebr.                   -          1           2          5        119        103           -         25
Kans.                   4          6          70         68        172        199         113        164

S. ATLANTIC           205        154       1,232      1,477      4,027      3,705       2,876      3,021
Del.                    1          1          29         26         54         42          91         74
Md.                    61         50         238        304        429        498         421        488
D.C.                   11         12           -          -         51         45           -          -
Va.                    45         29         313        371        701        564         570        502
W. Va.                  1          1          71         54         89         92          81         92
N.C.                   12         12         247        385        566        507         589        677
S.C.                    5          4         102         98        261        252         217        244
Ga.                    19         17         122        121        603        608         651        665
Fla.                   50         28         110        118      1,273      1,097         256        279

E.S. CENTRAL           15         18         173        177      1,010      1,065         508        899
Ky.                     5          3          24         24        228        230           -        103
Tenn.                   6          9          63         95        269        307         258        412
Ala.                    3          4          86         56        299        287         217        316
Miss.                   1          2           -          2        214        241          33         68

W.S. CENTRAL            9         15          73        110      1,221      1,828       1,353      1,520
Ark.                    -          1          14         19        243        216          76        165
La.                     6          6           -          -        159        240         220        389
Okla.                   2          1          59         91        202        222         130         73
Tex.                    1          7           -          -        617      1,150         927        893

MOUNTAIN               26         39         116        117      1,723      1,353       1,146      1,265
Mont.                   4          -          41         34         37         54           1         33
Idaho                   1          7           -          -         53         63          45         58
Wyo.                    1          -          32         45         27         40          22         35
Colo.                  10         10           1          4        462        329         454        320
N. Mex.                 2         11           5          3        217        156         151        148
Ariz.                   5          5          32         25        532        399         420        435
Utah                    2          1           4          6        289        193           -        119
Nev.                    1          5           1          -        106        119          53        117

PACIFIC               147        148         130        236      3,182      3,184       2,583      3,116
Wash.                  13         14           -          -        365        263         279        386
Oreg.                  14         13           1          1        287        176         327        210
Calif.                112        117         122        214      2,270      2,590       1,781      2,362
Alaska                  1          1           7         21         26         25           6         17
Hawaii                  7          3           -          -        234        130         190        141

Guam                    -          1           -          -         20         14           -          -
P.R.                    -          -          43         32        230        398           -          -
V.I.                    U          U           U          U          -          -           -          -
Amer. Samoa             U          U           U          U          -          -           -          -
C.N.M.I.                -          -           -          -          -         17           -          -

--------------------------------------------------------------------------------------------------------
N: Not notifiable    U: Unavailable    -: no reported cases

* Individual cases may be reported through both the National Electronic Telecommunications System for Surveillance (NETSS)
  and the Public Health Laboratory Information System (PHLIS).
=======================================================================================================================================================

TABLE II. (page 4) Provisional cases of selected notifiable diseases, United States, weeks ending
August 7, 1999, and August 8, 1998 (31st Week)

                                  Shigellosis*
                    ---------------------------------------          Syphilis
                         NETSS                  PHLIS          (Primary & Secondary)      Tuberculosis
                    ----------------       ----------------    ---------------------    ------------------
                     Cum.       Cum.        Cum.       Cum.       Cum.       Cum.        Cum.       Cum.
Reporting Area       1999       1998        1999       1998       1999       1998        1999**     1998**
----------------------------------------------------------------------------------------------------------
UNITED STATES       7,296     10,929       3,209      6,041      3,664      4,137       7,974      9,465

NEW ENGLAND           200        256         145        228         32         41         242        251
Maine                   4          8           -          -          -          1          12          6
N.H.                    7         10           6         12          -          1           6          6
Vt.                     4          4           3          -          3          4           1          3
Mass.                 171        168          93        154         20         24         142        131
R.I.                   14         20           9         12          1          1          26         34
Conn.                   U         46          34         50          8         10          55         71

MID. ATLANTIC         439      1,510         213      1,232        160        176       1,433      1,730
Upstate N.Y.          149        306          34         98         19         23         166        211
N.Y. City             115        479          81        489         67         34         783        831
N.J.                  103        460          98        443         27         62         320        370
Pa.                    72        265           -        202         47         57         164        318

E.N. CENTRAL        1,170      1,605         612        828        684        597         682        980
Ohio                  293        324          60         78         62         87         147        151
Ind.                  112        102          28         30        200        110           U         99
Ill.                  500        867         354        687        293        252         324        462
Mich.                 217        154         120          4        129        104         172        200
Wis.                   48        158          50         29          U         44          39         68

W.N. CENTRAL          643        547         445        249         85         89         272        263
Minn.                 115         97         159        113          5          6          95         87
Iowa                   15         43          15         32          7          -          29         20
Mo.                   438         70         245         53         57         70         106         96
N. Dak.                 2          4           -          3          -          -           2          3
S. Dak.                10         27           4         20          -          1           9         14
Nebr.                  37        286           -         15          6          4          12         10
Kans.                  26         20          22         13         10          8          19         33

S. ATLANTIC         1,391      2,332         312        763      1,178      1,542       1,822      1,597
Del.                    8         14           4          9          6         16          12         20
Md.                    77        115          23         39        234        430         155        179
D.C.                   34         12           -          -         34         45          29         68
Va.                    60         97          32         50         98         98         131        174
W. Va.                  7         11           3          7          2          2          29         26
N.C.                  128        184          60         89        294        445         235        244
S.C.                   81         98          38         35        125        179         194        191
Ga.                   130        616          37        171        201        170         391        283
Fla.                  866      1,185         115        363        184        157         646        412

E.S. CENTRAL          762        516         374        320        667        724         339        697
Ky.                   167         79           -         37         58         70         106        106
Tenn.                 473         92         333        127        384        343           U        231
Ala.                   67        309          37        154        139        162         177        227
Miss.                  55         36           4          2         86        149          56        133

W.S. CENTRAL        1,009      2,144         754        668        540        580         874      1,357
Ark.                   56        121          21         29         40         75          92         72
La.                    76        147          53        181        121        237           U         75
Okla.                 330        163         102         43        124         23          81        105
Tex.                  547      1,713         578        415        255        245         701      1,105

MOUNTAIN              463        665         241        400        151        147         249        319
Mont.                   6          6           -          3          -          -          10         12
Idaho                  10         12           5          8          1          1          14          7
Wyo.                    2          1           1          -          -          1           1          3
Colo.                  78         93          60         77          1          8           U         35
N. Mex.                54        164          23         77         10         19          37         37
Ariz.                 252        346         146        212        131        103         141        123
Utah                   31         23           -         16          2          3          27         36
Nev.                   30         20           6          7          6         12          19         66

PACIFIC             1,219      1,354         113      1,353        167        241       2,061      2,271
Wash.                  58         74          51         80         46         23          91        147
Oreg.                  40         83          40         77          4          2          64         70
Calif.              1,097      1,167           -      1,167        114        215       1,770      1,917
Alaska                  -          4           -          2          1          -          35         33
Hawaii                 24         26          22         27          2          1         101        104

Guam                    7         25           -          -          1          1           -         51
P.R.                   40         34           -          -        101        121          41         88
V.I.                    -          -           -          -          U          U           U          U
Amer. Samoa             -          -           -          -          U          U           U          U
C.N.M.I.                -         13           -          -          -        147           -         68

----------------------------------------------------------------------------------------------------------
N: Not notifiable    U: Unavailable    -: no reported cases

 * Individual cases may be reported through both the National Electronic Telecommunications System for Surveillance (NETSS)
   and the Public Health Laboratory Information System (PHLIS).
** Cumulative reports of provisional tuberculosis cases for 1998 and 1999 are unavailable ('U') for some
   areas using the Tuberculosis Information Management System (TIMS).

=======================================================================================================================================================


Return to top.

Table III
Note: To print large tables and graphs users may have to change their printer settings to landscape and use a small font size.
TABLE III. (page 1) Provisional cases of selected notifiable diseases preventable by vaccination, United
States, weeks ending August 7, 1999, and August 8, 1998 (31st Week)

                                                Hepatitis (Viral), by type                                    Measles (Rubeola)
                     H. influenzae,       ---------------------------------------        ------------------------------------------------------------
                        invasive                  A                     B                  Indigenous            Imported*                 Total
                    ----------------      -----------------     -----------------        ---------------       ---------------        ---------------
                     Cum.       Cum.        Cum.       Cum.       Cum.       Cum.                   Cum.                  Cum.        Cum.       Cum.
Reporting Area       1999**     1998        1999       1998       1999       1998        1999       1999       1999       1999        1999       1998
-----------------------------------------------------------------------------------------------------------------------------------------------------
UNITED STATES         745        710       8,996     13,521      3,829      5,794           -         33          1         17          50         47

NEW ENGLAND            55         47         120        172         62        115           -          5          -          4           9          3
Maine                   5          2           5         13          1          2           -          -          -          -           -          -
N.H.                   12          8           9          8          9         10           -          -          -          1           1          -
Vt.                     4          3           3         13          1          4           -          -          -          -           -          1
Mass.                  21         31          38         63         28         45           -          4          -          2           6          2
R.I.                    1          2          11         10         23         35           -          -          -          -           -          -
Conn.                  12          1          54         65          -         19           -          1          -          1           2          -

MID. ATLANTIC         111        107         566      1,039        422        778           -          -          -          2           2         13
Upstate N.Y.           59         34         156        201        124        144           -          -          -          2           2          2
N.Y. City              19         33         104        364         96        268           -          -          -          -           -          -
N.J.                   32         33          57        211         40        137           -          -          -          -           -          8
Pa.                     1          7         249        263        162        229           -          -          -          -           -          3

E.N. CENTRAL          110        121       1,757      1,988        383        880           -          1          -          1           2         15
Ohio                   41         40         428        208         58         48           -          -          -          -           -          1
Ind.                   20         27         105         97         32         69           -          1          -          -           1          3
Ill.                   40         45         300        469          -        154           -          -          -          -           -          -
Mich.                   9          4         898      1,071        292        271           -          -          -          1           1         10
Wis.                    -          5          26        143          1        338           U          -          U          -           -          1

W.N. CENTRAL           61         63         478      1,007        278        247           -          -          -          -           -          -
Minn.                  19         48          45         83         30         24           U          -          U          -           -          -
Iowa                   14          2          91        362        106         42           -          -          -          -           -          -
Mo.                    20          8         260        447        108        147           -          -          -          -           -          -
N. Dak.                 -          -           1          3          -          4           U          -          U          -           -          -
S. Dak.                 1          -           8         18          1          1           -          -          -          -           -          -
Nebr.                   3          -          40         19         11         11           -          -          -          -           -          -
Kans.                   4          5          33         75         22         18           -          -          -          -           -          -

S. ATLANTIC           175        130       1,185      1,063        714        565           -          1          1          4           5          7
Del.                    -          -           2          3          -          -           -          -          -          -           -          1
Md.                    46         43         220        246        103         90           U          -          U          -           -          1
D.C.                    4          -          37         35         14          8           U          -          U          -           -          -
Va.                    13         13          99        145         58         61           -          1          -          2           3          2
W. Va.                  6          5          25          1         16          4           -          -          -          -           -          -
N.C.                   25         20          90         66        142        126           -          -          -          -           -          -
S.C.                    3          3          25         18         40         23           -          -          -          -           -          -
Ga.                    45         26         300        317         96        115           -          -          -          -           -          2
Fla.                   33         20         387        232        245        138           -          -          1          2           2          1

E.S. CENTRAL           52         42         275        264        297        303           -          -          -          -           -          2
Ky.                     6          7          54         19         34         28           -          -          -          -           -          -
Tenn.                  30         23         133        153        154        170           -          -          -          -           -          1
Ala.                   14         10          39         48         51         43           -          -          -          -           -          1
Miss.                   2          2          49         44         58         62           -          -          -          -           -          -

W.S. CENTRAL           39         35       1,557      2,410        374      1,285           -          4          -          3           7          -
Ark.                    2          -          32         60         31         60           -          -          -          -           -          -
La.                     7         16          59         45         72         62           U          -          U          -           -          -
Okla.                  26         17         311        350         86         52           -          -          -          -           -          -
Tex.                    4          2       1,155      1,955        185      1,111           -          4          -          3           7          -

MOUNTAIN               67         84         858      2,085        395        524           -          2          -          -           2          -
Mont.                   1          -          14         67         16          4           -          -          -          -           -          -
Idaho                   1          -          27        168         16         20           -          -          -          -           -          -
Wyo.                    1          1           4         25          9          3           -          -          -          -           -          -
Colo.                  10         17         151        160         53         64           -          -          -          -           -          -
N. Mex.                17          4          31         97        138        203           -          -          -          -           -          -
Ariz.                  30         42         516      1,296        106        128           -          1          -          -           1          -
Utah                    5          3          32        129         22         45           -          1          -          -           1          -
Nev.                    2         17          83        143         35         57           U          -          U          -           -          -

PACIFIC                75         81       2,200      3,493        904      1,097           -         20          -          3          23          7
Wash.                   3          6         196        693         39         60           -          -          -          -           -          1
Oreg.                  30         33         153        271         56        114           -          8          -          -           8          -
Calif.                 33         34       1,838      2,481        790        907           -         11          -          3          14          6
Alaska                  5          1           4         14         12          8           -          -          -          -           -          -
Hawaii                  4          7           9         34          7          8           -          1          -          -           1          -

Guam                    -          -           2          1          2          2           U          1          U          -           1          -
P.R.                    1          2         107         35         97        156           -          -          -          -           -          -
V.I.                    U          U           U          U          U          U           U          U          U          U           U          U
Amer. Samoa             U          U           U          U          U          U           U          U          U          U           U          U
C.N.M.I.                -          -           -          1          -         43           U          -          U          -           -          -
-----------------------------------------------------------------------------------------------------------------------------------------------------
N: Not notifiable    U: Unavailable     -: no reported cases

 * For imported measles, cases include only those resulting from importation from other countries.
** Of 149 cases among children aged <5 years, serotype was reported for 69 and of those, 16 were type b.
=======================================================================================================================================================

TABLE III. (page 2) Provisional cases of selected notifiable diseases preventable by vaccination, United
States, weeks ending August 7, 1999, and August 8, 1998 (31st Week)

                     Meningococcal
                        Disease                      Mumps                           Pertussis                          Rubella
                   -----------------        --------------------------       ---------------------------       ---------------------------
                     Cum.       Cum.                   Cum.       Cum.                   Cum.       Cum.                  Cum.        Cum.
Reporting Area       1999       1998        1999       1999       1998       1999        1999       1998       1999       1999        1998
------------------------------------------------------------------------------------------------------------------------------------------
UNITED STATES       1,565      1,752           2        208        446         74       3,043      3,180          2        161         315

NEW ENGLAND            84         77           -          4          3          3         336        582          -          7          38
Maine                   5          5           -          -          -          -           -          5          -          -           -
N.H.                   12          9           -          1          -          -          54         43          -          -           -
Vt.                     4          1           -          1          -          2          31         57          -          -           -
Mass.                  47         34           -          2          2          -         222        445          -          7           8
R.I.                    4          3           -          -          -          1          18          5          -          -           1
Conn.                  12         25           -          -          1          -          11         27          -          -          29

MID. ATLANTIC         140        185           -         25        170          4         610        336          -         21         142
Upstate N.Y.           38         48           -          6          2          4         524        167          -         17         113
N.Y. City              32         22           -          3        153          -          10         21          -          -          15
N.J.                   37         42           -          -          6          -          12         10          -          1          13
Pa.                    33         73           -         16          9          -          64        138          -          3           1

E.N. CENTRAL          250        275           2         26         57         12         269        358          -          2           -
Ohio                  106         97           2         10         21          7         136         96          -          -           -
Ind.                   43         49           -          3          5          3          32         69          -          1           -
Ill.                   67         74           -          6          9          2          46         39          -          1           -
Mich.                  33         32           -          7         20          -          28         40          -          -           -
Wis.                    1         23           U          -          2          U          27        114          U          -           -

W.N. CENTRAL          171        152           -         10         21          7         128        252          2         82          31
Minn.                  34         25           U          1         10          U          38        149          U          -           -
Iowa                   32         25           -          4          7          4          31         54          2         32           -
Mo.                    65         57           -          2          3          3          34         16          -          2           2
N. Dak.                 3          2           U          -          1          U           -          3          U          -           -
S. Dak.                10          6           -          -          -          -           5          6          -          -           -
Nebr.                   9         11           -          -          -          -           1          8          -         48           -
Kans.                  18         26           -          3          -          -          19         16          -          -          29

S. ATLANTIC           265        291           -         36         28         32         215        166          -         22           9
Del.                    4          1           -          -          -          1           1          2          -          -           -
Md.                    39         24           U          3          -          U          51         28          U          1           -
D.C.                    1          -           U          2          -          U           -          1          U          -           -
Va.                    32         24           -          8          5          -          13          8          -          -           -
W. Va.                  4         12           -          -          -          -           1          1          -          -           -
N.C.                   30         44           -          8          9          5          58         65          -         21           6
S.C.                   31         44           -          3          4          -           8         22          -          -           -
Ga.                    47         65           -          2          1          -          20         10          -          -           -
Fla.                   77         77           -         10          9         26          63         29          -          -           3

E.S. CENTRAL          121        122           -          8         11          -          58         72          -          1           -
Ky.                    30         20           -          -          -          -          15         28          -          -           -
Tenn.                  45         45           -          -          1          -          27         23          -          -           -
Ala.                   27         35           -          7          6          -          12         18          -          1           -
Miss.                  19         22           -          1          4          -           4          3          -          -           -

W.S. CENTRAL          136        196           -         26         37          3          95        208          -          7          80
Ark.                   28         25           -          -          -          1          11         25          -          -           -
La.                    34         38           U          3          5          U           3          2          U          -           -
Okla.                  24         28           -          1          -          -          12         20          -          -           -
Tex.                   50        105           -         22         32          2          69        161          -          7          80

MOUNTAIN              100         97           -         12         27          7         299        591          -         15           5
Mont.                   2          3           -          -          -          -           2          3          -          -           -
Idaho                   8          6           -          1          3          -          93        166          -          -           -
Wyo.                    3          4           -          -          1          -           2          8          -          -           -
Colo.                  26         18           -          3          5          4          72        151          -          -           -
N. Mex.                13         17           N          N          N          2          55         74          -          -           1
Ariz.                  29         34           -          -          5          -          29        130          -         13           1
Utah                   13         10           -          5          3          1          43         35          -          1           2
Nev.                    6          5           U          3         10          U           3         24          U          1           1

PACIFIC               298        357           -         61         92          6       1,033        615          -          4          10
Wash.                  47         50           -          2          7          5         527        192          -          -           5
Oreg.                  53         60           N          N          N          -          24         40          -          -           -
Calif.                188        241           -         51         66          -         468        368          -          4           3
Alaska                  5          2           -          1          2          1           4          4          -          -           -
Hawaii                  5          4           -          7         17          -          10         11          -          -           2

Guam                    1          2           U          1          2          U           1          -          U          -           -
P.R.                    5          8           -          -          2          -          15          3          -          -           -
V.I.                    U          U           U          U          U          U           U          U          U          U           U
Amer. Samoa             U          U           U          U          U          U           U          U          U          U           U
C.N.M.I.                -          -           U          -          2          U           -          1          U          -           -

------------------------------------------------------------------------------------------------------------------------------------------
N: Not notifiable    U: Unavailable     -: no reported cases

=======================================================================================================================================================


Return to top.

Table IV
Note: To print large tables and graphs users may have to change their printer settings to landscape and use a small font size.
TABLE IV. Deaths in 122 U.S. cities,* week ending
August 7, 1999 (31st Week)
===================================================================================================================================
                                                 All Causes, By Age (Years)
                          ------------------------------------------------------------------------        P&I**
Reporting Area            All Ages         >=65        45-64       25-44         1-24           <1        Total
---------------------------------------------------------------------------------------------------------------
NEW ENGLAND                    544          393          100          36            9            6           48
Boston, Mass.                  140          101           28           8            -            3           12
Bridgeport, Conn.               40           24            9           6            1            -            -
Cambridge, Mass.                11            9            2           -            -            -            1
Fall River, Mass.               28           25            2           1            -            -            2
Hartford, Conn.                 41           28            8           3            1            1            1
Lowell, Mass.                   17           13            2           2            -            -            3
Lynn, Mass.                      9            6            2           1            -            -            -
New Bedford, Mass.              20           17            2           1            -            -            -
New Haven, Conn.                32           19           10           1            2            -            1
Providence, R.I.                74           53           11           6            3            1           11
Somerville, Mass.                4            4            -           -            -            -            -
Springfield, Mass.              47           34            7           4            2            -            2
Waterbury, Conn.                20           15            4           1            -            -            3
Worcester, Mass.                61           45           13           2            -            1           12

MID. ATLANTIC                2,289        1,570          432         185           55           47           74
Albany, N.Y.                    54           42            8           4            -            -            3
Allentown, Pa.                   U            U            U           U            U            U            U
Buffalo, N.Y.                  101           73           16           9            2            1            1
Camden, N.J.                    37           25            8           3            -            1            4
Elizabeth, N.J.                  9            8            -           1            -            -            -
Erie, Pa.                       33           27            2           3            1            -            1
Jersey City, N.J.               43           32            6           3            -            2            -
New York City, N.Y.          1,192          824          222         100           26           20           22
Newark, N.J.                    58           26           20           6            4            2            -
Paterson, N.J.                  16            8            3           3            1            1            -
Philadelphia, Pa.              396          246           92          28           14           16           18
Pittsburgh, Pa.***              45           34            8           2            -            1            1
Reading, Pa.                    30           23            2           2            2            1            -
Rochester, N.Y.                111           83           19           6            2            1            6
Schenectady, N.Y.                U            U            U           U            U            U            U
Scranton, Pa.                   31           23            4           4            -            -            1
Syracuse, N.Y.                  84           58           16           8            2            -           11
Trenton, N.J.                   29           21            3           3            1            1            6
Utica, N.Y.                     20           17            3           -            -            -            -
Yonkers, N.Y.                    U            U            U           U            U            U            U

E.N. CENTRAL                 1,851        1,280          343         123           51           53           98
Akron, Ohio                     45           29            6           3            5            2            -
Canton, Ohio                    33           23            7           2            1            -            3
Chicago, Ill.                  385          222           92          40           17           13           26
Cincinnati, Ohio                88           64           16           4            1            3            5
Cleveland, Ohio                128           80           32          10            4            2            -
Columbus, Ohio                 188          128           42           9            4            5           13
Dayton, Ohio                   118           89           19           9            1            -            3
Detroit, Mich.                   U            U            U           U            U            U            U
Evansville, Ind.                44           33            6           4            1            -            2
Fort Wayne, Ind.                64           50            6           3            2            3            3
Gary, Ind.                      26           14            8           2            1            1            -
Grand Rapids, Mich.             66           48           11           3            -            4            5
Indianapolis, Ind.             274          196           41          22            4           11           14
Lansing, Mich.                  39           29           10           -            -            -            4
Milwaukee, Wis.                110           90           12           2            3            3            9
Peoria, Ill.                    35           28            1           4            2            -            3
Rockford, Ill.                  46           33            8           2            2            1            1
South Bend, Ind.                 U            U            U           U            U            U            U
Toledo, Ohio                    99           77           13           4            2            3            6
Youngstown, Ohio                63           47           13           -            1            2            1

W.N. CENTRAL                   648          458          112          43           20           15           36
Des Moines, Iowa                60           46           10           2            2            -            5
Duluth, Minn.                   21           15            2           1            2            1            -
Kansas City, Kans.               U            U            U           U            U            U            U
Kansas City, Mo.               100           70           20           5            2            3            3
Lincoln, Nebr.                  38           29            7           1            1            -            1
Minneapolis, Minn.             172          134           23           8            2            5           20
Omaha, Nebr.                    88           63           19           4            2            -            2
St. Louis, Mo.                 112           60           20          17            9            6            -
St. Paul, Minn.                 57           41           11           5            -            -            5
Wichita, Kans.                   U            U            U           U            U            U            U

S. ATLANTIC                    752          479          161          73           28            9           41
Atlanta, Ga.                     U            U            U           U            U            U            U
Baltimore, Md.                 162           94           36          19           11            -            4
Charlotte, N.C.                 91           62           15           9            5            -           10
Jacksonville, Fla.             133           90           25          16            1            1           10
Miami, Fla.                     85           56           17           8            2            2            1
Norfolk, Va.                    49           30           12           4            1            2            1
Richmond, Va.                   42           29            7           4            1            1            2
Savannah, Ga.                    1            -            1           -            -            -            1
St. Petersburg, Fla.             U            U            U           U            U            U            U
Tampa, Fla.                    132           90           29           7            5            1           10
Washington, D.C.                44           19           15           6            2            2            2
Wilmington, Del.                13            9            4           -            -            -            -

E.S. CENTRAL                   799          522          161          70           28           17           65
Birmingham, Ala.               155           97           30          15            7            5           10
Chattanooga, Tenn.              62           45            8           6            2            1            3
Knoxville, Tenn.                59           35           13           5            5            1           10
Lexington, Ky.                  46           26           17           3            -            -            1
Memphis, Tenn.                 207          141           35          18            6            7           16
Mobile, Ala.                    73           51           11           8            3            -            -
Montgomery, Ala.                77           56           14           5            -            2            9
Nashville, Tenn.               120           71           33          10            5            1           16

W.S. CENTRAL                 1,429          895          311         140           49           34           82
Austin, Tex.                   105           67           23           6            6            3            6
Baton Rouge, La.                 1            1            -           -            -            -            -
Corpus Christi, Tex.            45           31            9           3            2            -            2
Dallas, Tex.                   192          118           40          24            5            5            5
El Paso, Tex.                   54           39            9           5            1            -            1
Ft. Worth, Tex.                 94           63           15           8            1            7            3
Houston, Tex.                  469          272          107          61           21            8           29
Little Rock, Ark.               63           37           15           7            2            2            2
New Orleans, La.                70           45           12           9            2            2            5
San Antonio, Tex.              158          111           35           8            3            1           19
Shreveport, La.                 73           41           25           3            2            2            8
Tulsa, Okla.                   105           70           21           6            4            4            2

MOUNTAIN                       801          537          146          79           23           15           36
Albuquerque, N.M.               83           63            9           8            2            1            4
Boise, Idaho                    44           27           10           3            2            1            3
Colo. Springs, Colo.            46           29            6           8            1            2            3
Denver, Colo.                  102           66           17          13            4            2            4
Las Vegas, Nev.                187          113           48          17            7            2            9
Ogden, Utah                     21           17            3           1            -            -            2
Phoenix, Ariz.                  71           45           15           7            2            2            2
Pueblo, Colo.                   25           15            8           1            1            -            2
Salt Lake City, Utah           100           72           14           8            3            3            5
Tucson, Ariz.                  122           90           16          13            1            2            2

PACIFIC                      1,438        1,011          268         100           20           37           95
Berkeley, Calif.                15           12            1           1            -            1            1
Fresno, Calif.                 101           64           23          10            4            -            7
Glendale, Calif.                14           11            3           -            -            -            2
Honolulu, Hawaii                70           58            5           3            -            4            7
Long Beach, Calif.              70           53           15           1            1            -           11
Los Angeles, Calif.            309          221           49          24            7            8           11
Pasadena, Calif.                25           20            5           -            -            -            2
Portland, Oreg.                 92           68           12           6            3            3            8
Sacramento, Calif.               U            U            U           U            U            U            U
San Diego, Calif.              148           88           35          18            1            4           13
San Francisco, Calif.          137           93           32           8            -            4           16
San Jose, Calif.               151          101           34          11            1            4            6
Santa Cruz, Calif.              26           22            1           2            -            1            2
Seattle, Wash.                 134           93           28           7            1            5            2
Spokane, Wash.                  57           43            8           2            2            2            6
Tacoma, Wash.                   89           64           17           7            -            1            1

TOTAL                   10,551****        7,145        2,034         849          283          233          575

---------------------------------------------------------------------------------------------------------------
U: Unavailable    -: no reported cases

   * Mortality data in this table are voluntarily reported from 122 cities in the United States, most of which have populations
     of 100,000 or more. A death is reported by the place of its occurrence and by the week that the death certificate was
     filed. Fetal deaths are not included.
  ** Pneumonia and influenza.
 *** Because of changes in reporting methods in this Pennsylvania city, these numbers are partial counts for the current
     week. Complete counts will be available in 4 to 6 weeks.
**** Total includes unknown ages.
===================================================================================================================================


Return to top.

Disclaimer   All MMWR HTML versions of articles are electronic conversions from ASCII text into HTML. This conversion may have resulted in character translation or format errors in the HTML version. Users should not rely on this HTML document, but are referred to the electronic PDF version and/or the original MMWR paper copy for the official text, figures, and tables. An original paper copy of this issue can be obtained from the Superintendent of Documents, U.S. Government Printing Office (GPO), Washington, DC 20402-9371; telephone: (202) 512-1800. Contact GPO for current prices.

**Questions or messages regarding errors in formatting should be addressed to mmwrq@cdc.gov.

Page converted: 08/11/99

HOME  |  ABOUT MMWR  |  MMWR SEARCH  |  DOWNLOADS  |  RSSCONTACT
POLICY  |  DISCLAIMER  |  ACCESSIBILITY

Safer, Healthier People

Morbidity and Mortality Weekly Report
Centers for Disease Control and Prevention
1600 Clifton Rd, MailStop E-90, Atlanta, GA 30333, U.S.A

USA.GovDHHS

Department of Health
and Human Services

This page last reviewed 5/2/01