 |
|
|
|
|
|
|
| ||||||||||
|
|
|
|
|
|
|
||||
| ||||||||||
|
|
|
|
|
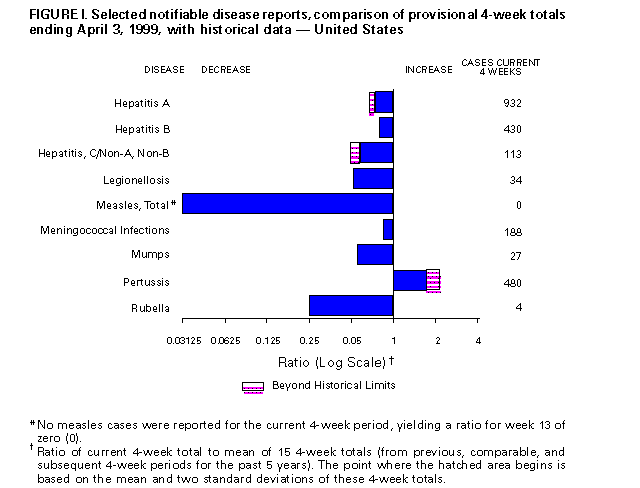
Persons using assistive technology might not be able to fully access information in this file. For assistance, please send e-mail to: mmwrq@cdc.gov. Type 508 Accommodation and the title of the report in the subject line of e-mail. Notifiable Diseases/Deaths in Selected Cities Weekly InformationFigure_I Selected notifiable disease reports, comparison of provisional 4-week totals ending April 3, 1999, with historical data -- United States Table_I Summary -- provisional cases of selected notifiable diseases, United States, cumulative, week ending April 3, 1999 (13th Week) Table_II Provisional cases of selected notifiable diseases, United States, weeks ending April 3, 1999 and April 4, 1998 (13th Week) Table_III Provisional cases of selected notifiable diseases preventable by vaccination, United States, weeks ending April 3, 1999 and April 4, 1998 (13th Week) Table_IV Deaths in 122 U.S. cities, week ending
April 3, 1999 (13th Week)
TABLE I. Summary -- provisional cases of specified notifiable diseases, United
States, cumulative, week ending April 3, 1999 (13th Week)
==================================================================================
                                             Cum. 1999
------------------------------------------------------
Anthrax                                              -
Brucellosis                                         11
Cholera                                              -
Congenital rubella syndrome                          1
Cryptosporidiosis*                                 246
Diphtheria                                           -
Encephalitis:  California*                           1
               eastern equine*                       -
               St. Louis*                            -
               western equine*                       -
Hansen Disease                                      13
Hantavirus pulmonary syndrome*+                      2
Hemolytic uremic syndrome, post-diarrheal*           6
HIV infection, pediatric*&                          37
Plague                                               -
Poliomyelitis, paralytic                             -
Psittacosis                                          8
Rabies, human                                        -
Rocky Mountain spotted fever (RMSF)                 34
Streptococcal disease, invasive Group A            482
Streptococcal toxic-shock syndrome*                 11
Syphilis, congenital@                                7
Tetanus                                              5
Toxic-shock syndrome                                27
Trichinosis                                          3
Typhoid fever                                       63
Yellow fever                                         -
------------------------------------------------------
-: no reported cases
 * Not notifiable in all states
 + Updated weekly from reports to the Division of Viral and Rickettsial
   Diseases, National Center for Infectious Diseases (NCID).
 & Updated monthly from reports to the Division of HIV/AIDS Prevention --
   Surveillance and Epidemiology, National Center for HIV, STD, and TB
   Prevention (NCHSTP), last update March 28, 1999.
 @ Updated from reports to the Division of STD Prevention, NCHSTP.

==================================================================================
Return to top. Table_II Note: To print large tables and graphs users may have to change their printer settings to landscape and use a small font size.
TABLE II. (page 1) Provisional cases of selected notifiable diseases, United States, weeks ending
April 3, 1999, and April 4, 1998 (13th Week)
Escherichia
coli O157:H7
------------------- Hepatitis
AIDS Chlamydia NETSS** PHLIS*** Gonorrhea C/NA,NB
----------------- -------------------- -------- -------- ------------------- ----------------
Cum. Cum. Cum. Cum. Cum. Cum. Cum. Cum. Cum. Cum.
Reporting Area 1999* 1998 1999 1998 1999 1999 1999 1998 1999 1998
------------------------------------------------------------------------------------------------------------------------------
UNITED STATES 11,513 11,980 126,640 140,665 279 117 69,551 83,392 557 914
NEW ENGLAND 542 314 4,810 5,301 42 27 1,604 1,454 46 23
Maine 5 8 153 219 4 - 10 11 - -
N.H. 18 12 244 259 2 1 19 26 - -
Vt. 4 8 117 86 3 - 14 2 1 2
Mass. 367 92 2,333 2,128 19 16 721 530 45 21
R.I. 30 34 547 626 1 1 141 81 - -
Conn. 118 160 1,416 1,983 13 9 699 804 - -
MID. ATLANTIC 2,841 3,417 17,838 17,030 15 1 9,152 9,834 44 98
Upstate N.Y. 360 426 N N 12 - 867 1,712 29 83
N.Y. City 1,441 1,933 9,437 8,925 - 1 4,282 4,074 - -
N.J. 600 574 2,472 2,944 3 - 1,176 1,774 - -
Pa. 440 484 5,928 5,161 N - 2,827 2,274 15 15
E.N. CENTRAL 841 993 19,178 21,431 45 25 12,962 16,226 111 121
Ohio 147 173 5,924 6,813 23 8 3,483 4,099 - 5
Ind. 124 257 - - 5 7 726 1,561 - 2
Ill. 402 373 6,821 5,786 6 3 4,435 4,934 2 16
Mich. 124 144 5,418 5,392 11 4 3,886 4,294 109 98
Wis. 44 46 1,015 3,440 N 3 432 1,338 - -
W.N. CENTRAL 248 207 4,142 8,908 70 15 1,455 3,977 31 22
Minn. 38 31 1,434 1,773 22 12 541 605 - -
Iowa 29 11 396 923 6 2 160 248 - 3
Mo. 97 100 - 3,222 6 1 - 2,039 29 17
N. Dak. 3 3 102 248 2 - 7 26 - -
S. Dak. 6 7 436 421 1 - 39 70 - -
Nebr. 19 24 700 757 26 - 293 304 - 2
Kans. 56 31 1,074 1,564 7 - 415 685 2 -
S. ATLANTIC 3,237 3,186 28,096 28,267 27 10 21,106 22,404 58 32
Del. 40 40 724 621 1 - 427 357 - -
Md. 345 335 1,960 2,006 1 - 2,171 2,308 19 3
D.C. 118 262 N N - - 680 882 - -
Va. 179 230 3,341 3,044 6 2 2,309 1,980 6 1
W. Va. 19 30 594 1,189 - 1 106 394 8 2
N.C. 198 216 5,485 5,752 7 3 4,847 4,763 - 7
S.C. 321 183 5,151 4,405 1 1 2,629 2,847 9 -
Ga. 349 372 3,967 6,427 2 - 2,946 5,113 1 8
Fla. 1,668 1,518 6,874 4,823 9 3 4,991 3,760 15 11
E.S. CENTRAL 493 442 9,598 10,007 18 4 8,267 9,475 27 35
Ky. 70 65 - 1,607 5 - - 918 1 7
Tenn. 214 141 3,590 3,301 9 3 2,793 2,802 25 25
Ala. 110 119 3,545 2,618 4 - 3,188 3,283 1 3
Miss. 99 117 2,463 2,481 - 1 2,286 2,472 - -
W.S. CENTRAL 1,182 1,356 15,363 20,871 7 6 9,206 12,618 37 32
Ark. 45 52 1,361 937 2 2 673 1,133 2 2
La. 121 206 4,266 3,144 1 2 3,562 2,702 25 -
Okla. 35 71 2,059 2,305 3 2 1,086 1,281 1 -
Tex. 981 1,027 7,677 14,485 1 - 3,885 7,502 9 30
MOUNTAIN 405 377 6,910 7,464 16 6 1,801 2,013 49 149
Mont. 4 10 309 223 - - 8 11 4 4
Idaho 5 8 432 468 - 1 26 43 4 56
Wyo. 2 1 180 187 1 1 7 10 14 38
Colo. 76 65 1,902 1,949 5 2 496 645 9 9
N. Mex. 13 52 1,084 1,004 1 - 182 180 4 21
Ariz. 190 127 2,011 2,610 4 1 768 899 11 -
Utah 37 35 399 538 5 1 44 58 1 10
Nev. 78 79 593 485 - - 270 167 2 11
PACIFIC 1,724 1,688 20,705 21,386 39 23 3,998 5,391 154 402
Wash. 90 133 3,121 2,648 5 8 541 470 2 5
Oreg. 45 40 1,325 - 13 9 184 - 4 7
Calif. 1,562 1,481 15,244 17,692 21 6 3,099 4,735 148 355
Alaska 6 11 465 503 - - 96 76 - 1
Hawaii 21 23 550 543 - - 78 110 - 34
Guam 1 - - 77 N - - 6 - -
P.R. 411 457 U U 2 U 77 106 - -
V.I. 10 13 N N N U U U U U
Amer. Samoa - - U U N U U U U U
C.N.M.I. - - N N N U - 8 - -
------------------------------------------------------------------------------------------------------------------------------
N: Not notifiable U: Unavailable -: no reported cases C.N.M.I.: Commonwealth of North Mariana Islands
* Updated monthly from reports to the Division of HIV/AIDS Prevention -- Surveillance and Epidemiology, National Center for HIV,
STD, and TB Prevention, last update March 28, 1999.
** National Electronic Telecommunications System for Surveillance.
*** Public Health Laboratory Information System.
=======================================================================================================================================================
TABLE II. (page 2) Provisional cases of selected notifiable diseases, United States, weeks ending
April 3, 1999, and April 4, 1998 (13th Week)
Lyme Syphilis Rabies,
Legionellosis Disease Malaria (Primary & Secondary) Tuberculosis Animal
---------------- ---------------- ---------------- --------------------- ----------------- -------
Cum. Cum. Cum. Cum. Cum. Cum. Cum. Cum. Cum. Cum. Cum.
Reporting Area 1999 1998 1999 1998 1999 1998 1999 1998 1999 * 1998 * 1999
-------------------------------------------------------------------------------------------------------------------------------------------
UNITED STATES 192 306 833 988 246 280 1,398 1,803 1,083 1,813 1,146
NEW ENGLAND 13 18 146 183 3 12 16 18 77 83 199
Maine 2 1 - 2 - - - 1 3 3 36
N.H. 1 2 - 5 - 1 - 1 - 2 13
Vt. 3 1 - 2 - - 1 - - 1 40
Mass. 3 5 96 42 3 11 10 14 41 42 41
R.I. 1 4 8 15 - - 1 - 15 10 19
Conn. 3 5 42 117 - - 4 2 18 25 50
MID. ATLANTIC 55 67 490 637 67 93 55 66 404 421 249
Upstate N.Y. 15 16 140 296 21 21 5 7 41 54 163
N.Y. City 4 16 3 17 15 49 28 9 246 259 U
N.J. 5 3 97 74 21 14 2 22 117 108 51
Pa. 31 32 250 250 10 9 20 28 U U 35
E.N. CENTRAL 42 123 19 19 17 21 242 258 55 74 3
Ohio 18 42 13 14 4 1 24 49 U U 2
Ind. 5 25 5 4 4 1 32 41 U U -
Ill. 2 17 - - - 11 159 111 U U -
Mich. 16 17 1 1 7 7 27 38 48 49 1
Wis. 1 22 U U 2 1 - 19 7 25 -
W.N. CENTRAL 8 18 13 9 12 12 6 50 98 84 133
Minn. - 1 6 1 2 4 1 3 42 26 25
Iowa 6 2 2 6 3 2 1 - - - 24
Mo. 1 7 - 1 6 5 - 36 43 39 5
N. Dak. - - 1 - - - - - 1 1 30
S. Dak. 1 - - - - - - - 3 4 25
Nebr. - 7 - - - - 1 4 4 - 1
Kans. - 1 4 1 1 1 3 7 5 14 23
S. ATLANTIC 32 34 106 101 69 56 520 697 172 355 416
Del. 2 6 - 2 - 1 1 6 - 5 -
Md. 5 8 83 86 20 22 117 186 U U 87
D.C. - 2 1 4 6 3 10 23 10 27 -
Va. 5 3 2 2 11 6 41 52 17 53 98
W. Va. N N 2 1 1 - 2 - 11 17 22
N.C. 5 4 14 1 5 6 130 207 78 175 97
S.C. 5 4 1 - - - 62 85 56 78 27
Ga. - - - 2 5 12 78 64 U U 46
Fla. 10 7 3 3 21 6 79 74 U U 39
E.S. CENTRAL 8 11 13 11 3 8 247 319 79 145 60
Ky. 2 5 - 1 - - - 34 U U 13
Tenn. 5 3 5 5 2 4 132 160 U U 22
Ala. 1 1 6 5 1 2 78 69 73 93 25
Miss. - 2 2 - - 2 37 56 6 52 -
W.S. CENTRAL 1 2 - 1 5 5 232 231 51 498 19
Ark. - - - 1 - 1 25 30 28 22 -
La. 1 - - - 3 3 61 87 U U -
Okla. - - - - 1 - 61 12 23 28 19
Tex. - 2 - - 1 1 85 102 - 448 -
MOUNTAIN 14 15 3 1 12 15 34 73 38 56 34
Mont. - 1 - - 2 - - - - 2 15
Idaho - - - - 1 1 - - - 2 -
Wyo. - 1 1 - - - - - - 1 8
Colo. 1 4 - - 4 4 - 4 U U 1
N. Mex. 1 1 1 - 2 5 - 7 13 12 -
Ariz. 1 1 - - 3 2 32 57 U U 10
Utah 5 6 1 - - 1 1 2 11 11 -
Nev. 6 1 - 1 - 2 1 3 14 28 -
PACIFIC 19 18 43 26 58 58 46 91 109 97 33
Wash. 2 1 - 1 3 1 11 4 58 45 -
Oreg. - - 1 1 7 6 - - U U -
Calif. 17 17 42 24 44 51 33 87 U U 30
Alaska - - - - - - 1 - 10 11 3
Hawaii - - - - 4 - 1 - 41 41 -
Guam - 1 - - - 1 - - - 37 -
P.R. - - - - - - 59 59 - 30 16
V.I. U U U U U U U U U U U
Amer. Samoa U U U U U U U U U U U
C.N.M.I. - - - - - - - 59 - 32 -
-------------------------------------------------------------------------------------------------------------------------------------------
N: Not notifiable U: Unavailable -: no reported cases
* Cumulative reports of provisional tuberculosis cases for 1998 and 1999 are unavailable ('U') for some areas using the Tuberculosis
Information Management System (TIMS).
=======================================================================================================================================================
Return to top. Table_III Note: To print large tables and graphs users may have to change their printer settings to landscape and use a small font size.
TABLE III. (page 1) Provisional cases of selected notifiable diseases preventable by vaccination, United
States, weeks ending April 3, 1999, and April 4, 1998 (13th Week)
Hepatitis (Viral), by type Measles (Rubeola)
H. influenzae, --------------------------------------- ------------------------------------------------------------
invasive A B Indigenous Imported** Total
---------------- ----------------- ----------------- --------------- --------------- ---------------
Cum. Cum. Cum. Cum. Cum. Cum. Cum. Cum. Cum. Cum.
Reporting Area 1999* 1998 1999 1998 1999 1998 1999 1999 1999 1999 1999 1998
-----------------------------------------------------------------------------------------------------------------------------------------------------
UNITED STATES 290 309 3,585 4,872 1,399 2,059 - 10 - 9 19 11
NEW ENGLAND 22 22 36 88 22 34 - - - 1 1 1
Maine 2 2 2 9 - - - - - - - -
N.H. 3 1 5 5 2 4 - - - 1 1 -
Vt. 3 2 1 4 1 - - - - - - -
Mass. 11 17 11 25 17 18 - - - - - 1
R.I. - - - 5 2 1 - - - - - -
Conn. 3 - 17 40 - 11 - - - - - -
MID. ATLANTIC 36 44 212 416 179 316 - - - - - 2
Upstate N.Y. 22 17 64 92 44 78 - - - - - -
N.Y. City 2 13 33 151 35 81 - - - - - -
N.J. 12 13 36 78 27 59 - - - - - 1
Pa. - 1 79 95 73 98 - - - - - 1
E.N. CENTRAL 29 46 851 809 121 445 - - - - - 1
Ohio 19 21 212 99 29 22 - - - - - -
Ind. 1 5 29 87 4 214 - - - - - -
Ill. 8 19 89 210 - 62 - - - - - -
Mich. 1 - 519 338 88 123 - - - - - 1
Wis. - 1 2 75 - 24 - - - - - -
W.N. CENTRAL 29 10 186 470 77 101 - - - - - -
Minn. 10 4 11 15 11 6 - - - - - -
Iowa 5 1 32 208 13 13 - - - - - -
Mo. 10 1 110 193 45 68 - - - - - -
N. Dak. - - - 2 - 1 - - - - - -
S. Dak. 1 - 8 2 - 1 - - - - - -
Nebr. 1 - 14 12 6 4 - - - - - -
Kans. 2 4 11 38 2 8 - - - - - -
S. ATLANTIC 74 60 455 420 262 232 - - - - - 5
Del. - - 1 - - - - - - - - -
Md. 22 14 99 100 45 41 - - - - - 1
D.C. 2 - 16 15 6 3 - - - - - -
Va. 8 9 33 72 24 25 - - - - - 2
W. Va. 1 2 3 - 4 1 - - - - - -
N.C. 12 8 41 27 54 64 - - - - - -
S.C. 2 1 5 8 26 - - - - - - -
Ga. 15 17 110 109 33 57 - - - - - 1
Fla. 12 9 147 89 70 41 - - - - - 1
E.S. CENTRAL 23 21 102 121 87 126 - - - - - -
Ky. 2 5 6 5 7 9 U - U - - -
Tenn. 12 10 70 66 55 94 - - - - - -
Ala. 8 5 24 30 25 23 - - - - - -
Miss. 1 1 2 20 - - - - - - - -
W.S. CENTRAL 16 17 299 303 93 134 - - - 2 2 -
Ark. - - 9 11 10 23 - - - - - -
La. 3 7 13 8 19 10 - - - - - -
Okla. 11 8 118 113 27 14 - - - - - -
Tex. 2 2 159 171 37 87 - - - 2 2 -
MOUNTAIN 36 55 372 844 134 207 - 1 - - 1 -
Mont. 1 - 4 7 5 2 - - - - - -
Idaho 1 - 11 53 7 9 - - - - - -
Wyo. 1 - 1 12 - 2 U - U - - -
Colo. 2 11 80 69 28 27 - 1 - - 1 -
N. Mex. 10 - 9 46 43 84 - - - - - -
Ariz. 18 30 210 545 24 47 - - - - - -
Utah 3 3 16 46 8 17 - - - - - -
Nev. - 11 41 66 19 19 - - - - - -
PACIFIC 25 34 1,072 1,401 424 464 - 9 - 6 15 2
Wash. - 1 74 145 9 33 - - - - - -
Oreg. 11 19 66 119 21 49 - 8 - - 8 -
Calif. 12 11 929 1,114 383 375 - 1 - 6 7 2
Alaska 2 1 2 2 7 2 - - - - - -
Hawaii - 2 1 21 4 5 - - - - - -
Guam - - - - - - U - U - - -
P.R. - 1 21 13 31 154 - - - - - -
V.I. U U U U U U U U U U U U
Amer. Samoa U U U U U U U U U U U U
C.N.M.I. - - - - - 24 U - U - - -
-----------------------------------------------------------------------------------------------------------------------------------------------------
N: Not notifiable U: Unavailable -: no reported cases
* Of 56 cases among children aged <5 years, serotype was reported for 24 and of those, 4 were type b.
** For imported measles, cases include only those resulting from importation from other countries.
=======================================================================================================================================================
TABLE III. (page 2) Provisional cases of selected notifiable diseases preventable by vaccination, United
States, weeks ending April 3, 1999, and April 4, 1998 (13th Week)
Meningococcal
Disease Mumps Pertussis Rubella
----------------- -------------------------- --------------------------- ---------------------------
Cum. Cum. Cum. Cum. Cum. Cum. Cum. Cum.
Reporting Area 1999 1998 1999 1999 1998 1999 1999 1998 1999 1999 1998
------------------------------------------------------------------------------------------------------------------------------------------
UNITED STATES 667 860 3 94 116 181 1,180 1,093 1 9 126
NEW ENGLAND 34 48 - 1 - 1 118 218 - 2 21
Maine 3 4 - - - - - 4 - - -
N.H. - 1 - 1 - 1 19 18 - - -
Vt. 2 1 - - - - 10 25 - - -
Mass. 24 20 - - - - 83 166 - 2 1
R.I. 2 3 - - - - 2 - - - -
Conn. 3 19 - - - - 4 5 - - 20
MID. ATLANTIC 65 91 - 14 10 127 298 147 - - 70
Upstate N.Y. 13 24 - 2 2 125 256 78 - - 65
N.Y. City 18 10 - 3 5 - 10 6 - - 1
N.J. 15 21 - - - - - 6 - - 4
Pa. 19 36 - 9 3 2 32 57 - - -
E.N. CENTRAL 96 139 2 12 18 8 106 128 - - -
Ohio 47 51 - 6 9 6 89 36 - - -
Ind. 7 24 - - - - 2 34 - - -
Ill. 28 34 - - - - - 5 - - -
Mich. 14 13 2 6 9 2 15 15 - - -
Wis. - 17 - - - - - 38 - - -
W.N. CENTRAL 87 70 - 2 10 1 16 78 - - 2
Minn. 25 5 - - 4 - - 41 - - -
Iowa 18 11 - 2 4 - 7 15 - - -
Mo. 30 31 - - 1 1 7 11 - - 1
N. Dak. - - - - 1 - - - - - -
S. Dak. 5 5 - - - - 2 2 - - -
Nebr. 2 3 - - - - - 3 - - -
Kans. 7 15 - - - - - 6 - - 1
S. ATLANTIC 118 126 - 17 14 2 74 82 - 2 1
Del. 2 1 - - - - - - - - -
Md. 18 15 - 3 - 1 23 16 - 1 -
D.C. 1 - - 1 - - - - - - -
Va. 16 15 - 2 3 - 7 6 - - -
W. Va. 1 4 - - - - - 1 - - -
N.C. 14 19 - 3 6 - 22 38 - 1 1
S.C. 15 15 - 2 3 - 6 6 - - -
Ga. 16 34 - - - 1 7 - - - -
Fla. 35 23 - 6 2 - 9 15 - - -
E.S. CENTRAL 48 73 - 1 1 - 17 16 - - -
Ky. 10 13 U - - U 1 2 U - -
Tenn. 20 25 - - - - 12 5 - - -
Ala. 13 25 - 1 1 - 4 9 - - -
Miss. 5 10 - - - - - - - - -
W.S. CENTRAL 28 53 1 12 21 1 28 50 - 4 25
Ark. 11 9 - - - 1 5 5 - - -
La. 7 16 - - - - - - - - -
Okla. 8 17 - 1 - - 2 6 - - -
Tex. 2 11 1 11 21 - 21 39 - 4 25
MOUNTAIN 56 59 - 7 8 2 158 187 - - 5
Mont. - 2 - - - - 1 1 - - -
Idaho 7 3 - - - - 81 71 - - -
Wyo. 2 3 U - 1 U 1 - U - -
Colo. 17 14 - 2 1 2 23 40 - - -
N. Mex. 7 9 N N N - 10 47 - - 1
Ariz. 17 21 - - 2 - 20 18 - - 1
Utah 4 6 - 4 - - 20 6 - - 2
Nev. 2 1 - 1 4 - 2 4 - - 1
PACIFIC 135 201 - 28 34 39 365 187 1 1 2
Wash. 17 24 - - 4 38 211 71 - - -
Oreg. 21 37 N N N 1 4 11 - - -
Calif. 90 136 - 24 20 - 149 102 1 1 1
Alaska 3 1 - 1 2 - 1 - - - -
Hawaii 4 3 - 3 8 - - 3 - - 1
Guam - - U - 2 U - - U - -
P.R. 2 2 - - 1 - - 2 - - -
V.I. U U U U U U U U U U U
Amer. Samoa U U U U U U U U U U U
C.N.M.I. - - U - 2 U - 1 U - -
------------------------------------------------------------------------------------------------------------------------------------------
N: Not notifiable U: Unavailable -: no reported cases
=======================================================================================================================================================
Return to top. Table_IV Note: To print large tables and graphs users may have to change their printer settings to landscape and use a small font size.
TABLE IV. Deaths in 122 U.S. cities,* week ending
April 3, 1999 (13th Week)
===================================================================================================================================
All Causes, By Age (Years)
------------------------------------------------------------------------ P&I**
Reporting Area All Ages >=65 45-64 25-44 1-24 <1 Total
---------------------------------------------------------------------------------------------------------------
NEW ENGLAND 609 441 89 54 14 11 66
Boston, Mass. 145 87 28 18 5 7 18
Bridgeport, Conn. 38 24 9 4 1 - 7
Cambridge, Mass. 17 13 4 - - - 3
Fall River, Mass. 29 26 3 - - - 3
Hartford, Conn. 51 39 9 3 - - 4
Lowell, Mass. 27 21 3 3 - - 1
Lynn, Mass. 9 4 3 2 - - -
New Bedford, Mass. 29 28 - 1 - - 1
New Haven, Conn. 48 37 6 4 1 - 7
Providence, R.I. 67 52 6 4 3 2 -
Somerville, Mass. 8 6 2 - - - 1
Springfield, Mass. 46 33 3 10 - - 5
Waterbury, Conn. 30 24 3 2 - 1 2
Worcester, Mass. 65 47 10 3 4 1 14
MID. ATLANTIC 2,157 1,499 434 152 32 40 103
Albany, N.Y. 47 33 6 4 1 3 5
Allentown, Pa. 21 16 3 2 - - -
Buffalo, N.Y. U U U U U U U
Camden, N.J. 43 28 9 5 - 1 2
Elizabeth, N.J. 9 6 2 1 - - -
Erie, Pa. 48 36 8 3 - 1 3
Jersey City, N.J. 48 33 10 3 1 1 -
New York City, N.Y. 1,188 780 276 89 21 22 31
Newark, N.J. 44 11 17 8 1 7 3
Paterson, N.J. 12 5 2 5 - - -
Philadelphia, Pa. 299 227 45 19 6 2 20
Pittsburgh, Pa.*** 50 39 6 3 - 2 6
Reading, Pa. 28 23 5 - - - 1
Rochester, N.Y. 112 93 12 6 1 - 11
Schenectady, N.Y. 21 17 4 - - - 1
Scranton, Pa. 46 42 2 2 - - 7
Syracuse, N.Y. 89 69 16 2 1 1 12
Trenton, N.J. 26 19 7 - - - -
Utica, N.Y. 26 22 4 - - - 1
Yonkers, N.Y. U U U U U U U
E.N. CENTRAL 2,322 1,636 412 158 62 51 188
Akron, Ohio 53 38 11 1 2 1 -
Canton, Ohio 44 32 7 4 - 1 4
Chicago, Ill. 465 307 96 38 10 11 36
Cincinnati, Ohio 125 96 19 3 4 3 19
Cleveland, Ohio 120 74 30 10 1 5 5
Columbus, Ohio 203 143 35 17 5 3 22
Dayton, Ohio 151 116 21 9 - 5 18
Detroit, Mich. 225 138 46 23 9 9 7
Evansville, Ind. 48 38 5 2 2 1 2
Fort Wayne, Ind. 88 63 18 5 1 1 3
Gary, Ind. 23 15 3 2 - 3 2
Grand Rapids, Mich. 70 48 15 3 3 1 13
Indianapolis, Ind. 167 111 28 15 9 4 5
Lansing, Mich. 59 47 9 2 - 1 3
Milwaukee, Wis. 127 92 23 6 5 1 18
Peoria, Ill. 54 46 5 1 2 - 8
Rockford, Ill. 66 49 11 4 2 - 10
South Bend, Ind. 58 48 4 5 1 - 4
Toledo, Ohio 97 75 15 3 4 - 5
Youngstown, Ohio 79 60 11 5 2 1 4
W.N. CENTRAL 770 565 125 43 15 22 86
Des Moines, Iowa 134 93 29 7 2 3 23
Duluth, Minn. 26 22 1 1 - 2 7
Kansas City, Kans. U U U U U U U
Kansas City, Mo. 102 77 14 3 4 4 10
Lincoln, Nebr. 50 41 4 1 2 2 8
Minneapolis, Minn. 168 130 26 6 1 5 24
Omaha, Nebr. 95 70 21 4 - - 6
St. Louis, Mo. 116 73 21 14 4 4 1
St. Paul, Minn. 79 59 9 7 2 2 7
Wichita, Kans. U U U U U U U
S. ATLANTIC 1,223 831 249 89 29 23 102
Atlanta, Ga. U U U U U U U
Baltimore, Md. 247 162 52 18 4 10 30
Charlotte, N.C. 83 62 11 6 2 2 12
Jacksonville, Fla. 134 93 22 14 1 3 6
Miami, Fla. 136 80 38 13 5 - 1
Norfolk, Va. 50 35 10 4 1 - 1
Richmond, Va. 70 36 18 10 4 2 4
Savannah, Ga. 97 72 17 7 - 1 8
St. Petersburg, Fla. 87 69 11 5 2 - 9
Tampa, Fla. 209 150 46 6 4 3 27
Washington, D.C. 88 57 17 6 6 2 4
Wilmington, Del. 22 15 7 - - - -
E.S. CENTRAL 950 693 161 61 15 19 101
Birmingham, Ala. 198 148 30 14 4 1 31
Chattanooga, Tenn. 79 63 9 4 3 - 8
Knoxville, Tenn. 94 66 21 6 - 1 5
Lexington, Ky. 82 55 17 5 4 1 12
Memphis, Tenn. 210 163 31 13 2 1 19
Mobile, Ala. 69 45 14 7 - 3 2
Montgomery, Ala. 38 22 12 - 1 3 8
Nashville, Tenn. 180 131 27 12 1 9 16
W.S. CENTRAL 1,559 1,033 304 141 50 29 121
Austin, Tex. 73 50 13 9 1 - 9
Baton Rouge, La. 44 29 10 4 - 1 2
Corpus Christi, Tex. 58 42 9 3 4 - 6
Dallas, Tex. 186 114 45 17 7 3 8
El Paso, Tex. 99 69 17 7 5 1 7
Ft. Worth, Tex. 141 93 33 14 1 - 16
Houston, Tex. 505 317 106 56 16 10 36
Little Rock, Ark. 61 36 15 5 3 - 4
New Orleans, La. U U U U U U U
San Antonio, Tex. 224 165 34 16 6 3 16
Shreveport, La. 82 56 11 7 4 4 11
Tulsa, Okla. 86 62 11 3 3 7 6
MOUNTAIN 952 669 176 63 25 18 76
Albuquerque, N.M. 121 83 22 4 6 6 5
Boise, Idaho 47 36 4 2 3 2 4
Colo. Springs, Colo. 64 48 10 3 - 3 8
Denver, Colo. 112 85 17 9 1 - 11
Las Vegas, Nev. 175 120 37 10 4 3 10
Ogden, Utah 27 20 3 3 1 - 2
Phoenix, Ariz. 76 47 19 6 3 1 2
Pueblo, Colo. 40 32 6 2 - - 7
Salt Lake City, Utah 105 62 24 12 6 1 12
Tucson, Ariz. 185 136 34 12 1 2 15
PACIFIC 1,884 1,391 316 117 24 32 185
Berkeley, Calif. 18 15 2 1 - - 1
Fresno, Calif. 148 120 21 4 2 1 18
Glendale, Calif. 28 24 3 1 - - -
Honolulu, Hawaii 59 45 8 5 - 1 5
Long Beach, Calif. 70 51 11 4 3 1 11
Los Angeles, Calif. 365 264 68 22 4 7 23
Pasadena, Calif. 28 22 4 1 - 1 3
Portland, Oreg. 175 130 27 12 3 3 12
Sacramento, Calif. 222 160 40 10 6 6 42
San Diego, Calif. 131 93 21 12 1 3 15
San Francisco, Calif. 121 86 23 10 - 2 19
San Jose, Calif. 202 148 36 13 - 5 17
Santa Cruz, Calif. 23 20 3 - - - 3
Seattle, Wash. 144 99 27 13 4 1 7
Spokane, Wash. 65 51 9 4 - 1 7
Tacoma, Wash. 85 63 13 5 1 - 2
TOTAL 12,426**** 8,758 2,266 878 266 245 1,028
---------------------------------------------------------------------------------------------------------------
U: Unavailable -: no reported cases
* Mortality data in this table are voluntarily reported from 122 cities in the United States, most of which have populations
of 100,000 or more. A death is reported by the place of its occurrence and by the week that the death certificate was
filed. Fetal deaths are not included.
** Pneumonia and influenza.
*** Because of changes in reporting methods in this Pennsylvania city, these numbers are partial counts for the current
week. Complete counts will be available in 4 to 6 weeks.
**** Total includes unknown ages.
===================================================================================================================================
Return to top. Disclaimer All MMWR HTML versions of articles are electronic conversions from ASCII text into HTML. This conversion may have resulted in character translation or format errors in the HTML version. Users should not rely on this HTML document, but are referred to the electronic PDF version and/or the original MMWR paper copy for the official text, figures, and tables. An original paper copy of this issue can be obtained from the Superintendent of Documents, U.S. Government Printing Office (GPO), Washington, DC 20402-9371; telephone: (202) 512-1800. Contact GPO for current prices. **Questions or messages regarding errors in formatting should be addressed to mmwrq@cdc.gov.Page converted: 04/08/99 |
|||||||||
This page last reviewed 5/2/01
|