 |
|
|
|
|
|
|
| ||||||||||
|
|
|
|
|
|
|
||||
| ||||||||||
|
|
|
|
|
Persons using assistive technology might not be able to fully access information in this file. For assistance, please send e-mail to: mmwrq@cdc.gov. Type 508 Accommodation and the title of the report in the subject line of e-mail. Neighborhood Safety and the Prevalence of Physical Inactivity -- Selected States, 1996Physical inactivity is an important risk factor for premature morbidity and mortality, especially among high-risk populations. Although health-promotion programs have targeted high-risk groups (i.e., older adults, women, and racial/ethnic minorities) (1), barriers exist that may affect their physical activity level (2). Identifying and reducing specific barriers (e.g., lack of knowledge of the health benefits of physical activity, limited access to facilities, low self-efficacy, and environmental issues {2-6}) are important for efforts designed to increase physical activity. Concerns about neighborhood safety may be a barrier to physical activity (2,3). To characterize the association between neighborhood safety and physical inactivity, CDC analyzed data from the 1996 Behavioral Risk Factor Surveillance System (BRFSS) in Maryland, Montana, Ohio, Pennsylvania, and Virginia. This report summarizes the results of this analysis, which indicate that persons who perceived their neighborhood to be unsafe were more likely to be physically inactive. The BRFSS is a population-based, random-digit-dialed telephone survey of the civilian, noninstitutionalized U.S. population aged greater than or equal to 18 years. In 1996, data on physical activity were analyzed for 12,767 persons (5320 men and 7447 women) who responded to the Social Context Module included in the 1996 surveys in Maryland, Montana, Ohio, Pennsylvania, and Virginia. Respondents were asked, "How safe from crime do you consider your neighborhood to be?" Possible responses were "extremely safe," "quite safe," "slightly safe," or "not at all safe." Respondents were classified as physically inactive if they reported no physical activity or exercise during the preceding month. Numbers for racial/ethnic groups other than white were combined because, when analyzed separately, data were too small for meaningful analysis. Data were weighted, and standard errors were calculated using SUDAAN (7). The prevalence of physical inactivity among respondents was approximately 30% (n=3967), which is similar to the levels reported for adults in the United States (1). The prevalence of physical inactivity was highest among adults aged greater than or equal to 65 years, women, racial/ethnic minorities, persons with a high school education or less, and persons with annual household incomes of less than $20,000 (Table_1). Overall, higher levels of perceived neighborhood safety were associated with lower levels of physical inactivity; the differences were greatest among persons aged greater than or equal to 65 years (from 38.6% {extremely safe} to 63.1% {not at all safe}) and racial/ethnic minorities (from 29.9% {extremely safe} to 44.6% {not at all safe}). For respondents with more than a high school education, little difference in physical inactivity was noted among persons who perceived their neighborhood as unsafe and persons who perceived their neighborhood as safe (24.5% and 23.0%, respectively). The prevalence of physical inactivity among men and women differed across neighborhood safety levels among persons aged 18-64 years but not among persons aged greater than or equal to 65 years (Figure_1). Data stratified by age and sex and controlling for race and education demonstrated an association between neighborhood safety and physical inactivity among older adults (odds ratio=2.3; 95% confidence interval=1.1-4.7). Reported by the following state BRFSS coordinators: A Weinstein, MA, Maryland; P Feigley, Montana; P Pullen, MS, Ohio; L Mann, Pennsylvania; L Redman, Virginia. Physical Activity and Health Br, Div of Nutrition and Physical Activity, National Center for Chronic Disease Prevention and Health Promotion, CDC. Editorial NoteEditorial Note: This report is the first to document the higher prevalence of physical inactivity among persons who perceive their neighborhoods as unsafe, and this finding remained after controlling for other factors. The findings were similar to those from other studies (1), which found that women were more physically inactive than men, and older adults were more inactive than younger adults. However, among older persons who perceived their neighborhoods as unsafe, the prevalence of physical inactivity in these states was similar among men and women. Environmental barriers, including neighborhood safety, are not the only factors associated with physical inactivity among adolescents and young adults (3,8). However, many young adults use facilities, and the types of activities available are more varied. Among older adults, environmental barriers studied have been related to access to facilities (e.g., malls, parks, and gymnasiums) for physical activity rather than neighborhood safety issues (4,5,9). Older adults, for whom walking is the major activity, may be more influenced by safety concerns in their neighborhoods. These results suggest an association between perceived neighborhood safety and physical inactivity for adults aged greater than or equal to 65 years. The findings in this report are subject to at least five limitations. First, BRFSS data are cross-sectional and may not accurately reflect behaviors or conditions over time. Second, data are from only five states and may not represent trends in other states. Third, because the number of respondents in this analysis is relatively small and the data are self-reported, estimates may be unreliable. Fourth, because of the small number of respondents for racial/ethnic minorities, numbers were combined for a comparison with whites. Finally, these data may be affected by unmeasured confounding factors (e.g., social and demographic factors). The survey described in this report suggests that public health action is needed to provide safe alternatives for physical activity in neighborhoods. Such efforts could increase community support and access to safe places for older adults to engage in physical activity. Additional research is needed to increase understanding of how perceived and actual neighborhood safety inhibits or facilitates participation in physical activity. References
Table_1 Note: To print large tables and graphs users may have to change their printer settings to landscape and use a small font size.
TABLE 1. Perceived neighborhood safety and the prevalence of physical inactivity
among persons aged >=18 years, by selected characteristics -- Maryland, Montana,
Ohio, Pennsylvania, and Virginia, Behavioral Risk Factor Surveillance System, 1996
====================================================================================================================
                               Extremely safe          Quite safe           Slightly safe        Not at all safe
                             ------------------    ------------------     ------------------    ------------------
Characteristic      Total*    %     (95% CI+)       %      (95% CI)        %      (95% CI)       %      (95% CI)
------------------------------------------------------------------------------------------------------------------
Age (yrs)
  18-64              2898    30.5   (27.6-33.3)    29.1   (27.4-30.8)     35.1&  (31.7-38.4)    39.3&  (31.5-47.0)
   >=65              1069    38.6   (33.6-43.7)    40.9   (37.6-44.2)     45.0   (36.9-53.0)    63.1&  (48.8-77.5)

Sex
  Men                1496    30.7   (26.9-34.4)    28.3   (26.0-34.4)     34.2   (29.6-38.8)    36.7   (25.3-48.1)
  Women              2471    33.8   (30.5-37.0)    33.8   (31.8-35.7)     38.5&  (34.5-42.5)    47.2&  (38.8-55.7)

Race/
 Ethnicity@
  White              3188    32.4   (29.8-35.1)    30.3   (28.6-32.0)     33.1   (29.5-36.7)    40.8   (31.6-49.9)
  Other               779    29.9   (23.0-36.9)    36.8   (32.9-40.7)     45.1&  (39.1-51.0)    44.6&  (34.0-55.3)

Education level
  <=12 years         2451    41.7   (37.9-45.5)    40.3   (38.0-42.7)     44.8   (40.4-49.1)    51.3&  (42.9-59.7)
   >12 years         1516    23.0   (19.9-26.1)    22.4   (20.5-24.3)     25.4   (21.4-29.5)    24.5   (15.0-33.9)

Annual income
   <$20,000           938    43.8   (37.0-50.6)    42.9   (38.8-47.0)     42.5   (36.0-49.0)    44.0   (33.4-54.7)
  >=$20,000          2269    30.7   (27.8-33.7)    28.6   (26.8-30.5)     34.4   (30.7-38.1)    39.8   (29.2-50.5)
------------------------------------------------------------------------------------------------------------------
* n=3967; numbers may not add to total because of missing data.
+ Confidence interval.
& p <=0.05 compared with "extremely safe."
@ Numbers for racial/ethnic groups other than white were combined because, when analyzed
  separately, data were too small for meaningful analysis.
====================================================================================================================
Return to top. Figure_1 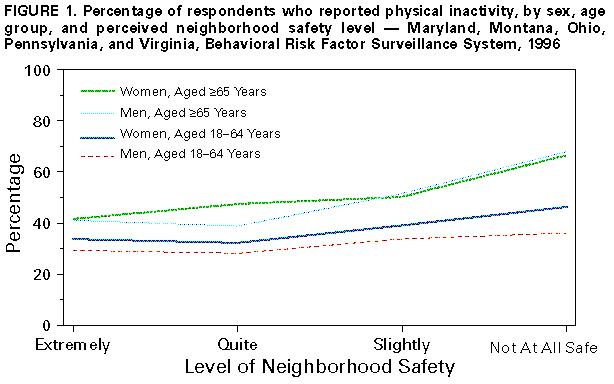 Return to top. Disclaimer All MMWR HTML versions of articles are electronic conversions from ASCII text into HTML. This conversion may have resulted in character translation or format errors in the HTML version. Users should not rely on this HTML document, but are referred to the electronic PDF version and/or the original MMWR paper copy for the official text, figures, and tables. An original paper copy of this issue can be obtained from the Superintendent of Documents, U.S. Government Printing Office (GPO), Washington, DC 20402-9371; telephone: (202) 512-1800. Contact GPO for current prices. **Questions or messages regarding errors in formatting should be addressed to mmwrq@cdc.gov.Page converted: 02/25/99 |
|||||||||
This page last reviewed 5/2/01
|