 |
|
|
|
|
|
|
| ||||||||||
|
|
|
|
|
|
|
||||
| ||||||||||
|
|
|
|
|
Persons using assistive technology might not be able to fully access information in this file. For assistance, please send e-mail to: mmwrq@cdc.gov. Type 508 Accommodation and the title of the report in the subject line of e-mail. Hypothermia-Related Deaths -- Georgia, January 1996-December 1997, and United States, 1979-1995Although hypothermia-related deaths are prevalent during the winter in states that have moderately cold (e.g., Illinois, New York, and Pennsylvania) to severely cold (e.g., Alaska and North Dakota) winters and in states with mountainous or desert terrain (e.g., Arizona, Montana, and New Mexico), hypothermia-related deaths also occur in states with milder climates (e.g., Georgia, Mississippi, and South Carolina), where weather systems can cause rapid changes in temperature. This report summarizes three hypothermia-related deaths in Fulton County, Georgia, representing persons in the highest risk groups for hypothermia; and summarizes hypothermia-related deaths in Georgia during January 1996-December 1997 and in the United States during 1979-1995 . Case Reports Case 1. In January 1996, a 35-year-old man was found dead in an abandoned apartment building complex. He was dressed in a T-shirt and trousers and was severely emaciated, with gangrene and mummification of both feet. On the day of his death, the minimum temperature recorded by the National Weather Service (NWS) for Atlanta was 18 F (-7.8 C). At autopsy, he was negative for ethanol and drugs but positive for HIV infection. Cause of death was attributed to environmental hypothermia. Case 2. In February 1996, an 84-year-old woman was found dead outside her home. She was partially dressed and had blood on her face, feet, and hands. According to the medical examiner, the woman had left her home during the night to go next door to a family member's house when she became disoriented and fell. On the day of her death, the daily minimum temperature recorded by the NWS for Atlanta was 15 F (-9.4 C). At autopsy, gross and histopathologic examination of her brain showed changes consistent with Alzheimer disease. The cause of death was listed as hypo-thermia. Case 3. In December 1996, a 38-year-old man was found dead in the parking lot of the building complex in which he lived. The man was fully dressed and was wearing a jacket. On the day of his death, the daily minimum temperature recorded by the NWS for Atlanta was 44 F (6.7 C). When the man was found, his body temperature was 80 F (26.7 C), and the outdoors ambient temperature was 72 F (22.2 C). At autopsy, the decedent was well nourished and had a blunt-trauma injury to his head and abrasions on his face. His blood alcohol concentration was 0.37 g/dL, indicative of acute ethanol intoxication. The medical examiner concluded that the man died from hypothermia after falling and striking his face and head, which resulted in a skull fracture and unconsciousness. Georgia From January 1996 through December 1997, 14 deaths attributable to hypothermia were reported to the Georgia Division of Public Health. The average age of the decedents was 61 years (range: 1-84 years; median: 63 years); nine (64%) decedents were men. During 1997, five hypothermia-related deaths occurred in a densely populated urban area of Fulton County, part of the Atlanta metropolitan area. United States During 1979-1995 (the most recent year for which data are available), an annual average of 723 deaths in the United States were attributed to hypothermia (range: 551 in 1995 to 1021 in 1983). During this 17-year period, 12,368 deaths were attributable to environmental hypothermia or excessive cold (Table_1), for a rate of 0.3 deaths per 100,000 population (International Classification of Diseases, Ninth Revision {ICD-9}, codes E901.0, E901.8, and E901.9; excludes man-made cold {E901.1}).* Approximately half (6036 {49%}) of all hypothermia-related deaths occurred among persons aged greater than or equal to 65 years (Figure_1); the annual death rate for hypothermia in this age group was 1.2 per 100,000. The age-adjusted death rate for men was almost triple that for women (0.5, compared with 0.2 per 100,000, standardized to the 1980 U.S. population). Reported by: R Hanzlick, MD, Office of the Chief Medical Examiner, Fulton County; K Powell, MD, K Toomey, MD, State Epidemiologist, Div of Public Health, Georgia Dept of Human Resources. Health Studies Br, Div of Environmental Hazards and Health Effects, National Center for Environmental Health; and an EIS Officer, CDC. Editorial NoteEditorial Note: Hypothermia is a medical emergency (1). It is clinically defined as unintentional lowering of the core body temperature to less than or equal to 95 F (less than or equal to 35 C) (2). Environmental hypothermia results from a combination of heat loss by convection (degree of wind exposure), conduction, and radiation to the surrounding ambient air. The severity of hypothermia is indicated by the degree to which core body temperature is lowered: mild (93 F-95 F {34 C-35 C}), moderate (86 F-93 F {30 C-34 C}), and severe (less than 86 F {less than 30 C}) (3). Risk for death from hypothermia is related to age, pre-existing disease, nutritional status, and alcohol and drug intoxication. Socioeconomic factors such as social isolation or homelessness (especially in combination with chronic disease such as immunosuppression) also may increase risk. Alcohol abuse results in vasodilation and interferes with peripheral vasoconstriction, an important physiologic mechanism of defense against cold. Neuroleptic drugs also predispose a person to hypothermia by inducing vasodilation and suppressing the shivering response; lower ambient temperatures amplify the hypothermic effects of these drugs (4). Other risk factors associated with hypothermia include hypothyroidism, mental illness, starvation, poverty, dehydration, immobilizing illnesses, and sustained contact with materials that promote conductive heat loss (e.g., water) (5). Hypothermia death rates increase with age, with the elderly at the highest risk for mortality because of physiologic changes (e.g., lack of appropriate vasoconstriction in response to cold environments, decreased basal metabolic rate, and impaired shivering mechanism) and underlying disease. The onset of hypothermia is often insidious. Early manifestations of exposure include shivering, numbness, fatigue, poor coordination, slurred speech, impaired mental state, blueness or puffiness of the skin, and irrationality (6). Other clinical problems may include hematologic, respiratory, renal, and endocrinologic abnormalities. Coma, hypotension, apnea, and/or cardiac arrhythmia (7,8) characterize severe hypothermia. Hypothermia-related morbidity and mortality can be prevented by early recognition of symptoms and prompt medical attention. Persons who are outdoors for extended periods during cold weather should wear insulated or layered clothing, including headgear, that does not retain moisture; maintain their fluid and calorie intake; abstain from drinking alcoholic beverages; and avoid overexertion and excessive sweating. Public health strategies to reduce hypothermia-related deaths should be targeted toward high-risk populations (e.g., elderly and homeless persons). Preventive measures include educating the public and health-care providers about heat-preservation strategies and providing outreach programs that identify and shelter persons at risk, especially in large urban communities where there are larger groups of homeless persons (9). References
* These data were obtained from the Compressed Mortality File (CMF), maintained by CDC's National Center for Health Statistics, and have been prepared in accordance with the external cause-of-death codes from the ICD-9. The CMF contains information from death certificates filed in the 50 states and the District of Columbia. Table_1 Note: To print large tables and graphs users may have to change their printer settings to landscape and use a small font size. TABLE 1. Crude and adjusted rates * of hypothermia-related death, by state -- United States, 1979-1995 ============================================================= State Crude rate Adjusted rate ------------------------------------------------------------- Alabama 0.5 0.5 Alaska 2.5 2.9 Arizona 0.4 0.3 Arkansas 0.4 0.3 California 0.1 0 Colorado 0.4 0.3 Connecticut 0.2 0.1 Delaware 0.4 0.4 District of Columbia 1.2 1.0 Florida 0.1 0 Georgia 0.3 0.4 Hawaii 0 0 Idaho 0.5 0.5 Illinois 0.4 0.4 Indiana 0.3 0.1 Iowa 0.3 0.2 Kansas 0.4 0.2 Kentucky 0.4 0.2 Louisiana 0.2 0 Maine 0.3 0.2 Maryland 0.2 0.1 Massachusetts 0.2 0 Michigan 0.3 0.3 Minnesota 0.4 0.3 Mississippi 0.5 0.5 Missouri 0.3 0.1 Montana 1.0 1.0 Nebraska 0.3 0.2 Nevada 0.3 0.2 New Hampshire 0.3 0.2 New Jersey 0.2 0.1 New Mexico 1.1 1.2 New York 0.2 0 North Carolina 0.6 0.5 North Dakota 0.8 0.7 Ohio 0.2 0 Oklahoma 0.4 0.5 Oregon 0.3 0.2 Pennsylvania 0.3 0.1 Rhode Island 0.2 0 South Carolina 0.6 0.6 South Dakota 1.1 1.0 Tennessee 0.4 0.4 Texas 0.1 0 Utah 0.3 0.3 Vermont 0.5 0.3 Virginia 0.5 0.5 Washington 0.2 0 West Virginia 0.4 0.4 Wisconsin 0.4 0.2 Wyoming 0.8 0.7 ------------------------------------------------------------- * Per 100,000 population. ============================================================= Return to top. Figure_1 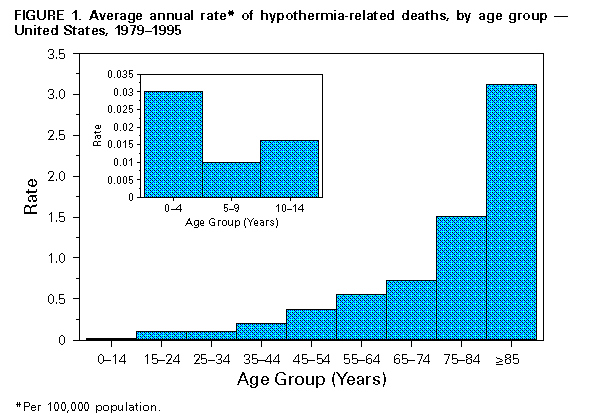 Return to top. Disclaimer All MMWR HTML versions of articles are electronic conversions from ASCII text into HTML. This conversion may have resulted in character translation or format errors in the HTML version. Users should not rely on this HTML document, but are referred to the electronic PDF version and/or the original MMWR paper copy for the official text, figures, and tables. An original paper copy of this issue can be obtained from the Superintendent of Documents, U.S. Government Printing Office (GPO), Washington, DC 20402-9371; telephone: (202) 512-1800. Contact GPO for current prices. **Questions or messages regarding errors in formatting should be addressed to mmwrq@cdc.gov.Page converted: 12/14/98 |
|||||||||
This page last reviewed 5/2/01
|