 |
|
|
|
|
|
|
| ||||||||||
|
|
|
|
|
|
|
||||
| ||||||||||
|
|
|
|
|
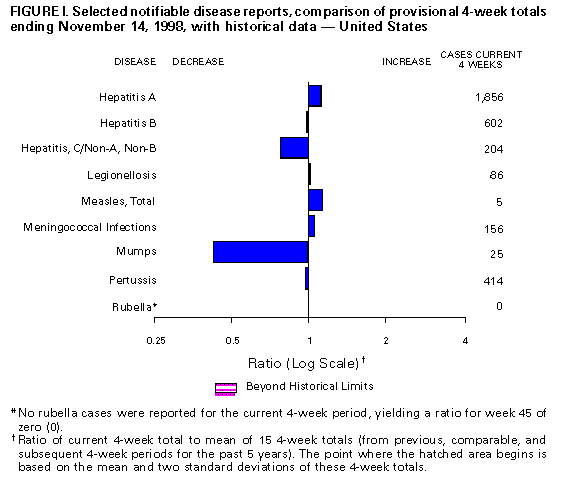
Persons using assistive technology might not be able to fully access information in this file. For assistance, please send e-mail to: mmwrq@cdc.gov. Type 508 Accommodation and the title of the report in the subject line of e-mail. Notifiable Diseases/Deaths in Selected Cities Weekly InformationFigure_I Selected notifiable disease reports, comparison of provisional 4-week totals ending December 5, 1998, with historical data -- United States Table_I Summary -- provisional cases of selected notifiable diseases, United States, cumulative, week ending December 5, 1998 (48th Week) Table_II Provisional cases of selected notifiable diseases, United States, weeks ending December 5, 1998 and November 29, 1997 (48th Week) Table_III Provisional cases of selected notifiable diseases preventable by vaccination, United States, weeks ending December 5, 1998 and November 29, 1997 (45th Week) Table_IV Deaths in 122 U.S. cities, week ending December 5,
1998 (48th Week) Figure_I
TABLE I. Summary -- provisional cases of specified notifiable diseases, United
States, cumulative, week ending November 14, 1998 (45th Week)
==================================================================================
                                             Cum. 1998
------------------------------------------------------
Anthrax                                              -
Brucellosis                                         50
Cholera                                             12
Congenital rubella syndrome                          3
Cryptosporidiosis*                               2,874
Diphtheria                                           1
Encephalitis:  California*                          81
               eastern equine*                       3
               St. Louis*                           24
               western equine*                       -
Hansen Disease                                      96
Hantavirus pulmonary syndrome*+                     19
Hemolytic uremic syndrome, post-diarrheal*          76
HIV infection, pediatric*&                         230
Plague                                               8
Poliomyelitis, paralytic                             1
Psittacosis                                         43
Rabies, human                                        -
Rocky Mountain spotted fever (RMSF)                300
Streptococcal disease, invasive Group A          1,853
Streptococcal toxic-shock syndrome*                 45
Syphilis, congenital@                              361
Tetanus                                             34
Toxic-shock syndrome                               116
Trichinosis                                         12
Typhoid fever                                      293
Yellow fever                                         -
------------------------------------------------------
-: no reported cases
 * Not notifiable in all states
 + Updated weekly from reports to the Division of Viral and Rickettsial
   Diseases, National Center for Infectious Diseases (NCID).
 & Updated monthly to the Division of HIV/AIDS Prevention -- Surveillance
   and Epidemiology, National Center for HIV, STD, and TB Prevention
   (NCHSTP), last update October 25, 1998.
 @ Updated from reports to the Division of STD Prevention, NCHSTP.

==================================================================================
TABLE II. (page 1) Provisional cases of selected notifiable diseases, United States, weeks ending
November 14, 1998, and November 8, 1997 (45th Week)
Escherichia
coli O157:H7
------------------- Hepatitis
AIDS* Chlamydia NETSS** PHLIS*** Gonorrhea C\NA,NB
----------------- -------------------- -------- -------- ------------------- ----------------
Cum. Cum. Cum. Cum. Cum. Cum. Cum. Cum. Cum. Cum.
Reporting Area 1998 1997 1998 1997 1998 1998 1998 1997 1998 1997
------------------------------------------------------------------------------------------------------------------------------
UNITED STATES 38,924 49,734 476,633 406,258 2,627 1,756 286,622 256,777 4,274 3,043
NEW ENGLAND 1,539 2,104 16,029 15,673 297 242 4,569 5,220 71 51
Maine 26 50 907 861 34 - 59 60 - -
N.H. 28 34 824 712 41 42 79 83 - -
Vt. 18 32 367 375 19 17 32 47 1 3
Mass. 785 729 7,335 6,362 139 139 1,987 1,847 67 41
R.I. 108 133 1,980 1,756 11 1 347 387 3 7
Conn. 574 1,126 4,616 5,607 53 43 2,065 2,796 - -
MID. ATLANTIC 10,425 15,051 53,248 49,391 266 70 31,825 32,958 328 284
Upstate N.Y. 1,249 2,264 N N 199 - 5,494 5,672 246 211
N.Y. City 5,885 8,005 30,371 23,646 7 12 13,542 12,357 - -
N.J. 1,909 2,978 9,791 8,700 60 48 6,545 6,577 - -
Pa. 1,382 1,804 13,086 17,045 N 10 6,244 8,352 82 73
E.N. CENTRAL 2,741 3,695 77,360 55,098 400 303 56,225 35,215 453 482
Ohio 562 766 22,213 19,579 108 60 14,476 12,774 8 17
Ind. 448 459 4,656 8,110 91 47 4,232 5,334 7 12
Ill. 1,044 1,515 23,434 U 100 58 19,599 U 31 82
Mich. 531 726 17,936 17,838 101 62 13,945 12,883 407 346
Wis. 156 229 9,121 9,571 N 76 3,973 4,224 - 25
W.N. CENTRAL 754 1,011 26,867 28,485 453 369 13,511 12,512 265 56
Minn. 146 175 5,498 5,813 190 191 2,124 2,044 9 4
Iowa 60 92 2,063 3,943 92 56 660 1,012 8 26
Mo. 367 506 10,515 10,543 45 60 7,501 6,427 241 10
N. Dak. 5 10 849 742 11 15 71 62 - 3
S. Dak. 15 8 1,351 1,171 30 34 199 133 - -
Nebr. 59 84 2,191 2,281 54 - 891 1,011 4 2
Kans. 102 136 4,400 3,992 31 13 2,065 1,823 3 11
S. ATLANTIC 10,118 12,299 96,834 81,232 225 144 80,141 80,247 162 217
Del. 122 194 2,248 35 - 2 1,317 1,096 - -
Md. 1,400 1,729 6,285 6,365 33 12 8,153 9,954 10 9
D.C. 751 956 N N 1 - 3,139 3,823 - -
Va. 771 1,010 11,129 10,134 N 42 7,847 7,625 11 25
W. Va. 72 108 2,249 2,527 11 7 710 802 6 16
N.C. 704 762 19,138 15,073 53 46 16,573 15,045 19 46
S.C. 640 688 14,400 10,902 13 9 9,167 10,070 8 36
Ga. 1,055 1,466 19,926 13,263 70 - 16,775 15,613 9 -
Fla. 4,603 5,386 21,459 22,933 44 26 16,460 16,219 99 85
E.S. CENTRAL 1,598 1,741 33,858 30,649 107 39 33,328 30,670 175 319
Ky. 249 321 5,535 5,466 31 - 3,235 3,548 19 12
Tenn. 591 677 11,554 11,080 50 33 10,024 9,687 149 214
Ala. 417 455 8,908 7,484 23 2 11,382 10,421 5 11
Miss. 341 288 7,861 6,619 3 4 8,687 7,014 2 82
W.S. CENTRAL 4,758 5,196 66,951 59,858 115 24 40,928 38,915 391 449
Ark. 177 193 3,330 2,482 11 10 3,387 4,165 10 14
La. 819 916 13,024 8,666 5 7 11,158 8,457 99 197
Okla. 256 256 8,387 6,417 22 7 4,634 4,155 14 7
Tex. 3,506 3,831 42,210 42,293 77 - 21,749 22,138 268 231
MOUNTAIN 1,360 1,424 27,925 25,770 325 216 7,861 7,010 322 273
Mont. 26 36 1,152 965 15 - 37 50 7 21
Idaho 27 48 1,754 1,416 38 22 146 126 87 61
Wyo. 3 13 616 519 53 55 29 45 63 66
Colo. 254 346 6,870 6,322 81 64 1,986 1,991 31 31
N. Mex. 189 146 3,280 3,328 18 13 795 744 84 50
Ariz. 549 343 9,886 9,215 21 26 3,549 3,082 8 25
Utah 114 125 1,837 1,505 77 21 192 239 23 5
Nev. 198 367 2,530 2,500 22 15 1,127 733 19 14
PACIFIC 5,631 7,213 77,561 60,102 439 349 18,234 14,030 2,107 912
Wash. 375 570 9,419 7,921 100 104 1,678 1,677 22 24
Oreg. 146 261 5,074 4,318 98 94 719 645 5 3
Calif. 4,949 6,256 59,360 44,980 234 137 15,143 10,940 2,025 734
Alaska 17 43 1,603 1,335 7 - 266 330 1 -
Hawaii 144 83 2,105 1,548 N 14 428 438 54 151
Guam 1 2 201 193 N - 24 27 - -
P.R. 1,499 1,715 U U 6 U 329 495 - -
V.I. 31 85 N N N U U U U U
Amer. Samoa - - U U N U U U U U
C.N.M.I. - 1 N N N U 28 20 - 2
------------------------------------------------------------------------------------------------------------------------------
N: Not notifiable U: Unavailable -: no reported cases C.N.M.I.: Commonwealth of North Mariana Islands
* Updated monthly to the Division of HIV/AIDS Prevention, -- Surveillance and Epidemiology, National Center for HIV, STD,
and TB Prevention, last update October 25, 1998.
** National Electronic Telecommunications System for Surveillance.
*** Public Health Laboratory Information System.
=======================================================================================================================================================
TABLE II. (page 2) Provisional cases of selected notifiable diseases, United States, weeks ending
November 14, 1998, and November 8, 1997 (45th Week)
Lyme Syphilis Rabies,
Legionellosis Disease Malaria (Primary & Secondary) Tuberculosis Animal
---------------- ---------------- ---------------- --------------------- ----------------- -------
Cum. Cum. Cum. Cum. Cum. Cum. Cum. Cum. Cum. Cum. Cum.
Reporting Area 1998 1997 1998 1997 1998 1997 1998 1997 1998 * 1997 1998
-------------------------------------------------------------------------------------------------------------------------------------------
UNITED STATES 1,125 920 11,308 10,626 1,191 1,624 6,162 7,405 12,530 15,418 6,014
NEW ENGLAND 74 76 2,524 2,757 54 79 65 120 401 380 1,284
Maine 1 3 11 8 5 1 1 1 10 18 197
N.H. 6 7 42 34 5 8 2 - 12 15 72
Vt. 7 12 11 8 1 2 4 - 2 5 61
Mass. 28 26 703 282 16 30 39 60 229 212 458
R.I. 19 11 592 357 9 7 1 2 49 31 85
Conn. 13 17 1,165 2,068 18 31 18 57 99 99 411
MID. ATLANTIC 271 192 7,399 6,133 299 470 236 351 2,498 2,725 1,395
Upstate N.Y. 90 56 3,683 2,543 85 66 35 36 310 387 968
N.Y. City 27 20 26 160 137 291 65 75 1,301 1,360 U
N.J. 15 26 1,571 1,763 49 81 78 142 541 586 197
Pa. 139 90 2,119 1,667 28 32 58 98 346 392 230
E.N. CENTRAL 354 301 157 555 113 152 952 577 1,079 1,533 126
Ohio 120 107 80 37 15 18 125 192 86 233 54
Ind. 103 51 57 33 11 16 205 161 101 132 11
Ill. 27 30 8 13 35 60 394 U 545 814 16
Mich. 72 78 12 25 45 42 176 128 329 264 35
Wis. 32 35 U 447 7 16 52 96 18 90 10
W.N. CENTRAL 69 54 184 145 86 50 111 161 350 481 614
Minn. 6 2 150 108 51 21 8 16 129 124 110
Iowa 10 9 22 5 8 9 - 7 43 46 136
Mo. 24 19 2 25 15 11 83 105 92 203 25
N. Dak. - 2 - - 2 3 - - 8 12 128
S. Dak. 3 2 - 1 - 1 1 1 16 10 130
Nebr. 19 15 3 2 1 1 6 3 23 20 7
Kans. 7 5 7 4 9 4 13 29 39 66 78
S. ATLANTIC 127 109 768 706 285 280 2,277 3,046 1,756 2,947 1,731
Del. 12 11 37 109 3 5 20 22 18 32 30
Md. 26 19 535 446 78 78 577 803 247 270 403
D.C. 6 4 4 9 17 19 70 102 93 87 -
Va. 19 25 64 58 52 64 134 214 250 275 500
W. Va. N N 12 10 2 1 3 3 38 48 69
N.C. 13 13 53 32 26 16 649 841 392 370 136
S.C. 10 7 7 2 6 16 303 331 214 293 136
Ga. 8 1 5 7 36 35 247 464 434 528 272
Fla. 31 29 51 33 65 46 274 266 70 1,044 185
E.S. CENTRAL 59 49 83 84 29 34 1,062 1,508 901 1,131 245
Ky. 25 11 23 15 6 12 93 120 144 164 31
Tenn. 22 28 41 38 15 7 493 650 289 385 125
Ala. 5 3 17 10 6 10 252 374 302 372 87
Miss. 7 7 2 21 2 5 224 364 166 210 2
W.S. CENTRAL 40 33 23 86 28 51 907 1,178 1,837 2,211 133
Ark. - 2 6 25 1 5 100 149 125 168 31
La. 4 6 4 3 15 13 374 318 249 195 -
Okla. 12 2 2 24 4 8 108 109 141 177 102
Tex. 24 23 11 34 8 25 325 602 1,322 1,671 -
MOUNTAIN 71 61 22 11 61 62 203 162 386 482 209
Mont. 2 1 - - 1 2 - - 18 6 51
Idaho 2 2 5 3 8 - 2 1 12 10 -
Wyo. 1 1 1 2 - 2 1 - 4 2 62
Colo. 17 18 5 - 19 27 11 14 U 74 39
N. Mex. 2 3 4 1 12 8 22 8 59 57 6
Ariz. 19 12 1 2 8 11 152 124 180 207 19
Utah 22 17 - 1 1 3 4 5 48 28 26
Nev. 6 7 6 2 12 9 11 10 65 98 6
PACIFIC 60 45 148 149 236 446 349 302 3,322 3,528 277
Wash. 12 8 7 9 17 44 27 9 184 258 -
Oreg. 1 - 20 17 16 23 5 9 121 123 7
Calif. 45 36 120 121 197 366 315 282 2,831 2,930 247
Alaska 1 - 1 2 2 3 1 1 45 64 23
Hawaii 1 1 - - 4 10 1 1 141 153 -
Guam 2 - - - 1 - 1 3 36 13 -
P.R. - - - - - 5 162 216 68 164 49
V.I. U U U U U U U U U U U
Amer. Samoa U U U U U U U U U U U
C.N.M.I. - - - - - - 164 10 77 9 -
-------------------------------------------------------------------------------------------------------------------------------------------
N: Not notifiable U: Unavailable -: no reported cases
* Additional information about areas displaying 'U' for cumulative Tuberculosis cases can be found in Notices to Readers, MMWR Vol. 47, No. 2, p. 39.
=======================================================================================================================================================
TABLE III. (page 1) Provisional cases of selected notifiable diseases preventable by vaccination, United
States, weeks ending November 14, 1998, and November 8, 1997 (45th Week)
Hepatitis (Viral), by type Measles (Rubeola)
H. influenzae, --------------------------------------- ------------------------------------------------------------
invasive A B Indigenous Imported** Total
---------------- ----------------- ----------------- --------------- --------------- ---------------
Cum. Cum. Cum. Cum. Cum. Cum. Cum. Cum. Cum. Cum.
Reporting Area 1998* 1997 1998 1997 1998 1997 1998 1998 1998 1998 1998 1997
-----------------------------------------------------------------------------------------------------------------------------------------------------
UNITED STATES 902 934 19,360 24,804 7,609 8,206 - 60 - 23 83 128
NEW ENGLAND 61 55 238 595 166 156 - 1 - 2 3 19
Maine 3 5 18 57 4 6 - - - - - 1
N.H. 9 10 13 32 18 15 - - - - - 1
Vt. 7 3 15 12 5 9 - - - 1 1 -
Mass. 36 32 98 245 50 67 - 1 - 1 2 16
R.I. 5 3 15 126 64 14 - - - - - -
Conn. 1 2 79 123 25 45 - - - - - 1
MID. ATLANTIC 130 145 1,292 1,848 967 1,172 - 8 - 6 14 26
Upstate N.Y. 54 47 316 319 254 263 - 1 - 1 2 5
N.Y. City 26 39 328 819 243 416 - - - - - 10
N.J. 45 41 307 275 176 214 - 7 - 1 8 3
Pa. 5 18 341 435 294 279 - - - 4 4 8
E.N. CENTRAL 150 146 3,146 2,575 1,373 1,297 - 11 - 3 14 10
Ohio 45 78 275 276 70 76 - - - 1 1 -
Ind. 39 14 292 270 694 90 - 2 - 1 3 -
Ill. 51 36 584 722 167 243 - - - - - 7
Mich. 8 17 1,839 1,141 403 378 - 9 - 1 10 2
Wis. 7 1 156 166 39 510 - - - - - 1
W.N. CENTRAL 82 54 1,232 1,932 364 417 - 1 - - 1 17
Minn. 64 42 115 184 43 36 - - - - - 8
Iowa 2 5 390 410 59 35 - 1 - - 1 -
Mo. 9 4 562 985 219 298 - - - - - 1
N. Dak. - - 3 10 4 5 - - - - - -
S. Dak. - 2 31 21 2 1 - - - - - 8
Nebr. 1 1 39 85 14 14 - - - - - -
Kans. 6 - 92 237 23 28 - - - - - -
S. ATLANTIC 174 139 1,762 1,684 1,021 1,055 - 3 - 5 8 14
Del. - - 3 29 3 6 - - - 1 1 -
Md. 49 51 283 176 142 146 - - - 1 1 2
D.C. - - 54 28 11 29 - - - - - 1
Va. 16 12 190 202 91 112 - - - 2 2 1
W. Va. 5 3 7 11 8 16 - - - - - -
N.C. 23 21 112 176 211 215 - - - - - 2
S.C. 3 4 37 97 41 90 - - - - - 1
Ga. 42 27 581 471 128 115 - 1 - 1 2 1
Fla. 36 21 495 494 386 326 - 2 - - 2 6
E.S. CENTRAL 49 52 332 539 351 615 - - - 2 2 1
Ky. 7 8 21 67 40 36 - - - - - -
Tenn. 27 29 200 329 242 389 U - U 1 1 -
Ala. 13 13 68 75 67 64 - - - 1 1 1
Miss. 2 2 43 68 2 126 - - - - - -
W.S. CENTRAL 51 45 3,698 5,181 1,125 1,146 - 1 - - 1 8
Ark. - 2 89 191 87 78 - - - - - -
La. 22 12 105 212 150 145 - 1 - - 1 -
Okla. 26 28 535 1,298 88 43 - - - - - 1
Tex. 3 3 2,969 3,480 800 880 - - - - - 7
MOUNTAIN 104 76 2,930 3,787 738 757 - 3 - - 3 8
Mont. - - 90 65 5 9 - - - - - -
Idaho 1 1 226 121 40 41 - - - - - -
Wyo. 1 4 35 30 7 23 - - - - - -
Colo. 18 15 299 370 98 132 - - - - - -
N. Mex. 7 8 134 313 288 229 - - - - - -
Ariz. 53 29 1,769 1,988 163 176 - 3 - - 3 5
Utah 5 3 178 513 66 80 - - - - - 1
Nev. 19 16 199 387 71 67 U - U - - 2
PACIFIC 101 222 4,730 6,663 1,504 1,591 - 32 - 5 37 25
Wash. 10 5 870 584 107 68 - - - 1 1 2
Oreg. 36 31 336 334 107 105 - - - - - -
Calif. 47 171 3,471 5,577 1,272 1,394 - 5 - 3 8 19
Alaska 1 8 17 30 12 14 - 27 - 1 28 -
Hawaii 7 7 36 138 6 10 - - - - - 4
Guam - - - - 2 3 U - U - - -
P.R. 2 - 49 254 333 719 - - - - - -
V.I. U U U U U U U U U U U U
Amer. Samoa U U U U U U U U U U U U
C.N.M.I. - 6 3 1 53 42 U - U - - 1
-----------------------------------------------------------------------------------------------------------------------------------------------------
N: Not notifiable U: Unavailable -: no reported cases
* Of 212 cases among children aged <5 years, serotype was reported for 106 and of those, 42 were type b.
** For imported measles, cases include only those resulting from importation from other countries.
=======================================================================================================================================================
TABLE III. (page 2) Provisional cases of selected notifiable diseases preventable by vaccination, United
States, weeks ending November 14, 1998, and November 8, 1997 (45th Week)
Meningococcal
Disease Mumps Pertussis Rubella
----------------- -------------------------- --------------------------- ---------------------------
Cum. Cum. Cum. Cum. Cum. Cum. Cum. Cum.
Reporting Area 1998 1997 1998 1998 1997 1998 1998 1997 1998 1998 1997
------------------------------------------------------------------------------------------------------------------------------------------
UNITED STATES 2,306 2,799 3 421 556 90 5,233 4,719 - 328 157
NEW ENGLAND 100 177 - 7 10 8 817 858 - 38 1
Maine 6 17 - - - - 5 16 - - -
N.H. 4 14 - - - 2 101 124 - - -
Vt. 5 4 - - - - 68 217 - - -
Mass. 52 86 - 4 3 5 593 459 - 8 1
R.I. 8 20 - 1 6 - 9 16 - 1 -
Conn. 25 36 - 2 1 1 41 26 - 29 -
MID. ATLANTIC 217 296 - 29 50 3 512 346 - 130 33
Upstate N.Y. 62 76 - 6 11 3 276 139 - 111 5
N.Y. City 22 48 - 4 3 - 23 60 - 14 28
N.J. 54 62 - 2 7 - 5 13 - 4 -
Pa. 79 110 - 17 29 - 208 134 - 1 -
E.N. CENTRAL 342 427 - 69 77 9 565 519 - - 6
Ohio 128 150 - 27 30 5 252 150 - - -
Ind. 62 48 - 6 12 - 137 54 - - -
Ill. 84 131 - 11 11 - 96 80 - - 2
Mich. 40 61 - 25 20 4 63 53 - - -
Wis. 28 37 - - 4 - 17 182 - - 4
W.N. CENTRAL 194 209 1 30 15 6 491 416 - 33 -
Minn. 30 34 - 13 5 5 295 247 - - -
Iowa 39 44 1 11 8 - 69 70 - - -
Mo. 70 90 - 3 - - 32 61 - 2 -
N. Dak. 5 2 - 2 - 1 3 1 - - -
S. Dak. 7 5 - - - - 8 4 - - -
Nebr. 14 13 - - 1 - 18 9 - - -
Kans. 29 21 - 1 1 - 66 24 - 31 -
S. ATLANTIC 400 476 - 47 62 10 287 383 - 19 78
Del. 2 5 - - - - 5 1 - - -
Md. 26 41 - - 1 - 51 108 - 1 -
D.C. 1 12 - - - - 1 3 - - 1
Va. 38 53 - 8 10 - 30 42 - 1 1
W. Va. 16 16 - - - 1 2 6 - - -
N.C. 54 84 - 11 10 5 96 112 - 13 59
S.C. 53 49 - 6 11 1 27 25 - - 15
Ga. 90 93 - 1 10 - 24 13 - - -
Fla. 120 123 - 21 20 3 51 73 - 4 2
E.S. CENTRAL 219 210 - 14 29 5 114 127 - 2 1
Ky. 33 43 - - 3 3 50 56 - - -
Tenn. 69 72 U 1 5 U 33 35 U 2 -
Ala. 93 71 - 8 9 2 28 26 - - 1
Miss. 24 24 - 5 12 - 3 10 - - -
W.S. CENTRAL 270 268 - 57 77 9 345 248 - 87 4
Ark. 28 31 - 11 1 1 86 51 - - -
La. 57 48 - 10 13 - 9 18 - - -
Okla. 39 39 - - - 1 30 33 - - -
Tex. 146 150 - 36 63 7 220 146 - 87 4
MOUNTAIN 134 160 1 37 54 25 973 1,009 - 5 7
Mont. 4 8 - - - - 9 17 - - -
Idaho 10 10 1 5 3 1 244 504 - - 2
Wyo. 5 3 - 1 1 - 8 7 - - -
Colo. 27 43 - 6 3 3 199 313 - - -
N. Mex. 25 27 N N N 1 90 92 - 1 -
Ariz. 41 39 - 6 32 - 198 35 - 1 5
Utah 14 13 - 5 8 20 178 20 - 2 -
Nev. 8 17 U 14 7 U 47 21 U 1 -
PACIFIC 430 576 1 131 182 15 1,129 813 - 14 27
Wash. 58 80 - 10 19 14 297 341 - 9 5
Oreg. 76 111 N N N - 86 46 - - -
Calif. 288 376 1 96 130 1 717 392 - 3 14
Alaska 3 2 - 2 8 - 14 16 - - -
Hawaii 5 7 - 23 25 - 15 18 - 2 8
Guam 1 1 U 2 1 U - - U - -
P.R. 6 8 - 1 7 - 3 - - - -
V.I. U U U U U U U U U U U
Amer. Samoa U U U U U U U U U U U
C.N.M.I. - - U 2 4 U 1 - U - -
------------------------------------------------------------------------------------------------------------------------------------------
N: Not notifiable U: Unavailable -: no reported cases
=======================================================================================================================================================
TABLE IV. Deaths in 122 U.S. cities,* week ending
November 14, 1998 (45th Week)
===================================================================================================================================
All Causes, By Age (Years)
------------------------------------------------------------------------ P&I**
Reporting Area All Ages >=65 45-64 25-44 1-24 <1 Total
---------------------------------------------------------------------------------------------------------------
NEW ENGLAND 594 440 90 44 9 11 62
Boston, Mass. 165 109 33 18 1 4 27
Bridgeport, Conn. 53 41 3 6 1 2 -
Cambridge, Mass. 12 7 2 2 1 - 3
Fall River, Mass. 21 18 3 - - - 2
Hartford, Conn. 46 32 9 4 1 - 3
Lowell, Mass. 26 23 2 1 - - 1
Lynn, Mass. 16 15 1 - - - -
New Bedford, Mass. 26 23 2 1 - - 2
New Haven, Conn. 41 28 5 6 1 1 4
Providence, R.I. 44 37 3 - 1 3 -
Somerville, Mass. 4 4 - - - - -
Springfield, Mass. 54 41 9 2 2 - 6
Waterbury, Conn. 24 17 6 1 - - 1
Worcester, Mass. 62 45 12 3 1 1 13
MID. ATLANTIC 2,162 1,530 403 129 59 41 112
Albany, N.Y. 60 40 14 4 2 - 3
Allentown, Pa. 18 16 2 - - - 1
Buffalo, N.Y. 76 58 13 3 2 - 3
Camden, N.J. 30 16 6 2 2 4 1
Elizabeth, N.J. 9 7 2 - - - 1
Erie, Pa. 42 32 8 1 - 1 2
Jersey City, N.J. 29 25 4 - - - -
New York City, N.Y. 1,216 846 228 83 35 24 51
Newark, N.J. 72 37 22 4 3 6 3
Paterson, N.J. 23 12 4 3 4 - -
Philadelphia, Pa. 200 137 44 11 5 3 11
Pittsburgh, Pa.*** 52 37 8 4 2 1 2
Reading, Pa. 16 16 - - - - -
Rochester, N.Y. 141 107 24 7 1 2 19
Schenectady, N.Y. 29 25 3 - 1 - 2
Scranton, Pa. 27 23 3 - 1 - 2
Syracuse, N.Y. 83 66 10 6 1 - 6
Trenton, N.J. 29 23 5 1 - - 5
Utica, N.Y. 10 7 3 - - - -
Yonkers, N.Y. U U U U U U U
E.N. CENTRAL 2,022 1,358 364 184 60 56 126
Akron, Ohio 56 42 3 5 3 3 1
Canton, Ohio 39 30 4 3 2 - 3
Chicago, Ill. 429 224 100 64 26 15 23
Cincinnati, Ohio 97 73 12 8 - 4 7
Cleveland, Ohio 147 92 31 15 1 8 2
Columbus, Ohio 186 145 25 8 5 3 16
Dayton, Ohio 118 87 23 5 - 3 7
Detroit, Mich. 185 101 42 27 11 4 10
Evansville, Ind. 55 44 7 4 - - 2
Fort Wayne, Ind. 51 37 7 3 2 2 -
Gary, Ind. 8 1 2 3 2 - -
Grand Rapids, Mich. 73 57 10 2 3 1 8
Indianapolis, Ind. 180 127 37 10 - 6 13
Lansing, Mich. 34 24 5 3 1 1 1
Milwaukee, Wis. 123 87 21 12 1 2 19
Peoria, Ill. 34 22 7 2 - 3 1
Rockford, Ill. 44 33 10 1 - - 2
South Bend, Ind. 20 15 4 - 1 - 2
Toledo, Ohio 87 68 10 8 - 1 6
Youngstown, Ohio 56 49 4 1 2 - 3
W.N. CENTRAL 659 475 105 43 9 19 60
Des Moines, Iowa 61 43 11 4 - 3 6
Duluth, Minn. 24 18 4 1 1 - 2
Kansas City, Kans. 5 4 1 - - - -
Kansas City, Mo. 119 77 19 8 4 3 4
Lincoln, Nebr. 38 28 6 2 1 1 3
Minneapolis, Minn. 147 110 22 11 1 3 13
Omaha, Nebr. 83 56 13 7 1 6 10
St. Louis, Mo. 110 83 19 5 - 3 12
St. Paul, Minn. 63 51 8 4 - - 9
Wichita, Kans. 9 5 2 1 1 - 1
S. ATLANTIC 1,144 713 270 114 28 17 72
Atlanta, Ga. 88 54 23 8 2 1 1
Baltimore, Md. 142 88 28 20 3 3 13
Charlotte, N.C. 110 76 17 12 3 2 14
Jacksonville, Fla. 126 84 33 8 1 - 6
Miami, Fla. 109 51 39 16 2 - -
Norfolk, Va. 70 46 16 1 4 3 4
Richmond, Va. 63 35 20 6 - 2 3
Savannah, Ga. 48 36 5 4 2 1 5
St. Petersburg, Fla. 37 29 3 3 2 - 1
Tampa, Fla. 171 115 38 12 3 2 16
Washington, D.C. 164 87 45 23 6 3 9
Wilmington, Del. 16 12 3 1 - - -
E.S. CENTRAL 796 517 182 56 23 18 66
Birmingham, Ala. 153 97 36 10 3 7 15
Chattanooga, Tenn. 58 39 11 4 2 2 1
Knoxville, Tenn. 83 59 16 5 - 3 19
Lexington, Ky. 85 58 18 3 5 1 7
Memphis, Tenn. 164 98 41 17 5 3 13
Mobile, Ala. 75 48 14 8 3 2 2
Montgomery, Ala. 47 31 15 1 - - 8
Nashville, Tenn. 131 87 31 8 5 - 1
W.S. CENTRAL 1,322 865 264 115 40 38 70
Austin, Tex. 52 40 2 7 2 1 4
Baton Rouge, La. 13 6 2 2 2 1 2
Corpus Christi, Tex. 54 41 9 2 1 1 3
Dallas, Tex. 187 110 49 12 6 10 3
El Paso, Tex. 80 52 14 7 5 2 5
Ft. Worth, Tex. 98 68 18 8 1 3 10
Houston, Tex. 378 213 98 42 13 12 20
Little Rock, Ark. 75 54 13 6 1 1 4
New Orleans, La. 104 70 14 13 4 3 -
San Antonio, Tex. 189 143 28 13 4 1 12
Shreveport, La. U U U U U U U
Tulsa, Okla. 92 68 17 3 1 3 7
MOUNTAIN 906 627 166 58 30 25 63
Albuquerque, N.M. 96 67 9 12 6 2 4
Boise, Idaho 37 25 7 - 1 4 2
Colo. Springs, Colo. 44 36 5 3 - - 1
Denver, Colo. 103 71 18 7 3 4 11
Las Vegas, Nev. 151 110 31 7 2 1 4
Ogden, Utah 34 25 7 - 1 1 2
Phoenix, Ariz. 161 94 36 17 7 7 7
Pueblo, Colo. 29 21 5 2 1 - 4
Salt Lake City, Utah 98 65 18 6 5 4 12
Tucson, Ariz. 153 113 30 4 4 2 16
PACIFIC 1,532 1,158 205 103 34 31 136
Berkeley, Calif. 21 14 3 1 3 - 1
Fresno, Calif. 135 92 26 8 8 - 17
Glendale, Calif. 36 31 3 2 - - -
Honolulu, Hawaii 66 50 7 5 4 - 7
Long Beach, Calif. 76 57 11 4 2 2 8
Los Angeles, Calif. 415 345 29 28 6 7 22
Pasadena, Calif. 28 22 4 2 - - 6
Portland, Oreg. 106 76 17 8 2 3 5
Sacramento, Calif. U U U U U U U
San Diego, Calif. 103 75 21 5 - 2 17
San Francisco, Calif. 136 95 22 15 2 2 20
San Jose, Calif. 115 89 16 6 2 2 10
Santa Cruz, Calif. 31 28 2 - - 1 3
Seattle, Wash. 112 67 23 12 3 7 7
Spokane, Wash. 66 52 7 3 1 3 8
Tacoma, Wash. 86 65 14 4 1 2 5
TOTAL 11,137**** 7,683 2,049 846 292 256 767
---------------------------------------------------------------------------------------------------------------
U: Unavailable -: no reported cases
* Mortality data in this table are voluntarily reported from 122 cities in the United States, most of which have populations
of 100,000 or more. A death is reported by the place of its occurrence and by the week that the death certificate was
filed. Fetal deaths are not included.
** Pneumonia and influenza.
*** Because of changes in reporting methods in this Pennsylvania city, these numbers are partial counts for the current
week. Complete counts will be available in 4 to 6 weeks.
**** Total includes unknown ages.
===================================================================================================================================
Disclaimer All MMWR HTML versions of articles are electronic conversions from ASCII text into HTML. This conversion may have resulted in character translation or format errors in the HTML version. Users should not rely on this HTML document, but are referred to the electronic PDF version and/or the original MMWR paper copy for the official text, figures, and tables. An original paper copy of this issue can be obtained from the Superintendent of Documents, U.S. Government Printing Office (GPO), Washington, DC 20402-9371; telephone: (202) 512-1800. Contact GPO for current prices. **Questions or messages regarding errors in formatting should be addressed to mmwrq@cdc.gov.Page converted: 11/19/98 |
|||||||||
This page last reviewed 5/2/01
|