 |
|
|
|
|
|
|
| ||||||||||
|
|
|
|
|
|
|
||||
| ||||||||||
|
|
|
|
|
Persons using assistive technology might not be able to fully access information in this file. For assistance, please send e-mail to: mmwrq@cdc.gov. Type 508 Accommodation and the title of the report in the subject line of e-mail. Adult Blood Lead Epidemiology and Surveillance -- United States, First Quarter 1998, and Annual 1994-1997CDC, in collaboration with state and local health departments, monitors laboratory-reported elevated blood lead levels (BLLs) among adults in the United States. During 1998, 27 states * reported surveillance data to the Adult Blood Lead Epidemiology and Surveillance (ABLES) program. This report presents ABLES data for the first quarter of 1998 compared with the first quarter of 1997, annual data for 1997 compared with 1996, and prevalence and incidence of elevated BLLs from 1994 through 1997. The findings indicate that approximately 4000 adults per quarter and an estimated 12,000 adults per year continue to have elevated BLLs; there does not appear to be a trend in these data from 1994 through 1997. Beginning with the previous ABLES report (1), emphasis has been placed on the number of persons with elevated BLLs (prevalence); prior ABLES reports focused primarily on the number of laboratory reports of elevated BLLs (there are often multiple laboratory reports for the same person). The number of new cases of elevated BLLs (incidence) is reported as cumulative annual data. States in the ABLES program mandate that laboratories report elevated BLLs for adults to the state health department or another designee. The minimum BLL required to be reported varies among the states; the ABLES definition of an elevated BLL is greater than or equal to 25 ug/dL. ABLES follow-back procedures for identifying source of exposures and preventing future exposures have been described previously (2). Prevalence is defined as all cases (new plus existing) of persons with at least one BLL greater than or equal to 25 ug/dL during the year. Incidence is defined as all new cases of persons with at least one BLL greater than or equal to 25 ug/dL appearing in state surveillance data in the year who were not recorded during the preceding year. Denominators for prevalence and incidence were derived by subtracting the number of persons aged greater than or equal to 65 years in the state from the total number of persons aged greater than or equal to 16 years in the state. ** First Quarter Reports, 1998 During January 1-March 31, 1998, 3895 persons were reported with BLLs greater than or equal to 25 ug/dL, representing a 20% decrease compared with 4885 persons reported for the first quarter of 1997 (3), *** and a 3% decrease compared with 4010 reported for the fourth quarter of 1997 (1) (Figure_1). Of the 3895, 155 (4%) were reported with BLLs greater than or equal to 50 ug/dL, the level designated by the Occupational Safety and Health Administration (OSHA) for medical removal from the workplace (4), representing a 37% decrease compared with 245 reported for the first quarter of 1997, and a 34% decrease compared with the 236 reported for the fourth quarter of 1997 (Figure_1). Annual Reports, 1997 The number of persons with BLLs greater than or equal to 25 ug/dL reported to the ABLES program increased by 5% from 12,073 in 1996 to 12,716 in 1997, with the same 27 states reporting in each year (3). **** The number of persons with BLLs greater than or equal to 50 ug/dL decreased by 1% from 787 in 1996 to 777 in 1997. The reported number of new cases with BLLs greater than or equal to 25 ug/dL decreased by 12% from 6115 in 1996 to 5397 in 1997, with the same 27 states reporting in each year. New cases with BLLs greater than or equal to 50 ug/dL decreased by 9% from 456 in 1996 to 417 in 1997. Prevalence and Incidence, 1994-1997 The number of states reporting to ABLES increased from four in 1987 to 23 in 1994 and 27 in 1997. Because of this increase, comparing current ABLES raw numeric data with raw numeric data from previous years has required adjustment for the number of states reporting. Beginning with this report, prevalence and incidence will be used to facilitate comparisons of ABLES data over time. Overall prevalence rates ranged from 104 per million adults aged 16-64 years in 1994 to 111 in 1997 (Figure_2). Of the 22 states that reported throughout 1994-1997, 11 had lower prevalence rates in 1997 than in 1994, and 11 had higher rates. Overall incidence ranged from 53 per million adults aged 16-64 years in 1994 to 47 in 1997 (Figure_2). Of the 22 states that reported throughout 1994-1997, the incidence in 1997 compared with 1994 was lower in 13 states, higher in eight states, and unchanged in one. Reported by: JP Lofgren, MD, Alabama Dept of Public Health. K Schaller, Arizona Dept of Health Svcs. S Payne, MA, Occupational Lead Poisoning Prevention Program, California Dept of Health Svcs. BC Jung, MPH, Div of Environmental Epidemiology and Occupational Health, Connecticut Dept of Public Health. R Gergely, Iowa Dept of Public Health. W Davis, MPA, Occupational Health Program, Bur of Health, Maine Dept of Human Svcs. E Keyvan-Larijani, MD, Lead Poisoning Prevention Program, Maryland Dept of Health and Mental Hygiene. R Rabin, MSPH, Div of Occupational Safety, Massachusetts Dept of Labor and Industries. A Allemier, Dept of Medicine, Michigan State Univ, East Lansing, Michigan. M Falken, PhD, Minnesota Dept of Health. C DeLaurier, Div of Public Health Svcs, New Hampshire State Dept of Health and Human Svcs. B Gerwel, MD, Occupational Disease Prevention Project, New Jersey State Dept of Health. R Prophet, PhD, New Mexico Dept of Health. R Stone, PhD, New York State Dept of Health. S Randolph, MSN, North Carolina Dept of Health and Human Svcs. A Migliozzi, MSN, Bur of Health Risk Reduction, Ohio Dept of Health. E Rhoades, MD, Oklahoma State Dept of Health. A Sandoval, MS, State Health Div, Oregon Dept of Human Resources. J Gostin, MS, Occupational Health Program, Div of Environmental Health, Pennsylvania Dept of Health. M Stoeckel, MPH, Rhode Island Dept of Health. A Gardner-Hillian, Div of Health Hazard Evaluations, South Carolina Dept of Health and Environmental Control. D Salzman, MPH, Bur of Epidemiology, Texas Dept of Health. W Ball, PhD, Bur of Epidemiology, Utah Dept of Health. L Toof, Div of Epidemiology and Health Promotion, Vermont Dept of Health. P Rajaraman, MS, Washington State Dept of Labor and Industries. J Tierney, Wisconsin Dept of Health and Family Svcs. T Klietz, Wyoming Dept of Health. Div of Surveillance, Hazard Evaluations, and Field Studies, National Institute for Occupational Safety and Health, CDC. Editorial NoteEditorial Note: The quarterly data for the 27 ABLES states for the first quarter of 1997 through the first quarter of 1998 show approximately 4000 persons each quarter with BLLs greater than or equal to 25 ug/dL and approximately 200 persons each quarter with BLLs greater than or equal to 50 ug/dL. The annual data for 1997 for the 27 ABLES states show a 5% increase in the number of persons and a 12% decrease in the number of new cases with BLLs greater than or equal to 25 ug/dL compared with 1996 and adjusted for the increase in the number of participating states in 1997. Based on data for 1994-1997, however, these changes from 1996 to 1997 do not seem to represent a change from the overall pattern of prevalence and incidence during 1994-1997; a recognizable trend in the combined ABLES data during this period is not evident. Variation in the number of detected cases reported to ABLES may reflect 1) changes in the year-to-year efforts of the various participating states, and lead-using industries within them, to identify lead-exposed workers and prevent new lead exposures; 2) changes in occupational exposures to lead; 3) changes in compliance with OSHA requirements regarding blood lead monitoring; and/or 4) changes in the size of the workforce in lead-using industries. Variation in quarterly and annual nationwide reporting totals also might represent normal fluctuations in case reporting, which may result from changes in staffing and funding in state-based surveillance programs, interstate differences in worker BLL testing by lead-using industries, or random variation. The findings in this report document the continuing hazard of lead exposures as an occupational health problem in the United States. ABLES enhances surveillance for this preventable condition by expanding the number of participating states, exploring ways to increase the usefulness of reporting, and alerting the public to potential new sources of lead exposure. References
* Alabama, Arizona, California, Connecticut, Iowa, Maine, Maryland, Massachusetts, Michigan, Minnesota, New Hampshire, New Jersey, New Mexico, New York, North Carolina, Ohio, Oklahoma, Oregon, Pennsylvania, Rhode Island, South Carolina, Texas, Utah, Vermont, Washington, Wisconsin, and Wyoming. ** Population figures are available from the World-Wide Web site http://www.census.gov/population/estimates/state/97agesex.txt. *** To compare the number of persons for a constant roster of 27 states in 1998 and 1997, an estimate of first quarter 1997 data for Illinois, which discontinued reporting in 1996, was subtracted from previously reported totals for the first quarter of 1997 (3). **** To compare data for a constant roster of 27 states in 1996 and 1997, data for 1997 for New Mexico, Rhode Island, and Wyoming were added to the previously reported totals for 1996, and data for 1996 for Illinois (which discontinued reporting at the end of 1996) were subtracted from the previously reported totals for 1996 (3). Previously reported 1996 data for Minnesota and Ohio were updated for this report. Figure_1 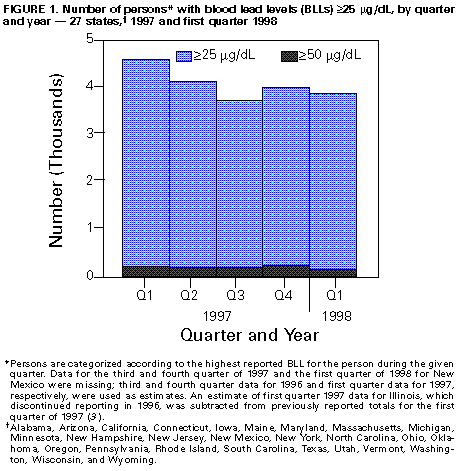 Return to top. Figure_2 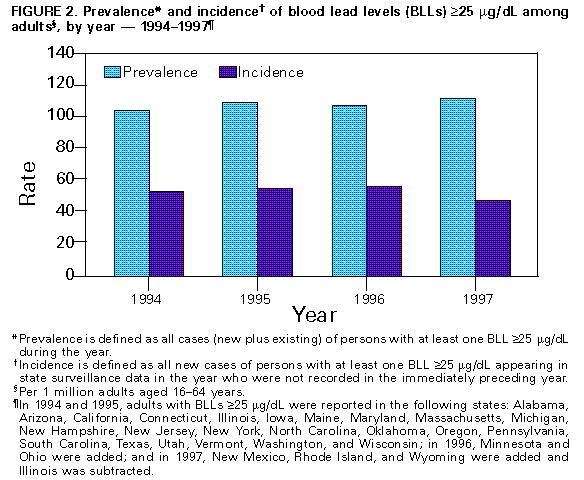 Return to top. Disclaimer All MMWR HTML versions of articles are electronic conversions from ASCII text into HTML. This conversion may have resulted in character translation or format errors in the HTML version. Users should not rely on this HTML document, but are referred to the electronic PDF version and/or the original MMWR paper copy for the official text, figures, and tables. An original paper copy of this issue can be obtained from the Superintendent of Documents, U.S. Government Printing Office (GPO), Washington, DC 20402-9371; telephone: (202) 512-1800. Contact GPO for current prices. **Questions or messages regarding errors in formatting should be addressed to mmwrq@cdc.gov.Page converted: 11/10/98 |
|||||||||
This page last reviewed 5/2/01
|