 |
|
|
|
|
|
|
| ||||||||||
|
|
|
|
|
|
|
||||
| ||||||||||
|
|
|
|
|
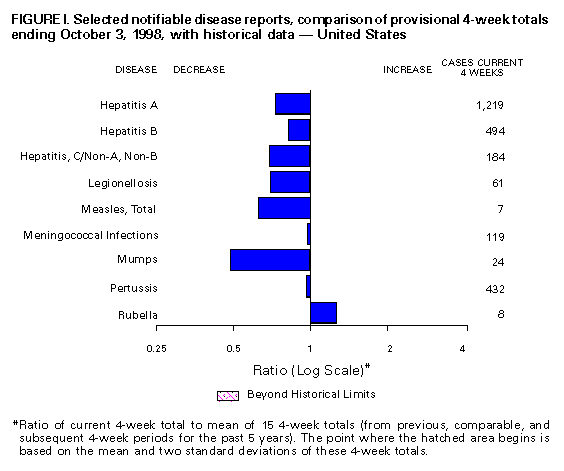
Persons using assistive technology might not be able to fully access information in this file. For assistance, please send e-mail to: mmwrq@cdc.gov. Type 508 Accommodation and the title of the report in the subject line of e-mail. Notifiable Diseases/Deaths in Selected Cities Weekly InformationFigure_I Selected notifiable disease reports, comparison of provisional 4-week totals ending October 3, 1998, with historical data -- United States Table_I Summary -- provisional cases of selected notifiable diseases, United States, cumulative, week ending October 3, 1998 (39th Week) Table_II Provisional cases of selected notifiable diseases, United States, weeks ending October 3, 1998 and September 27, 1997 (39th Week) Table_III Provisional cases of selected notifiable diseases preventable by vaccination, United States, weeks ending October 3, 1998 and September 27, 1997 (39th Week) Table_IV Deaths in 122 U.S. cities, week ending
October 3, 1998 (39th Week)
TABLE I. Summary -- provisional cases of specified notifiable diseases, United
States, cumulative, week ending October 3, 1998 (39th Week)
==================================================================================
                                             Cum. 1998
------------------------------------------------------
Anthrax                                              -
Brucellosis                                         42
Cholera                                              7
Congenital rubella syndrome                          3
Cryptosporidiosis*                               2,541
Diphtheria                                           1
Encephalitis:  California*                          63
               eastern equine*                       4
               St. Louis*                            3
               western equine*                       -
Hansen Disease                                      86
Hantavirus pulmonary syndrome*+                     15
Hemolytic uremic syndrome, post-diarrheal*          54
HIV infection, pediatric*&                         178
Plague                                               6
Poliomyelitis, paralytic                             1
Psittacosis                                         30
Rabies, human                                        -
Rocky Mountain spotted fever (RMSF)                247
Streptococcal disease, invasive Group A          1,677
Streptococcal toxic-shock syndrome*                 41
Syphilis, congenital@                              307
Tetanus                                             32
Toxic-shock syndrome                               100
Trichinosis                                          9
Typhoid fever                                      254
Yellow fever                                         -
------------------------------------------------------
-: no reported cases
 * Not notifiable in all states
 + Updated weekly from reports to the Division of Viral and Rickettsial
   Diseases, National Center for Infectious Diseases (NCID).
 & Updated monthly to the Division of HIV/AIDS Prevention -- Surveillance
   and Epidemiology, National Center for HIV, STD, and TB Prevention
   (NCHSTP), last update September 27, 1998.
 @ Updated from reports to the Division of STD Prevention, NCHSTP.

==================================================================================
Return to top. Table_II Note: To print large tables and graphs users may have to change their printer settings to landscape and use a small font size.
TABLE II. (page 1) Provisional cases of selected notifiable diseases, United States, weeks ending
October 3, 1998, and September 27, 1997 (39th Week)
Escherichia
coli O157:H7
------------------- Hepatitis
AIDS* Chlamydia NETSS** PHLIS*** Gonorrhea C\NA,NB
----------------- -------------------- -------- -------- ------------------- ----------------
Cum. Cum. Cum. Cum. Cum. Cum. Cum. Cum. Cum. Cum.
Reporting Area 1998 1997 1998 1997 1998 1998 1998 1997 1998 1997
------------------------------------------------------------------------------------------------------------------------------
UNITED STATES 35,486 43,681 396,438 343,217 2,245 1,325 241,098 217,368 2,917 2,670
NEW ENGLAND 1,381 1,895 14,256 13,294 273 220 4,104 4,447 51 46
Maine 24 46 743 773 32 - 53 52 - -
N.H. 28 29 673 599 37 40 71 74 - -
Vt. 17 31 315 305 17 10 28 42 - 2
Mass. 712 640 6,275 5,434 130 131 1,636 1,593 48 37
R.I. 94 119 1,710 1,506 11 1 282 344 3 7
Conn. 506 1,030 4,540 4,677 46 38 2,034 2,342 - -
MID. ATLANTIC 9,642 13,711 47,100 42,877 231 63 27,037 28,306 288 248
Upstate N.Y. 1,102 2,133 N N 173 - 4,168 4,838 224 178
N.Y. City 5,457 7,287 26,156 20,249 6 12 11,673 10,369 - -
N.J. 1,765 2,685 7,858 7,421 52 41 4,952 5,740 - -
Pa. 1,318 1,606 13,086 15,207 N 10 6,244 7,359 64 70
E.N. CENTRAL 2,567 3,310 65,965 45,338 336 255 46,660 29,681 391 446
Ohio 540 676 18,995 16,285 94 53 12,187 10,668 7 14
Ind. 414 444 4,656 6,873 76 40 3,353 4,603 4 12
Ill. 993 1,345 18,908 U 84 39 15,697 U 25 74
Mich. 468 648 15,932 13,989 82 54 12,212 10,876 355 321
Wis. 152 197 7,474 8,191 N 69 3,211 3,534 - 25
W.N. CENTRAL 664 823 22,676 24,053 407 234 11,469 10,557 247 49
Minn. 136 156 4,571 4,930 200 98 1,723 1,724 9 3
Iowa 58 85 2,063 3,264 79 46 660 845 8 24
Mo. 312 380 8,950 8,973 32 47 6,561 5,542 222 9
N. Dak. 4 10 616 627 10 13 51 48 - 2
S. Dak. 13 8 1,156 982 22 21 181 103 - -
Nebr. 59 71 1,471 1,916 42 - 508 768 3 2
Kans. 82 113 3,849 3,361 22 9 1,785 1,527 5 9
S. ATLANTIC 9,235 10,556 81,681 70,006 186 119 68,014 68,667 138 180
Del. 112 183 1,920 - - 2 1,109 904 - -
Md. 1,304 1,384 5,599 5,338 27 12 6,658 8,627 8 4
D.C. 691 751 N N 1 - 2,729 3,293 - -
Va. 688 878 10,309 8,793 N 38 6,913 6,134 11 23
W. Va. 70 80 1,904 2,205 8 6 609 700 6 15
N.C. 638 679 16,473 12,859 44 37 14,440 12,767 18 41
S.C. 604 576 13,334 9,286 11 8 8,526 8,525 5 33
Ga. 972 1,265 17,684 11,998 61 - 15,487 13,982 9 -
Fla. 4,156 4,760 14,458 19,527 34 16 11,543 13,735 81 64
E.S. CENTRAL 1,444 1,553 29,027 25,913 93 33 28,514 26,099 168 279
Ky. 222 292 4,776 4,812 24 - 2,762 3,085 18 11
Tenn. 522 631 9,916 9,517 45 29 8,678 8,202 143 187
Ala. 395 384 7,611 6,378 21 2 9,811 8,934 5 7
Miss. 305 246 6,724 5,206 3 2 7,263 5,878 2 74
W.S. CENTRAL 4,202 4,634 59,586 47,947 103 14 35,192 31,445 515 361
Ark. 159 180 2,808 2,242 9 6 1,827 3,703 13 11
La. 708 763 11,165 6,980 5 2 9,644 6,744 41 163
Okla. 238 240 7,535 5,641 12 6 4,140 3,704 12 7
Tex. 3,097 3,451 38,078 33,084 77 - 19,581 17,294 449 180
MOUNTAIN 1,230 1,228 16,687 22,094 275 194 6,384 5,992 282 240
Mont. 23 34 999 772 15 - 32 34 7 19
Idaho 19 41 1,497 1,191 34 19 135 102 87 49
Wyo. 1 13 399 436 51 54 18 43 51 61
Colo. 230 313 10 5,291 62 48 1,716 1,600 23 26
N. Mex. 179 141 2,453 2,822 17 13 623 662 76 45
Ariz. 499 269 7,537 8,116 21 25 2,724 2,698 3 24
Utah 101 98 1,527 1,262 65 21 163 202 21 3
Nev. 178 319 2,265 2,204 10 14 973 651 14 13
PACIFIC 5,121 5,971 59,460 51,695 341 193 13,724 12,174 837 821
Wash. 335 455 8,155 6,800 71 56 1,425 1,450 17 22
Oreg. 138 249 4,334 3,619 91 89 635 555 5 3
Calif. 4,500 5,173 43,797 38,821 175 35 11,063 9,490 760 665
Alaska 17 43 1,405 1,136 4 - 242 300 1 -
Hawaii 131 51 1,769 1,319 N 13 359 379 54 131
Guam - 2 201 193 N - 24 27 - -
P.R. 1,246 1,509 U U 6 U 284 449 - -
V.I. 24 79 N N N U U U U U
Amer. Samoa - - U U N U U U U U
C.N.M.I. - 1 N N N U 28 17 - 2
------------------------------------------------------------------------------------------------------------------------------
N: Not notifiable U: Unavailable -: no reported cases C.N.M.I.: Commonwealth of North Mariana Islands
* Updated monthly to the Division of HIV/AIDS Prevention, -- Surveillance and Epidemiology, National Center for HIV, STD,
and TB Prevention, last update September 27, 1998.
** National Electronic Telecommunications System for Surveillance.
*** Public Health Laboratory Information System.
=======================================================================================================================================================
TABLE II. (page 2) Provisional cases of selected notifiable diseases, United States, weeks ending
October 3, 1998, and September 27, 1997 (39th Week)
Lyme Syphilis Rabies,
Legionellosis Disease Malaria (Primary & Secondary) Tuberculosis Animal
---------------- ---------------- ---------------- --------------------- ----------------- -------
Cum. Cum. Cum. Cum. Cum. Cum. Cum. Cum. Cum. Cum. Cum.
Reporting Area 1998 1997 1998 1997 1998 1997 1998 1997 1998 * 1997 1998
-------------------------------------------------------------------------------------------------------------------------------------------
UNITED STATES 891 721 9,161 9,201 996 1,384 5,383 6,402 10,670 13,314 5,299
NEW ENGLAND 58 64 2,271 2,470 47 70 56 113 346 323 1,111
Maine 1 2 11 8 4 1 1 - 9 17 179
N.H. 3 6 34 26 5 8 1 - 9 10 47
Vt. 5 11 8 8 1 2 4 - 2 5 51
Mass. 25 23 626 267 15 25 35 56 196 175 397
R.I. 15 6 427 338 4 5 1 2 41 29 73
Conn. 9 16 1,165 1,823 18 29 14 55 89 87 364
MID. ATLANTIC 210 145 5,774 5,278 249 412 204 308 2,120 2,328 1,199
Upstate N.Y. 71 42 3,237 2,190 75 58 28 31 273 318 851
N.Y. City 25 17 19 145 109 259 51 66 1,102 1,170 U
N.J. 11 20 1,139 1,555 41 73 67 124 451 484 148
Pa. 103 66 1,379 1,388 24 22 58 87 294 356 200
E.N. CENTRAL 272 233 89 466 97 129 736 489 893 1,318 114
Ohio 103 86 63 34 13 17 110 161 75 220 50
Ind. 50 38 20 25 10 13 150 135 85 108 10
Ill. 25 21 5 12 27 52 286 U 485 678 14
Mich. 64 55 1 24 40 35 141 102 245 222 30
Wis. 30 33 U 371 7 12 49 91 3 90 10
W.N. CENTRAL 60 39 173 82 75 45 101 141 293 413 564
Minn. 6 1 143 56 42 19 7 16 111 109 97
Iowa 8 9 21 5 8 8 - 6 28 46 127
Mo. 20 7 1 15 14 9 76 91 88 168 19
N. Dak. - 2 - - 2 3 - - 8 9 119
S. Dak. 3 2 - 1 - 1 1 - 16 10 121
Nebr. 16 14 3 2 1 1 4 3 11 15 6
Kans. 7 4 5 3 8 4 13 25 31 56 75
S. ATLANTIC 110 92 628 625 234 249 2,200 2,612 1,512 2,520 1,559
Del. 11 9 12 107 3 5 18 17 18 25 17
Md. 23 15 463 407 64 73 493 731 218 238 367
D.C. 6 4 4 7 15 14 59 87 81 75 -
Va. 16 20 50 46 48 60 119 180 187 254 456
W. Va. N N 9 5 2 - 2 3 30 45 62
N.C. 9 12 43 27 19 14 571 669 321 321 136
S.C. 10 6 4 2 5 15 240 285 199 252 117
Ga. 8 - 5 1 32 28 536 411 388 473 245
Fla. 25 26 38 23 46 40 162 229 70 837 159
E.S. CENTRAL 53 43 71 73 24 32 910 1,362 826 990 227
Ky. 24 9 14 12 4 11 81 107 129 132 28
Tenn. 17 25 40 35 13 7 426 582 243 351 118
Ala. 5 2 16 7 5 10 219 347 295 324 79
Miss. 7 7 1 19 2 4 184 326 159 183 2
W.S. CENTRAL 24 24 23 62 24 18 782 980 1,535 1,933 125
Ark. - 1 6 18 1 4 81 121 104 147 29
La. 2 2 4 2 11 9 318 276 106 183 -
Okla. 12 1 2 12 4 5 80 97 134 157 96
Tex. 10 20 11 30 8 - 303 486 1,191 1,446 -
MOUNTAIN 51 44 12 9 45 61 165 135 291 422 174
Mont. 2 1 - - 1 2 - - 16 6 46
Idaho 2 2 3 3 7 - 2 1 8 7 -
Wyo. 1 1 1 1 - 2 1 - 4 2 54
Colo. 15 16 3 - 16 27 9 11 U 66 29
N. Mex. 2 2 3 1 12 8 22 8 45 45 5
Ariz. 10 9 - 1 8 10 119 101 138 188 12
Utah 18 8 - 1 1 3 3 5 46 26 26
Nev. 1 5 2 2 - 9 9 9 34 82 2
PACIFIC 53 37 120 136 201 368 229 262 2,854 3,067 226
Wash. 9 6 6 8 17 18 27 9 164 236 -
Oreg. - - 18 17 15 19 5 7 102 119 4
Calif. 42 30 95 109 164 319 195 244 2,428 2,510 199
Alaska 1 - 1 2 2 3 1 1 35 60 23
Hawaii 1 1 - - 3 9 1 1 125 142 -
Guam 2 - - - 1 - 1 3 36 13 -
P.R. - - - - - 5 150 181 68 164 40
V.I. U U U U U U U U U U U
Amer. Samoa U U U U U U U U U U U
C.N.M.I. - - - - - - 164 9 77 2 -
-------------------------------------------------------------------------------------------------------------------------------------------
N: Not notifiable U: Unavailable -: no reported cases
* Additional information about areas displaying 'U' for cumulative Tuberculosis cases can be found in Notices to Readers, MMWR Vol. 47, No. 2, p. 39.
=======================================================================================================================================================
Return to top. Table_III Note: To print large tables and graphs users may have to change their printer settings to landscape and use a small font size.
TABLE III. (page 1) Provisional cases of selected notifiable diseases preventable by vaccination, United
States, weeks ending October 3, 1998, and September 27, 1997 (39th Week)
Hepatitis (Viral), by type Measles (Rubeola)
H. influenzae, --------------------------------------- ------------------------------------------------------------
invasive A B Indigenous Imported** Total
---------------- ----------------- ----------------- --------------- --------------- ---------------
Cum. Cum. Cum. Cum. Cum. Cum. Cum. Cum. Cum. Cum.
Reporting Area 1998* 1997 1998 1997 1998 1997 1998 1998 1998 1998 1998 1997
-----------------------------------------------------------------------------------------------------------------------------------------------------
UNITED STATES 805 837 16,193 21,094 6,111 7,103 - 42 - 20 62 116
NEW ENGLAND 55 48 204 509 136 132 - 1 - 2 3 19
Maine 2 5 16 47 2 6 - - - - - 1
N.H. 8 7 9 23 14 11 - - - - - 1
Vt. 6 3 14 11 4 7 - - - 1 1 -
Mass. 33 29 79 208 39 54 - 1 - 1 2 16
R.I. 5 2 14 115 59 13 - - - - - -
Conn. 1 2 72 105 18 41 - - - - - 1
MID. ATLANTIC 116 129 1,071 1,608 826 1,028 - 8 - 5 13 23
Upstate N.Y. 46 42 273 258 223 220 - 1 - 1 2 5
N.Y. City 26 32 248 717 204 372 - - - - - 7
N.J. 39 38 255 231 161 190 - 7 - 1 8 3
Pa. 5 17 295 402 238 246 - - - 3 3 8
E.N. CENTRAL 133 137 2,471 2,198 657 1,111 - 11 - 3 14 10
Ohio 43 74 253 250 59 60 - - - 1 1 -
Ind. 36 13 120 230 88 79 - 2 - 1 3 -
Ill. 45 34 420 589 127 207 - - - - - 7
Mich. 5 15 1,542 973 357 330 - 9 - 1 10 2
Wis. 4 1 136 156 26 435 - - - - - 1
W.N. CENTRAL 76 39 1,086 1,675 311 357 - - - - - 17
Minn. 59 27 101 133 36 27 - - - - - 8
Iowa 2 5 377 354 51 28 - - - - - -
Mo. 8 4 464 863 186 260 - - - - - 1
N. Dak. - - 3 10 4 5 - - - - - -
S. Dak. - 2 21 18 2 1 - - - - - 8
Nebr. 1 1 36 75 11 12 - - - - - -
Kans. 6 - 84 222 21 24 - - - - - -
S. ATLANTIC 167 128 1,454 1,286 886 937 - 3 - 5 8 11
Del. - - 3 24 2 6 - - - 1 1 -
Md. 48 47 246 150 122 131 - - - 1 1 2
D.C. - - 46 17 10 25 - - - - - 1
Va. 15 12 170 171 81 95 - - - 2 2 1
W. Va. 4 3 4 10 5 14 - - - - - -
N.C. 23 19 90 150 174 197 - - - - - 2
S.C. 3 4 33 88 30 84 - - - - - 1
Ga. 35 24 446 274 129 104 - 1 - 1 2 1
Fla. 39 19 416 402 333 281 - 2 - - 2 3
E.S. CENTRAL 42 43 301 476 305 532 - - - 2 2 1
Ky. 7 6 19 61 33 31 - - - - - -
Tenn. 23 25 181 293 209 338 - - - 1 1 -
Ala. 10 10 58 68 62 55 - - - 1 1 1
Miss. 2 2 43 54 1 108 U - U - - -
W.S. CENTRAL 46 40 3,168 4,326 1,040 957 - 1 - - 1 7
Ark. - 2 79 181 70 65 - - - - - -
La. 21 10 68 174 98 115 - 1 - - 1 -
Okla. 23 26 459 1,173 71 38 - - - - - -
Tex. 2 2 2,562 2,798 801 739 - - - - - 7
MOUNTAIN 78 71 2,311 3,296 626 672 - - - - - 8
Mont. - - 84 60 5 7 - - - - - -
Idaho - 1 208 109 27 28 - - - - - -
Wyo. 1 4 33 27 4 22 U - U - - -
Colo. 17 13 241 323 92 122 - - - - - -
N. Mex. 6 7 112 271 266 198 - - - - - -
Ariz. 43 28 1,382 1,683 138 157 - - - - - 5
Utah 4 3 165 475 60 74 - - - - - 1
Nev. 7 15 86 348 34 64 - - - - - 2
PACIFIC 92 202 4,127 5,720 1,324 1,377 - 18 - 3 21 20
Wash. 7 4 810 441 93 57 - - - 1 1 2
Oreg. 36 29 289 284 93 85 - - - - - -
Calif. 41 158 2,977 4,849 1,123 1,216 - 5 - 2 7 14
Alaska 1 4 16 25 9 11 - 13 - - 13 -
Hawaii 7 7 35 121 6 8 - - - - - 4
Guam - - - - 2 3 U - U - - -
P.R. 2 - 49 227 319 571 - - - - - -
V.I. U U U U U U U U U U U U
Amer. Samoa U U U U U U U U U U U U
C.N.M.I. - 6 3 1 53 34 U - U - - 1
-----------------------------------------------------------------------------------------------------------------------------------------------------
N: Not notifiable U: Unavailable -: no reported cases
* Of 188 cases among children aged <5 years, serotype was reported for 103 and of those, 39 were type b.
** For imported measles, cases include only those resulting from importation from other countries.
=======================================================================================================================================================
TABLE III. (page 2) Provisional cases of selected notifiable diseases preventable by vaccination, United
States, weeks ending October 3, 1998, and September 27, 1997 (39th Week)
Meningococcal
Disease Mumps Pertussis Rubella
----------------- -------------------------- --------------------------- ---------------------------
Cum. Cum. Cum. Cum. Cum. Cum. Cum. Cum.
Reporting Area 1998 1997 1998 1998 1997 1998 1998 1997 1998 1998 1997
------------------------------------------------------------------------------------------------------------------------------------------
UNITED STATES 2,045 2,530 4 368 479 101 4,200 4,052 4 324 140
NEW ENGLAND 80 158 - 6 8 9 683 722 - 39 1
Maine 5 17 - - - - 5 9 - - -
N.H. 4 12 - - - 1 75 101 - - -
Vt. 3 4 - - - - 65 193 - - -
Mass. 40 77 - 4 2 8 495 388 - 9 1
R.I. 3 15 - - 5 - 9 12 - 1 -
Conn. 25 33 - 2 1 - 34 19 - 29 -
MID. ATLANTIC 182 264 1 20 48 6 423 306 - 130 31
Upstate N.Y. 47 71 1 5 10 6 230 121 - 111 4
N.Y. City 20 45 - 4 3 - 23 59 - 14 27
N.J. 49 52 - 2 7 - 5 12 - 4 -
Pa. 66 96 - 9 28 - 165 114 - 1 -
E.N. CENTRAL 303 377 - 60 54 3 420 437 - - 6
Ohio 114 134 - 23 20 - 191 124 - - -
Ind. 51 42 - 6 7 - 96 45 - - -
Ill. 77 113 - 10 8 3 65 62 - - 2
Mich. 35 55 - 21 16 - 51 48 - - -
Wis. 26 33 - - 3 - 17 158 - - 4
W.N. CENTRAL 172 181 1 26 14 12 384 314 - 27 -
Minn. 29 29 - 12 5 12 212 201 - - -
Iowa 32 39 - 9 7 - 61 29 - - -
Mo. 63 79 - 3 - - 22 55 - 2 -
N. Dak. 5 2 1 2 - - 2 1 - - -
S. Dak. 7 5 - - - - 8 4 - - -
Nebr. 9 9 - - 1 - 14 5 - - -
Kans. 27 18 - - 1 - 65 19 - 25 -
S. ATLANTIC 353 426 1 44 57 19 262 356 3 18 63
Del. 2 5 - - - 2 5 1 - - -
Md. 25 40 - - 1 1 47 102 - 1 -
D.C. 1 8 - - - - 1 3 - - 1
Va. 29 43 1 7 10 7 26 42 1 1 1
W. Va. 12 15 - - - - 1 6 - - -
N.C. 49 78 - 10 9 7 88 99 2 13 53
S.C. 49 46 - 6 10 1 25 23 - - 6
Ga. 77 83 - 1 8 - 21 11 - - -
Fla. 109 108 - 20 19 1 48 69 - 3 2
E.S. CENTRAL 189 190 - 13 24 1 85 112 1 3 1
Ky. 26 40 - - 3 - 25 49 - - -
Tenn. 60 62 - 1 4 1 32 32 1 2 -
Ala. 79 64 - 7 7 - 25 21 - 1 1
Miss. 24 24 U 5 10 U 3 10 U - -
W.S. CENTRAL 256 248 - 52 68 3 276 189 - 88 4
Ark. 26 29 - 7 1 2 60 21 - - -
La. 53 47 - 9 12 - 5 17 - 1 -
Okla. 34 33 - - - - 19 28 - - -
Tex. 143 139 - 36 55 1 192 123 - 87 4
MOUNTAIN 114 147 - 31 51 26 787 916 - 5 7
Mont. 4 7 - - - - 9 15 - - -
Idaho 9 10 - 4 2 2 228 484 - - 2
Wyo. 5 2 U 1 1 U 8 7 U - -
Colo. 23 38 - 7 3 1 151 270 - - -
N. Mex. 22 24 N N N - 80 79 - 1 -
Ariz. 35 39 - 5 31 14 162 31 - 1 5
Utah 11 12 - 5 7 9 120 14 - 2 -
Nev. 5 15 - 9 7 - 29 16 - 1 -
PACIFIC 396 539 1 116 155 22 880 700 - 14 27
Wash. 54 68 - 7 14 17 255 288 - 9 5
Oreg. 68 101 N N N 1 88 36 - - -
Calif. 266 361 1 85 110 3 515 343 - 3 14
Alaska 3 2 - 2 8 - 14 16 - - -
Hawaii 5 7 - 22 23 1 8 17 - 2 8
Guam 1 1 U 2 1 U - - U - -
P.R. 6 8 - 1 7 - 3 - - - -
V.I. U U U U U U U U U U U
Amer. Samoa U U U U U U U U U U U
C.N.M.I. - - U 2 4 U 1 - U - -
------------------------------------------------------------------------------------------------------------------------------------------
N: Not notifiable U: Unavailable -: no reported cases
=======================================================================================================================================================
Return to top. Table_IV Note: To print large tables and graphs users may have to change their printer settings to landscape and use a small font size.
TABLE IV. Deaths in 122 U.S. cities,* week ending
October 3, 1998 (39th Week)
===================================================================================================================================
All Causes, By Age (Years)
------------------------------------------------------------------------ P&I**
Reporting Area All Ages >=65 45-64 25-44 1-24 <1 Total
---------------------------------------------------------------------------------------------------------------
NEW ENGLAND 530 375 103 38 5 9 48
Boston, Mass. 136 88 28 12 2 6 21
Bridgeport, Conn. 27 25 1 - 1 - 2
Cambridge, Mass. 14 11 3 - - - 1
Fall River, Mass. 20 16 2 2 - - 1
Hartford, Conn. 46 29 7 8 1 1 2
Lowell, Mass. 28 23 3 2 - - 3
Lynn, Mass. 17 11 6 - - - -
New Bedford, Mass. 16 13 2 1 - - -
New Haven, Conn. 43 28 11 4 - - 3
Providence, R.I. 58 40 12 4 - 2 2
Somerville, Mass. 6 4 2 - - - 1
Springfield, Mass. 34 25 6 3 - - 3
Waterbury, Conn. 30 20 9 1 - - 4
Worcester, Mass. 55 42 11 1 1 - 5
MID. ATLANTIC 2,225 1,527 435 180 37 46 108
Albany, N.Y. 53 40 8 3 2 - 4
Allentown, Pa. 22 17 4 1 - - -
Buffalo, N.Y. 99 75 16 6 1 1 7
Camden, N.J. 29 20 6 1 - 2 2
Elizabeth, N.J. 5 1 2 2 - - -
Erie, Pa. 55 43 7 4 1 - 1
Jersey City, N.J. 33 21 8 2 1 1 -
New York City, N.Y. 1,084 717 229 102 16 20 45
Newark, N.J. 57 32 19 4 1 1 6
Paterson, N.J. 12 7 3 2 - - -
Philadelphia, Pa. 399 270 74 32 10 13 17
Pittsburgh, Pa.*** 51 34 9 3 - 5 3
Reading, Pa. 23 21 2 - - - 2
Rochester, N.Y. 129 101 19 7 - 2 9
Schenectady, N.Y. 23 17 5 - 1 - -
Scranton, Pa. 20 16 3 1 - - -
Syracuse, N.Y. 88 67 15 4 1 1 10
Trenton, N.J. 24 16 3 4 1 - 1
Utica, N.Y. 19 12 3 2 2 - 1
Yonkers, N.Y. U U U U U U U
E.N. CENTRAL 1,855 1,226 409 133 43 44 103
Akron, Ohio 48 30 12 3 1 2 -
Canton, Ohio 38 27 8 3 - - 3
Chicago, Ill. 366 231 87 32 14 2 21
Cincinnati, Ohio 179 122 43 6 2 6 23
Cleveland, Ohio 124 84 28 10 1 1 1
Columbus, Ohio 167 115 34 9 4 5 15
Dayton, Ohio 100 71 27 - 1 1 7
Detroit, Mich. 169 96 38 21 7 7 6
Evansville, Ind. 50 45 4 1 - - 2
Fort Wayne, Ind. 42 31 8 2 - 1 4
Gary, Ind. 6 - 4 1 - 1 -
Grand Rapids, Mich. 51 36 10 3 - 2 4
Indianapolis, Ind. 188 112 43 18 9 6 8
Lansing, Mich. 52 37 12 3 - - 1
Milwaukee, Wis. 105 70 26 6 - 3 4
Peoria, Ill. 45 35 3 2 - 5 2
Rockford, Ill. 27 17 5 3 1 1 1
South Bend, Ind. 43 30 7 4 1 1 1
Toledo, Ohio U U U U U U U
Youngstown, Ohio 55 37 10 6 2 - -
W.N. CENTRAL 856 602 149 59 26 15 41
Des Moines, Iowa 62 47 8 3 1 3 8
Duluth, Minn. 26 17 4 4 1 - -
Kansas City, Kans. 40 28 9 1 2 - -
Kansas City, Mo. 103 68 23 5 2 - 5
Lincoln, Nebr. 34 25 5 2 1 1 1
Minneapolis, Minn. 196 147 30 10 3 6 15
Omaha, Nebr. 80 67 9 3 1 - 4
St. Louis, Mo. 112 68 25 13 4 2 -
St. Paul, Minn. 83 63 16 3 - 1 6
Wichita, Kans. 120 72 20 15 11 2 2
S. ATLANTIC 1,145 716 237 121 36 34 54
Atlanta, Ga. 172 85 49 25 4 9 2
Baltimore, Md. 216 121 54 31 6 4 15
Charlotte, N.C. 79 51 16 9 3 - 6
Jacksonville, Fla. 128 85 20 10 4 9 4
Miami, Fla. 107 68 20 16 1 2 -
Norfolk, Va. 48 32 7 4 3 2 2
Richmond, Va. 68 44 14 5 1 3 3
Savannah, Ga. 34 26 5 3 - - 2
St. Petersburg, Fla. 39 33 5 1 - - 2
Tampa, Fla. 141 105 20 8 7 1 13
Washington, D.C. 101 56 25 9 7 4 5
Wilmington, Del. 12 10 2 - - - -
E.S. CENTRAL 808 554 162 55 13 21 45
Birmingham, Ala. 167 114 34 7 3 6 11
Chattanooga, Tenn. 71 45 16 6 2 2 4
Knoxville, Tenn. 82 49 21 7 1 4 5
Lexington, Ky. 90 58 17 9 3 3 5
Memphis, Tenn. 128 100 19 5 2 2 11
Mobile, Ala. 110 81 19 8 1 1 2
Montgomery, Ala. 33 21 9 2 - 1 3
Nashville, Tenn. 127 86 27 11 1 2 4
W.S. CENTRAL 1,384 896 272 129 49 38 92
Austin, Tex. 77 51 14 6 4 2 5
Baton Rouge, La. 17 6 5 3 2 1 1
Corpus Christi, Tex. 66 49 8 6 2 1 7
Dallas, Tex. 181 120 31 16 7 7 7
El Paso, Tex. 81 58 13 6 3 1 4
Ft. Worth, Tex. 101 68 20 6 2 5 8
Houston, Tex. 333 200 72 38 16 7 36
Little Rock, Ark. 71 40 17 10 1 3 2
New Orleans, La. 65 42 6 13 3 1 -
San Antonio, Tex. 212 137 54 14 3 4 13
Shreveport, La. 75 49 17 3 5 1 4
Tulsa, Okla. 105 76 15 8 1 5 5
MOUNTAIN 794 547 130 74 23 20 49
Albuquerque, N.M. 92 60 19 8 3 2 3
Boise, Idaho 36 29 6 1 - - -
Colo. Springs, Colo. 53 38 7 6 - 2 4
Denver, Colo. U U U U U U U
Las Vegas, Nev. 183 126 32 18 2 5 11
Ogden, Utah 23 17 2 3 1 - 1
Phoenix, Ariz. 145 94 24 12 9 6 8
Pueblo, Colo. 22 16 3 1 1 1 2
Salt Lake City, Utah 96 60 12 18 2 4 5
Tucson, Ariz. 144 107 25 7 5 - 15
PACIFIC 1,584 1,112 290 105 43 34 125
Berkeley, Calif. 16 9 2 4 1 - 3
Fresno, Calif. 111 80 18 9 4 - 13
Glendale, Calif. 16 14 2 - - - 1
Honolulu, Hawaii 68 49 11 6 1 1 3
Long Beach, Calif. 75 49 15 5 2 4 10
Los Angeles, Calif. 270 197 47 14 7 5 14
Pasadena, Calif. 23 20 2 1 - - 3
Portland, Oreg. 115 84 18 7 4 2 5
Sacramento, Calif. 157 114 29 8 4 2 18
San Diego, Calif. 140 88 36 12 3 1 14
San Francisco, Calif. 116 70 29 8 3 6 11
San Jose, Calif. 179 135 28 12 3 1 16
Santa Cruz, Calif. 23 18 1 3 1 - 3
Seattle, Wash. 137 92 25 8 5 7 2
Spokane, Wash. 61 46 9 3 1 2 4
Tacoma, Wash. 77 47 18 5 4 3 5
TOTAL 11,181**** 7,555 2,187 894 275 261 665
---------------------------------------------------------------------------------------------------------------
U: Unavailable -: no reported cases
* Mortality data in this table are voluntarily reported from 122 cities in the United States, most of which have populations
of 100,000 or more. A death is reported by the place of its occurrence and by the week that the death certificate was
filed. Fetal deaths are not included.
** Pneumonia and influenza.
*** Because of changes in reporting methods in this Pennsylvania city, these numbers are partial counts for the current
week. Complete counts will be available in 4 to 6 weeks.
**** Total includes unknown ages.
===================================================================================================================================
Return to top. Disclaimer All MMWR HTML versions of articles are electronic conversions from ASCII text into HTML. This conversion may have resulted in character translation or format errors in the HTML version. Users should not rely on this HTML document, but are referred to the electronic PDF version and/or the original MMWR paper copy for the official text, figures, and tables. An original paper copy of this issue can be obtained from the Superintendent of Documents, U.S. Government Printing Office (GPO), Washington, DC 20402-9371; telephone: (202) 512-1800. Contact GPO for current prices. **Questions or messages regarding errors in formatting should be addressed to mmwrq@cdc.gov.Page converted: 11/10/98 |
|||||||||
This page last reviewed 5/2/01
|