 |
|
|
|
|
|
|
| ||||||||||
|
|
|
|
|
|
|
||||
| ||||||||||
|
|
|
|
|
Persons using assistive technology might not be able to fully access information in this file. For assistance, please send e-mail to: mmwrq@cdc.gov. Type 508 Accommodation and the title of the report in the subject line of e-mail. Deaths Resulting from Residential Fires and the Prevalence of Smoke Alarms -- United States, 1991-1995In 1995, residential fires accounted for an estimated 3600 deaths and approximately 18,600 injuries (1,2). In addition, property damage and other direct costs have been estimated to exceed more than $4 billion annually (3). To determine residential fire-related death rates, CDC analyzed death certificate data from 1991 to 1995 from U.S. vital statistics mortality tapes. Data from CDC's Behavioral Risk Factor Surveillance System (BRFSS) was used to determine the prevalence of smoke alarms in U.S. households. This report presents the findings of these analyses, which indicate a seasonal variation in fire-related deaths and a high prevalence of smoke alarms in residences in the United States. Deaths from residential fires were classified using International Classification of Diseases, Ninth Revision, external cause of injury codes E890-E899 and the place of occurrence noted as residence on the death certificate. The 1995 BRFSS survey is the only comprehensive survey from which state-specific prevalence rates for smoke alarms can be generated. The BRFSS is an ongoing, state-based, random-digit-dialed telephone survey of the U.S. population aged greater than or equal to 18 years. Estimates of the prevalence of smoke alarms were weighted based on the number of telephone numbers per household and the age, sex, and race distribution in each state. From 1991 to 1995, the U.S. residential fire-related death rate declined from 1.3 per 100,000 population to 1.1. During this time period, residential fire-related death rates were greatest during December-February and lowest during June-August (Figure_1). The averaged annualized death rates for 1991-1995 showed that children aged less than 5 years and adults aged greater than or equal to 65 years had higher rates than those in other age groups (Figure_1). In 1995, 93.6% of households in the United States reported having at least one smoke alarm. The prevalence of smoke alarms ranged from 78.9% in Hawaii (95% confidence interval {CI}=76.7%-81.2%) to 98.7% in Maryland (95% CI=98.3%-99.1%) (Table_1). Reported by: Div of Unintentional Injury Prevention, National Center for Injury Prevention and Control, CDC. Editorial NoteEditorial Note: During 1991-1995, deaths from residential fires declined, meeting the national health objective for 2000 of 1.2 per 100,000 persons (objective 9.6) (4). The findings in this report suggest that residential fire-related deaths were greatest during December-February, reflecting the seasonal use of heating devices (e.g., portable space heaters and wood-burning stoves). The leading causes of residential fires are due to cooking and heating devices improperly placed and/or left unattended (5). Because 81% of fire-related deaths occur in the home, strategies that emphasize residential fire prevention probably will result in the largest reduction in fire-related deaths. To reduce the risk for death or injury resulting from fires, a smoke alarm should be installed outside each sleeping area and on every habitable level of a home (6). Homes with smoke alarms have almost half as many fire-related deaths compared with homes without smoke alarms (7,8). Children aged less than 5 years and adults aged greater than or equal to 65 years have two to six times higher fire-related death rates compared with the national average for all ages (2). Both young children and older adults who may have physical limitations can benefit from the early warnings provided by smoke alarms. The findings in this report also indicate that the prevalence of smoke alarms across the United States is high. This is, in part, due to various programs, such as distribution and installation programs, conducted by state and local health departments and fire service personnel and programs that provide smoke alarms to parents of newborns (9). However, these data do not necessarily reflect the proportion of homes equipped with functional smoke alarms. The effectiveness of smoke alarms is dependent on appropriately installing and maintaining the device (1), and approximately 50% of smoke alarms are no longer functional 12 months after installation. It is necessary to continue with programs to install smoke alarms in homes to achieve 100% coverage and to implement public health programs that focus on their maintenance. This analysis has at least one important limitation. Low-income households less likely to have telephones are probably less likely to have smoke alarms. Because the BRFSS excludes households without telephones, the prevalence of smoke alarms may be overestimated. Effective public health strategies to reduce residential fire-related injuries and deaths should include 1) smoke alarm installation, 2) monthly testing of smoke alarms, 3) reduction of residential fire hazards, 4) the design and practice of fire escape plans, 5) fire-safety education, and 6) the implementation of smoke alarm ordinances. The adoption of these strategies should lead to continued declines in residential fire-related deaths. References
Figure_1 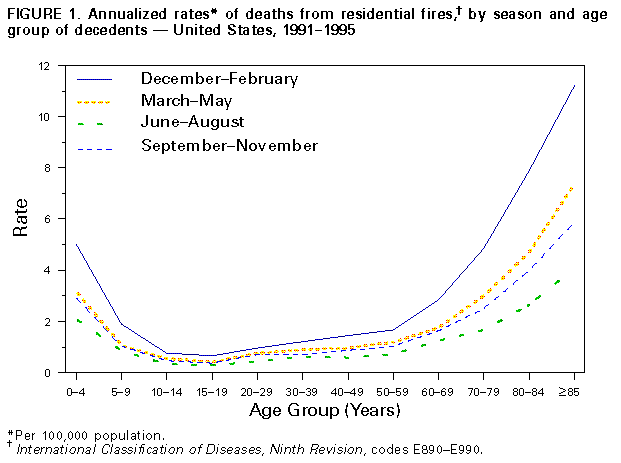 Return to top. Table_1 Note: To print large tables and graphs users may have to change their printer settings to landscape and use a small font size. TABLE 1. Prevalence of households* with at least one smoke alarm, by state -- Behavioral Risk Factor Surveillance System, United States, 1995 ====================================================================================== State % (95% CI+) � State % (95% CI) -----------------------------------------+------------------------------------------ Alabama 92.6 (91.1%-94.1%) � Montana 90.1 (88.1%-92.1%) Alaska 96.4 (94.9%-97.8%) � Nebraska 90.9 (89.4%-92.4%) Arizona 91.5 (89.6%-93.3%) � Nevada 95.0 (93.8%-96.2%) Arkansas 87.7 (85.9%-89.4%) � New Hampshire 97.7 (96.9%-98.6%) California 92.7 (90.9%-94.5%) � New Jersey 96.0 (94.7%-97.3%) Colorado 90.5 (89.0%-92.0%) � New Mexico 87.6 (85.4%-89.8%) Connecticut 96.8 (95.9%-97.8%) � New York 94.5 (93.5%-95.5%) Delaware 97.4 (96.5%-98.2%) � North Carolina 93.9 (93.0%-94.9%) Florida 92.2 (91.1%-93.2%) � North Dakota 94.3 (93.0%-95.6%) Georgia 92.9 (91.7%-93.5%) � Ohio 96.7 (95.6%-97.8%) Hawaii 78.9 (76.7%-81.2%) � Oklahoma 93.2 (91.8%-94.5%) Idaho 92.0 (90.9%-93.2%) � Oregon 97.7 (97.1%-98.2%) Illinois 97.8 (97.0%-98.6%) � Pennsylvania 95.1 (94.3%-96.0%) Indiana 95.8 (94.8%-96.7%) � Rhode Isaland 95.6 (94.5%-96.7%) Iowa 93.7 (92.8%-94.6%) � South Carolina 95.8 (94.6%-97.0%) Kansas 91.9 (90.5%-93.2%) � South Dakota 88.1 (86.3%-89.8%) Kentucky 91.9 (90.6%-93.2%) � Tennessee 92.6 (91.4%-93.8%) Louisiana 84.5 (82.6%-86.5%) � Texas 87.6 (85.7%-89.5%) Maine 96.4 (95.2%-97.7%) � Utah 91.1 (89.6%-92.6%) Maryland 98.7 (98.3%-99.1%) � Vermont 95.3 (94.4%-96.3%) Massachusetts 97.8 (97.0%-98.6%) � Virgina 96.1 (95.0%-97.1%) Michigan 96.5 (95.6%-97.3%) � Washington 96.6 (95.8%-97.3%) Minnesota 97.3 (96.6%-97.9%) � West Virginia 91.7 (90.4%-92.9%) Mississippi 85.3 (83.0%-87.5%) � Wisconsin 96.9 (95.9%-97.9%) Missouri 94.7 (93.3%-96.2%) � Wyoming 90.5 (89.1%-91.8%) -----------------------------------------+------------------------------------------ * Persons aged >= 18 years who reported the presence of at least one smoke alarm. + Confidence interval. ====================================================================================== Return to top. Disclaimer All MMWR HTML versions of articles are electronic conversions from ASCII text into HTML. This conversion may have resulted in character translation or format errors in the HTML version. Users should not rely on this HTML document, but are referred to the electronic PDF version and/or the original MMWR paper copy for the official text, figures, and tables. An original paper copy of this issue can be obtained from the Superintendent of Documents, U.S. Government Printing Office (GPO), Washington, DC 20402-9371; telephone: (202) 512-1800. Contact GPO for current prices. **Questions or messages regarding errors in formatting should be addressed to mmwrq@cdc.gov.Page converted: 10/05/98 |
|||||||||
This page last reviewed 5/2/01
|