 |
|
|
|
|
|
|
| ||||||||||
|
|
|
|
|
|
|
||||
| ||||||||||
|
|
|
|
|
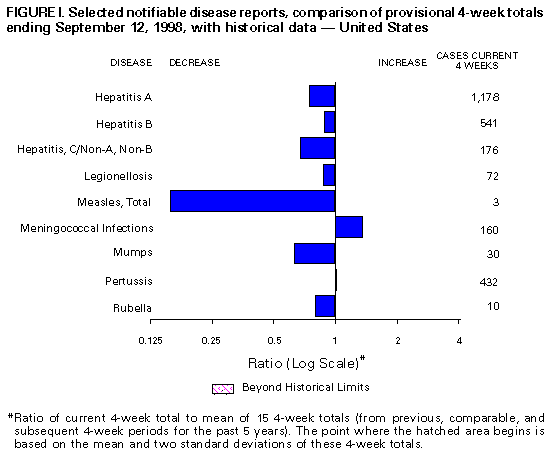
Persons using assistive technology might not be able to fully access information in this file. For assistance, please send e-mail to: mmwrq@cdc.gov. Type 508 Accommodation and the title of the report in the subject line of e-mail. Notifiable Diseases/Deaths in Selected Cities Weekly InformationFigure_I Selected notifiable disease reports, comparison of provisional 4-week totals ending September 12, 1998, with historical data -- United States Table_I Summary -- provisional cases of selected notifiable diseases, United States, cumulative, week ending September 12, 1998 (36th Week) Table_II Provisional cases of selected notifiable diseases, United States, weeks ending September 12, 1998 and September 6, 1997 (36th Week) Table_III Provisional cases of selected notifiable diseases preventable by vaccination, United States, weeks ending September 12, 1998 and September 6, 1997 (36th Week) Table_IV Deaths in 122 U.S. cities, week ending
September 12, 1998 (36th Week)
TABLE I. Summary -- provisional cases of specified notifiable diseases, United
States, cumulative, week ending September 12, 1998 (36th Week)
==================================================================================
                                             Cum. 1998
------------------------------------------------------
Anthrax                                              -
Brucellosis                                         35
Cholera                                              6
Congenital rubella syndrome                          3
Cryptosporidiosis*                               2,285
Diphtheria                                           2
Encephalitis:  California*                          46
               eastern equine*                       3
               St. Louis*                            2
               western equine*                       -
Hansen Disease                                      77
Hantavirus pulmonary syndrome*+                     14
Hemolytic uremic syndrome, post-diarrheal*          48
HIV infection, pediatric*&                         164
Plague                                               6
Poliomyelitis, paralytic                             1
Psittacosis                                         29
Rabies, human                                        -
Rocky Mountain spotted fever (RMSF)                205
Streptococcal disease, invasive Group A          1,625
Streptococcal toxic-shock syndrome*                 40
Syphilis, congenital@                              268
Tetanus                                             29
Toxic-shock syndrome                                88
Trichinosis                                          9
Typhoid fever                                      231
Yellow fever                                         -
------------------------------------------------------
-: no reported cases
 * Not notifiable in all states
 + Updated weekly from reports to the Division of Viral and Rickettsial
   Diseases, National Center for Infectious Diseases (NCID).
 & Updated monthly to the Division of HIV/AIDS Prevention -- Surveillance
   and Epidemiology, National Center for HIV, STD, and TB Prevention
   (NCHSTP), last update August 30, 1998.
 @ Updated from reports to the Division of STD Prevention, NCHSTP.

==================================================================================
Return to top. Table_II Note: To print large tables and graphs users may have to change their printer settings to landscape and use a small font size.
TABLE II. (page 1) Provisional cases of selected notifiable diseases, United States, weeks ending
September 12, 1998, and September 6, 1997 (36th Week)
Escherichia
coli O157:H7
------------------- Hepatitis
AIDS* Chlamydia NETSS** PHLIS*** Gonorrhea C\NA,NB
----------------- -------------------- -------- -------- ------------------- ----------------
Cum. Cum. Cum. Cum. Cum. Cum. Cum. Cum. Cum. Cum.
Reporting Area 1998 1997 1998 1997 1998 1998 1998 1997 1998 1997
------------------------------------------------------------------------------------------------------------------------------
UNITED STATES 31,523 40,204 364,690 310,234 1,914 1,154 219,943 196,540 2,649 2,452
NEW ENGLAND 1,194 1,732 13,375 11,964 245 191 3,852 4,040 37 46
Maine 22 42 683 656 29 - 49 38 - -
N.H. 28 26 647 541 33 34 63 71 - -
Vt. 17 31 288 275 11 7 25 36 - 2
Mass. 604 598 5,747 4,925 115 113 1,484 1,488 34 37
R.I. 88 113 1,603 1,364 11 1 259 315 3 7
Conn. 435 922 4,407 4,203 46 36 1,972 2,092 - -
MID. ATLANTIC 8,893 12,414 44,301 39,553 201 50 25,299 25,774 278 226
Upstate N.Y. 1,014 1,931 N N 143 - 3,788 4,384 214 165
N.Y. City 5,005 6,451 23,649 18,608 5 7 10,415 9,351 - -
N.J. 1,655 2,598 7,566 6,803 53 33 4,852 5,261 - -
Pa. 1,219 1,434 13,086 14,142 N 10 6,244 6,778 64 61
E.N. CENTRAL 2,276 3,016 60,830 41,294 298 198 42,462 26,751 368 420
Ohio 485 663 17,261 14,849 81 44 10,964 9,734 7 13
Ind. 379 408 4,573 6,258 70 35 2,945 4,185 4 12
Ill. 888 1,176 18,045 U 72 14 14,861 U 24 69
Mich. 390 581 14,106 12,692 75 47 10,761 9,644 333 303
Wis. 134 188 6,845 7,495 N 58 2,931 3,188 - 23
W.N. CENTRAL 599 778 21,209 21,555 294 217 10,618 9,523 222 47
Minn. 119 136 4,230 4,475 120 91 1,552 1,569 8 3
Iowa 51 78 2,063 2,858 76 42 660 756 7 23
Mo. 282 377 8,180 8,177 27 43 6,051 5,074 201 8
N. Dak. 4 10 616 578 10 13 51 39 - 2
S. Dak. 13 7 1,077 850 21 21 172 92 - -
Nebr. 56 71 1,416 1,495 21 - 502 574 2 2
Kans. 74 99 3,627 3,122 19 7 1,630 1,419 4 9
S. ATLANTIC 7,960 9,668 74,976 64,320 165 102 62,023 63,037 134 159
Del. 104 174 1,721 - - 2 966 819 - -
Md. 914 1,167 5,201 4,868 25 12 5,887 7,942 7 4
D.C. 635 717 N N 1 - 2,518 3,004 - -
Va. 650 769 8,725 8,039 N 28 5,748 5,313 11 20
W. Va. 60 77 1,832 2,002 7 5 541 639 5 13
N.C. 536 597 15,164 11,669 40 34 13,139 11,437 17 38
S.C. 507 535 12,412 8,579 8 5 7,820 8,075 3 30
Ga. 846 1,161 16,173 11,324 54 - 14,401 13,228 9 -
Fla. 3,708 4,471 13,748 17,839 30 16 11,003 12,580 82 54
E.S. CENTRAL 1,273 1,366 26,980 23,782 82 28 26,359 23,815 145 258
Ky. 195 237 4,374 4,481 22 - 2,511 2,852 16 11
Tenn. 434 570 9,107 8,731 37 24 7,982 7,451 122 172
Ala. 372 334 7,054 5,759 20 2 9,008 8,111 5 7
Miss. 272 225 6,445 4,811 3 2 6,858 5,401 2 68
W.S. CENTRAL 3,799 4,171 52,810 41,314 94 12 30,842 27,538 475 312
Ark. 136 159 2,515 2,030 7 6 1,245 3,303 8 10
La. 654 733 10,379 6,404 4 2 9,006 6,047 24 144
Okla. 224 216 6,853 5,171 12 4 3,748 3,409 8 7
Tex. 2,785 3,063 33,063 27,709 71 - 16,843 14,779 435 151
MOUNTAIN 1,052 1,127 14,637 20,029 252 172 5,592 5,370 294 204
Mont. 20 33 808 717 11 - 29 33 7 15
Idaho 19 37 1,217 1,061 29 7 119 87 87 41
Wyo. 1 13 399 398 51 53 18 40 70 49
Colo. 209 292 10 4,639 50 41 1,577 1,368 20 22
N. Mex. 166 112 2,453 2,628 17 13 607 602 72 37
Ariz. 385 269 7,537 7,369 21 23 2,724 2,437 3 24
Utah 91 93 1,471 1,152 63 21 157 175 21 3
Nev. 161 278 742 2,065 10 14 361 628 14 13
PACIFIC 4,477 5,932 55,572 46,423 283 184 12,896 10,692 696 780
Wash. 303 454 7,361 6,141 59 56 1,273 1,295 15 20
Oreg. 128 222 3,915 3,328 79 81 572 504 5 3
Calif. 3,919 5,170 41,489 34,753 141 35 10,513 8,280 621 639
Alaska 17 42 1,302 1,017 4 - 223 266 1 -
Hawaii 110 44 1,505 1,184 N 12 315 347 54 118
Guam - 2 201 193 N - 24 27 - -
P.R. 1,246 1,381 U U 6 U 263 415 - -
V.I. 19 74 N N N U U U U U
Amer. Samoa - - U U N U U U U U
C.N.M.I. - 1 N N N U 25 17 - 2
------------------------------------------------------------------------------------------------------------------------------
N: Not notifiable U: Unavailable -: no reported cases C.N.M.I.: Commonwealth of North Mariana Islands
* Updated monthly to the Division of HIV/AIDS Prevention, -- Surveillance and Epidemiology, National Center for HIV, STD,
and TB Prevention, last update August 30, 1998.
** National Electronic Telecommunications System for Surveillance.
*** Public Health Laboratory Information System.
=======================================================================================================================================================
TABLE II. (page 2) Provisional cases of selected notifiable diseases, United States, weeks ending
September 12, 1998, and September 6, 1997 (36th Week)
Lyme Syphilis Rabies,
Legionellosis Disease Malaria (Primary & Secondary) Tuberculosis Animal
---------------- ---------------- ---------------- --------------------- ----------------- -------
Cum. Cum. Cum. Cum. Cum. Cum. Cum. Cum. Cum. Cum. Cum.
Reporting Area 1998 1997 1998 1997 1998 1997 1998 1997 1998 * 1997 1998
-------------------------------------------------------------------------------------------------------------------------------------------
UNITED STATES 833 623 8,195 7,568 868 1,261 4,943 5,886 9,877 12,160 4,928
NEW ENGLAND 53 54 2,109 2,060 43 67 53 107 319 302 1,012
Maine 1 2 6 8 4 1 1 - 5 17 150
N.H. 3 5 28 17 3 8 1 - 9 10 47
Vt. 4 10 8 6 - 2 4 - 2 4 46
Mass. 26 19 579 256 14 25 34 52 180 166 365
R.I. 10 5 323 219 4 5 1 2 38 26 63
Conn. 9 13 1,165 1,554 18 26 12 53 85 79 341
MID. ATLANTIC 205 119 5,100 4,223 217 375 181 284 1,943 2,153 1,151
Upstate N.Y. 68 32 2,895 1,744 62 52 24 29 243 292 809
N.Y. City 23 13 18 140 97 231 44 63 1,001 1,097 U
N.J. 11 17 808 1,318 34 71 55 115 422 440 142
Pa. 103 57 1,379 1,021 24 21 58 77 277 324 200
E.N. CENTRAL 251 203 80 406 83 119 679 441 826 1,238 105
Ohio 96 79 57 27 9 15 90 152 78 199 47
Ind. 47 30 17 23 10 12 141 111 78 99 9
Ill. 23 16 5 11 22 50 262 U 422 651 11
Mich. 57 49 1 22 37 30 141 93 245 203 29
Wis. 28 29 U 323 5 12 45 85 3 86 9
W.N. CENTRAL 58 36 155 82 67 41 93 129 266 386 524
Minn. 5 1 127 56 39 19 6 15 102 104 95
Iowa 7 9 20 5 7 8 - 6 27 43 119
Mo. 20 6 1 15 10 7 71 81 87 152 19
N. Dak. - 2 - - 2 2 - - 7 8 102
S. Dak. 3 2 - 1 - - 1 - 14 9 109
Nebr. 16 12 3 2 1 1 4 2 11 14 6
Kans. 7 4 4 3 8 4 11 25 18 56 74
S. ATLANTIC 101 82 553 552 204 218 2,041 2,414 1,403 2,265 1,451
Del. 9 8 12 104 2 4 17 17 U 22 17
Md. 21 14 403 355 61 66 463 667 197 218 340
D.C. 6 3 4 7 14 12 53 82 72 73 -
Va. 16 18 48 37 39 51 109 170 187 220 418
W. Va. N N 8 3 1 - 2 3 30 44 61
N.C. 8 11 41 24 16 12 521 605 278 302 136
S.C. 7 3 3 2 5 11 195 269 196 230 104
Ga. 7 - 5 1 25 25 524 381 355 417 223
Fla. 25 25 29 19 41 37 157 220 70 739 152
E.S. CENTRAL 49 41 60 65 22 27 837 1,277 752 908 210
Ky. 23 8 13 12 4 8 77 100 116 122 28
Tenn. 14 24 32 29 11 6 397 544 227 322 109
Ala. 5 2 14 5 5 10 195 323 265 299 71
Miss. 7 7 1 19 2 3 168 310 144 165 2
W.S. CENTRAL 19 12 22 56 18 17 694 872 1,464 1,773 124
Ark. - 1 6 15 1 4 80 117 86 134 29
La. 2 2 3 2 7 8 298 256 73 158 -
Okla. 8 1 2 12 3 5 62 83 118 151 95
Tex. 9 8 11 27 7 - 254 416 1,187 1,330 -
MOUNTAIN 46 41 12 8 42 58 154 120 285 394 144
Mont. 2 1 - - 1 2 - - 16 6 39
Idaho 2 2 3 3 7 - 1 - 8 7 -
Wyo. 1 1 - 1 - 2 1 - 4 2 52
Colo. 12 15 3 - 14 26 8 10 U 62 19
N. Mex. 2 2 4 1 11 8 19 5 42 41 5
Ariz. 10 9 - 1 8 8 119 91 138 175 12
Utah 16 7 - - 1 3 3 5 43 25 16
Nev. 1 4 2 2 - 9 3 9 34 76 1
PACIFIC 51 35 104 116 172 339 211 242 2,619 2,741 207
Wash. 9 6 6 6 16 17 23 8 152 226 -
Oreg. - - 12 16 13 17 5 5 96 113 3
Calif. 40 28 85 94 139 296 181 227 2,224 2,208 182
Alaska 1 - 1 - 1 3 1 1 34 60 22
Hawaii 1 1 - - 3 6 1 1 113 134 -
Guam 2 - - - 1 - 1 3 36 13 -
P.R. - - - - - 5 148 169 68 129 39
V.I. U U U U U U U U U U U
Amer. Samoa U U U U U U U U U U U
C.N.M.I. - - - - - - 156 9 73 2 -
-------------------------------------------------------------------------------------------------------------------------------------------
N: Not notifiable U: Unavailable -: no reported cases
* Additional information about areas displaying 'U' for cumulative Tuberculosis cases can be found in Notices to Readers, MMWR Vol. 47, No. 2, p. 39.
=======================================================================================================================================================
Return to top. Table_III Note: To print large tables and graphs users may have to change their printer settings to landscape and use a small font size.
TABLE III. (page 1) Provisional cases of selected notifiable diseases preventable by vaccination, United
States, weeks ending September 12, 1998, and September 6, 1997 (36th Week)
Hepatitis (Viral), by type Measles (Rubeola)
H. influenzae, --------------------------------------- ------------------------------------------------------------
invasive A B Indigenous Imported** Total
---------------- ----------------- ----------------- --------------- --------------- ---------------
Cum. Cum. Cum. Cum. Cum. Cum. Cum. Cum. Cum. Cum.
Reporting Area 1998* 1997 1998 1997 1998 1997 1998 1998 1998 1998 1998 1997
-----------------------------------------------------------------------------------------------------------------------------------------------------
UNITED STATES 760 771 14,995 18,954 5,656 6,444 1 31 - 19 50 110
NEW ENGLAND 50 44 183 474 122 120 - 1 - 2 3 19
Maine 2 4 16 47 2 6 - - - - - 1
N.H. 7 6 8 22 11 9 - - - - - 1
Vt. 5 3 13 9 3 6 - - - 1 1 -
Mass. 32 27 62 198 32 52 - 1 - 1 2 16
R.I. 3 2 12 107 56 12 - - - - - -
Conn. 1 2 72 91 18 35 - - - - - 1
MID. ATLANTIC 107 118 1,022 1,480 792 948 - 9 - 4 13 23
Upstate N.Y. 44 35 248 227 212 198 - 2 - - 2 5
N.Y. City 21 31 241 665 198 351 - - - - - 7
N.J. 37 37 238 216 144 177 - 7 - 1 8 3
Pa. 5 15 295 372 238 222 - - - 3 3 8
E.N. CENTRAL 128 129 2,227 1,966 596 1,041 - 11 - 3 14 10
Ohio 42 71 235 238 56 59 - - - 1 1 -
Ind. 35 13 112 211 72 76 - 2 - 1 3 -
Ill. 44 30 376 530 116 199 - - - - - 7
Mich. 3 15 1,380 846 326 305 - 9 - 1 10 2
Wis. 4 - 124 141 26 402 - - - - - 1
W.N. CENTRAL 71 39 1,021 1,495 289 339 1 1 - - 1 13
Minn. 55 27 95 133 34 27 - - - - - 4
Iowa 2 5 378 308 48 26 1 1 - - 1 -
Mo. 8 4 416 758 173 246 - - - - - 1
N. Dak. - - 3 10 4 4 - - - - - -
S. Dak. - 2 21 18 2 1 - - - - - 8
Nebr. - 1 29 69 9 12 U - U - - -
Kans. 6 - 79 199 19 23 - - - - - -
S. ATLANTIC 153 118 1,276 1,166 819 844 - 3 - 5 8 11
Del. - - 3 23 - 4 - - - 1 1 -
Md. 43 44 220 141 116 115 - - - 1 1 2
D.C. - - 42 17 10 25 - - - - - 1
Va. 14 11 158 151 75 86 - - - 2 2 1
W. Va. 4 3 3 8 5 11 - - - - - -
N.C. 23 17 81 138 159 180 - - - - - 2
S.C. 3 4 24 76 26 77 - - - - - 1
Ga. 33 23 365 265 124 94 - 1 - 1 2 1
Fla. 33 16 380 347 304 252 - 2 - - 2 3
E.S. CENTRAL 41 40 281 450 275 498 - - - 2 2 1
Ky. 7 6 18 57 32 28 - - - - - -
Tenn. 22 24 165 276 192 323 - - - 1 1 -
Ala. 10 8 55 65 50 49 - - - 1 1 1
Miss. 2 2 43 52 1 98 - - - - - -
W.S. CENTRAL 46 36 2,934 3,809 968 789 - 1 - - 1 7
Ark. - 2 75 164 65 61 - - - - - -
La. 22 8 53 147 68 95 - 1 - - 1 -
Okla. 21 24 414 1,099 59 35 - - - - - -
Tex. 3 2 2,392 2,399 776 598 - - - - - 7
MOUNTAIN 76 70 2,225 2,967 588 609 - - - - - 8
Mont. - - 73 58 5 7 - - - - - -
Idaho - 1 194 100 25 26 - - - - - -
Wyo. 1 3 29 24 4 22 - - - - - -
Colo. 17 13 208 304 84 113 - - - - - -
N. Mex. 6 7 109 231 244 185 - - - - - -
Ariz. 41 28 1,371 1,500 138 140 U - U - - 5
Utah 4 3 153 435 56 69 - - - - - 1
Nev. 7 15 88 315 32 47 U - U - - 2
PACIFIC 88 177 3,826 5,147 1,207 1,256 - 5 - 3 8 18
Wash. 7 3 752 373 77 52 - - - 1 1 2
Oreg. 34 29 265 260 77 82 - - - - - -
Calif. 39 134 2,760 4,385 1,039 1,103 - 4 - 2 6 12
Alaska 1 4 15 25 9 11 - 1 - - 1 -
Hawaii 7 7 34 104 5 8 - - - - - 4
Guam - - - - 2 3 U - U - - -
P.R. 2 - 49 220 319 520 - - - - - -
V.I. U U U U U U U U U U U U
Amer. Samoa U U U U U U U U U U U U
C.N.M.I. - 6 3 1 45 34 U - U - - 1
-----------------------------------------------------------------------------------------------------------------------------------------------------
N: Not notifiable U: Unavailable -: no reported cases
* Of 182 cases among children aged <5 years, serotype was reported for 102 and of those, 39 were type b.
** For imported measles, cases include only those resulting from importation from other countries.
=======================================================================================================================================================
TABLE III. (page 2) Provisional cases of selected notifiable diseases preventable by vaccination, United
States, weeks ending September 12, 1998, and September 6, 1997 (36th Week)
Meningococcal
Disease Mumps Pertussis Rubella
----------------- -------------------------- --------------------------- ---------------------------
Cum. Cum. Cum. Cum. Cum. Cum. Cum. Cum.
Reporting Area 1998 1997 1998 1998 1997 1998 1998 1997 1998 1998 1997
------------------------------------------------------------------------------------------------------------------------------------------
UNITED STATES 1,939 2,389 4 344 422 93 3,629 3,680 1 311 131
NEW ENGLAND 77 150 1 4 8 17 612 673 - 38 1
Maine 5 17 - - - - 5 7 - - -
N.H. 4 12 - - - 7 60 85 - - -
Vt. 1 4 - - - 4 63 187 - - -
Mass. 39 74 - 2 2 3 443 367 - 8 1
R.I. 3 15 - - 5 - 7 12 - 1 -
Conn. 25 28 1 2 1 3 34 15 - 29 -
MID. ATLANTIC 179 248 - 19 46 14 382 273 1 125 31
Upstate N.Y. 46 68 - 4 10 2 203 107 1 111 4
N.Y. City 20 42 - 4 3 - 9 58 - 9 27
N.J. 47 46 - 2 7 - 5 12 - 4 -
Pa. 66 92 - 9 26 12 165 96 - 1 -
E.N. CENTRAL 291 352 - 59 53 16 386 390 - - 5
Ohio 111 129 - 23 19 6 189 109 - - -
Ind. 51 38 - 5 7 7 83 38 - - -
Ill. 71 103 - 10 8 - 47 53 - - 1
Mich. 33 52 - 21 16 3 50 47 - - -
Wis. 25 30 - - 3 - 17 143 - - 4
W.N. CENTRAL 158 171 - 25 13 9 294 252 - 27 -
Minn. 28 29 - 12 5 9 177 160 - - -
Iowa 31 39 - 9 6 - 53 17 - - -
Mo. 56 73 - 3 - - 22 47 - 2 -
N. Dak. 3 2 - 1 - - 2 1 - - -
S. Dak. 6 4 - - - - 8 4 - - -
Nebr. 8 8 U - 1 U 10 5 U - -
Kans. 26 16 - - 1 - 22 18 - 25 -
S. ATLANTIC 336 405 1 42 51 4 228 319 - 13 60
Del. 1 5 - - - - 3 1 - - -
Md. 24 37 - - 1 2 40 98 - 1 -
D.C. - 7 - - - - 1 3 - - -
Va. 27 40 - 6 9 - 19 34 - - 1
W. Va. 12 14 - - - - 1 6 - - -
N.C. 47 77 - 10 9 1 75 89 - 9 52
S.C. 47 42 1 6 10 - 22 20 - - 6
Ga. 72 77 - 1 6 - 18 8 - - -
Fla. 106 106 - 19 16 1 49 60 - 3 1
E.S. CENTRAL 175 182 - 13 22 2 83 100 - 2 1
Ky. 21 38 - - 3 - 25 42 - - -
Tenn. 55 61 - 1 3 - 31 29 - 1 -
Ala. 76 60 - 7 6 2 24 19 - 1 1
Miss. 23 23 - 5 10 - 3 10 - - -
W.S. CENTRAL 231 221 - 50 44 4 248 164 - 87 4
Ark. 26 26 - 7 1 - 52 16 - - -
La. 51 47 - 9 11 - 5 15 - - -
Okla. 32 26 - - - - 18 24 - - -
Tex. 122 122 - 34 32 4 173 109 - 87 4
MOUNTAIN 111 140 - 28 51 16 668 873 - 5 6
Mont. 4 7 - - - - 7 15 - - -
Idaho 9 8 - 4 2 5 201 482 - - 2
Wyo. 6 2 - 1 1 - 8 6 - - -
Colo. 22 36 - 7 3 3 144 242 - - -
N. Mex. 19 24 N N N 2 78 70 - 1 -
Ariz. 35 37 U 5 31 U 142 30 U 1 4
Utah 11 11 - 4 7 6 62 14 - 2 -
Nev. 5 15 U 7 7 U 26 14 U 1 -
PACIFIC 381 520 2 104 134 11 728 636 - 14 23
Wash. 53 66 - 7 14 8 231 265 - 9 5
Oreg. 65 98 N N N 3 65 30 - - -
Calif. 256 348 1 77 94 - 413 309 - 3 10
Alaska 3 2 - 2 6 - 13 16 - - -
Hawaii 4 6 1 18 20 - 6 16 - 2 8
Guam 1 1 U 2 1 U - - U - -
P.R. 6 8 - 1 7 - 3 - - - -
V.I. U U U U U U U U U U U
Amer. Samoa U U U U U U U U U U U
C.N.M.I. - - U 2 4 U 1 - U - -
------------------------------------------------------------------------------------------------------------------------------------------
N: Not notifiable U: Unavailable -: no reported cases
=======================================================================================================================================================
Return to top. Table_IV Note: To print large tables and graphs users may have to change their printer settings to landscape and use a small font size.
TABLE IV. Deaths in 122 U.S. cities,* week ending
September 12, 1998 (36th Week)
===================================================================================================================================
All Causes, By Age (Years)
------------------------------------------------------------------------ P&I**
Reporting Area All Ages >=65 45-64 25-44 1-24 <1 Total
---------------------------------------------------------------------------------------------------------------
NEW ENGLAND 500 363 79 36 11 11 41
Boston, Mass. 141 109 19 7 5 1 14
Bridgeport, Conn. 36 26 8 2 - - 5
Cambridge, Mass. 12 9 3 - - - 1
Fall River, Mass. 31 22 5 3 1 - 1
Hartford, Conn. 49 36 6 5 - 2 2
Lowell, Mass. 20 15 4 1 - - 1
Lynn, Mass. 16 13 2 1 - - 1
New Bedford, Mass. 17 16 1 - - - -
New Haven, Conn. 35 16 11 4 3 1 -
Providence, R.I. U U U U U U U
Somerville, Mass. 5 2 2 1 - - -
Springfield, Mass. 39 30 3 4 - 2 7
Waterbury, Conn. 32 24 2 4 2 - 1
Worcester, Mass. 67 45 13 4 - 5 8
MID. ATLANTIC 1,981 1,368 387 138 45 43 94
Albany, N.Y. 38 26 5 4 - 3 2
Allentown, Pa. 29 25 3 - 1 - 1
Buffalo, N.Y. 89 59 18 10 1 1 2
Camden, N.J. 41 26 5 4 1 5 4
Elizabeth, N.J. 15 9 3 3 - - 1
Erie, Pa. 35 28 5 - - 2 3
Jersey City, N.J. U U U U U U U
New York City, N.Y. 1,071 745 212 78 21 15 39
Newark, N.J. 26 6 15 1 1 3 -
Paterson, N.J. 18 11 6 1 - - -
Philadelphia, Pa. 300 182 68 26 18 6 12
Pittsburgh, Pa.*** 40 26 7 2 - 5 1
Reading, Pa. 28 23 4 1 - - 3
Rochester, N.Y. 120 94 21 4 - 1 16
Schenectady, N.Y. 29 27 1 1 - - 2
Scranton, Pa. 23 19 3 - 1 - -
Syracuse, N.Y. 50 40 6 2 - 2 7
Trenton, N.J. 15 10 4 - 1 - 1
Utica, N.Y. 14 12 1 1 - - -
Yonkers, N.Y. U U U U U U U
E.N. CENTRAL 1,686 1,109 336 151 41 43 104
Akron, Ohio 46 35 8 1 1 1 -
Canton, Ohio 29 22 5 2 - - 2
Chicago, Ill. 350 159 90 62 12 21 22
Cincinnati, Ohio 119 88 17 6 5 3 13
Cleveland, Ohio 124 89 24 7 2 2 3
Columbus, Ohio 141 99 25 9 5 3 14
Dayton, Ohio 91 71 8 11 1 - 1
Detroit, Mich. 161 94 48 15 3 1 3
Evansville, Ind. 31 24 6 1 - - 1
Fort Wayne, Ind. 55 37 14 3 1 - 3
Gary, Ind. 10 4 4 1 - 1 1
Grand Rapids, Mich. 45 29 6 4 3 3 2
Indianapolis, Ind. 129 84 26 13 3 3 12
Lansing, Mich. 29 23 2 3 1 - 1
Milwaukee, Wis. 92 73 14 3 - 2 9
Peoria, Ill. 47 35 9 1 1 1 2
Rockford, Ill. 67 49 10 6 2 - 8
South Bend, Ind. 24 19 4 1 - - -
Toledo, Ohio 68 52 11 2 1 2 6
Youngstown, Ohio 28 23 5 - - - 1
W.N. CENTRAL 619 426 113 48 21 8 36
Des Moines, Iowa 85 54 18 10 2 1 2
Duluth, Minn. 22 18 3 1 - - 2
Kansas City, Kans. 18 13 - 2 3 - -
Kansas City, Mo. 109 73 16 8 5 5 7
Lincoln, Nebr. 31 21 9 1 - - 2
Minneapolis, Minn. 100 76 16 5 2 - 3
Omaha, Nebr. 54 34 13 1 5 1 4
St. Louis, Mo. 87 52 20 12 2 1 9
St. Paul, Minn. 62 47 10 3 2 - 6
Wichita, Kans. 51 38 8 5 - - 1
S. ATLANTIC 1,037 637 218 109 38 28 56
Atlanta, Ga. 119 73 25 15 5 1 2
Baltimore, Md. 176 110 39 20 4 3 11
Charlotte, N.C. 60 42 11 1 1 5 7
Jacksonville, Fla. 133 83 28 15 3 3 3
Miami, Fla. 96 46 22 17 6 - 1
Norfolk, Va. 36 22 6 3 2 3 3
Richmond, Va. 45 26 10 7 1 1 7
Savannah, Ga. 38 33 3 2 - - 8
St. Petersburg, Fla. 37 27 4 4 1 1 1
Tampa, Fla. 142 94 31 11 5 - 13
Washington, D.C. 133 70 35 13 4 11 -
Wilmington, Del. 22 11 4 1 6 - -
E.S. CENTRAL 717 490 147 52 12 14 36
Birmingham, Ala. 112 80 22 5 3 - 8
Chattanooga, Tenn. 69 42 19 3 2 3 2
Knoxville, Tenn. 82 58 13 7 3 1 4
Lexington, Ky. 50 36 9 4 1 - 3
Memphis, Tenn. 201 137 44 14 2 4 12
Mobile, Ala. 49 34 8 4 - 3 -
Montgomery, Ala. 35 21 9 5 - - 5
Nashville, Tenn. 119 82 23 10 1 3 2
W.S. CENTRAL 1,098 729 226 86 34 23 56
Austin, Tex. 66 40 14 4 5 3 3
Baton Rouge, La. 34 24 2 6 2 - 2
Corpus Christi, Tex. 40 32 3 3 1 1 4
Dallas, Tex. 139 76 33 18 9 3 6
El Paso, Tex. 67 52 11 3 - 1 3
Ft. Worth, Tex. 73 51 15 4 2 1 3
Houston, Tex. 242 163 52 21 3 3 17
Little Rock, Ark. 37 24 8 3 2 - 4
New Orleans, La. 95 60 24 6 3 2 -
San Antonio, Tex. 152 107 30 7 5 3 6
Shreveport, La. 34 18 8 5 - 3 3
Tulsa, Okla. 119 82 26 6 2 3 5
MOUNTAIN 783 506 154 70 30 21 43
Albuquerque, N.M. 100 66 19 13 - - 2
Boise, Idaho 43 31 8 - 1 3 3
Colo. Springs, Colo. 43 25 12 3 1 2 1
Denver, Colo. 73 38 15 9 8 3 7
Las Vegas, Nev. 148 95 35 14 2 2 5
Ogden, Utah 22 18 2 1 1 - 2
Phoenix, Ariz. 160 96 33 17 10 4 7
Pueblo, Colo. 22 17 1 3 1 - 4
Salt Lake City, Utah 89 58 15 6 5 5 5
Tucson, Ariz. 83 62 14 4 1 2 7
PACIFIC 1,500 1,060 253 120 43 24 117
Berkeley, Calif. 10 6 3 - - 1 -
Fresno, Calif. 114 72 22 9 9 2 5
Glendale, Calif. 24 18 4 1 - 1 1
Honolulu, Hawaii 76 52 17 6 - 1 7
Long Beach, Calif. 42 31 6 4 - 1 4
Los Angeles, Calif. 409 299 62 30 13 5 32
Pasadena, Calif. U U U U U U U
Portland, Oreg. 95 70 17 1 7 - 4
Sacramento, Calif. 114 73 21 16 3 1 10
San Diego, Calif. 125 85 22 12 2 4 13
San Francisco, Calif. 128 91 20 13 1 3 17
San Jose, Calif. 115 81 20 11 2 1 7
Santa Cruz, Calif. 21 15 4 1 - 1 3
Seattle, Wash. 98 70 17 8 2 1 4
Spokane, Wash. 48 39 6 2 1 - 2
Tacoma, Wash. 81 58 12 6 3 2 8
TOTAL 9,921**** 6,688 1,913 810 275 215 583
---------------------------------------------------------------------------------------------------------------
U: Unavailable -: no reported cases
* Mortality data in this table are voluntarily reported from 122 cities in the United States, most of which have populations
of 100,000 or more. A death is reported by the place of its occurrence and by the week that the death certificate was
filed. Fetal deaths are not included.
** Pneumonia and influenza.
*** Because of changes in reporting methods in this Pennsylvania city, these numbers are partial counts for the current
week. Complete counts will be available in 4 to 6 weeks.
**** Total includes unknown ages.
===================================================================================================================================
Return to top. Disclaimer All MMWR HTML versions of articles are electronic conversions from ASCII text into HTML. This conversion may have resulted in character translation or format errors in the HTML version. Users should not rely on this HTML document, but are referred to the electronic PDF version and/or the original MMWR paper copy for the official text, figures, and tables. An original paper copy of this issue can be obtained from the Superintendent of Documents, U.S. Government Printing Office (GPO), Washington, DC 20402-9371; telephone: (202) 512-1800. Contact GPO for current prices. **Questions or messages regarding errors in formatting should be addressed to mmwrq@cdc.gov.Page converted: 10/05/98 |
|||||||||
This page last reviewed 5/2/01
|