 |
|
|
|
|
|
|
| ||||||||||
|
|
|
|
|
|
|
||||
| ||||||||||
|
|
|
|
|
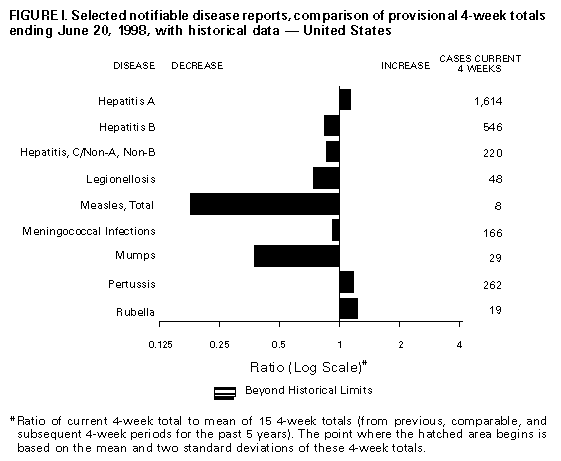
Persons using assistive technology might not be able to fully access information in this file. For assistance, please send e-mail to: mmwrq@cdc.gov. Type 508 Accommodation and the title of the report in the subject line of e-mail. Notifiable Diseases/Deaths in Selected Cities Weekly InformationFigure_I Selected notifiable disease reports, comparison of provisional 4-week totals ending June 20,1998, with historical data -- United States Table_I Summary -- provisional cases of selected notifiable diseases, United States, cumulative, week ending June 20,1998 (24th Week) Table_II Provisional cases of selected notifiable diseases, United States, weeks ending June 20,1998 and June 14, 1997 (24th Week) Table_III Provisional cases of selected notifiable diseases preventable by vaccination, United States, weeks ending June 20,1998 and June 14, 1997 (24th Week) Table_IV Deaths in 122 U.S. cities, week ending
June 20,1998 (24th Week)
TABLE I. Summary -- provisional cases of specified notifiable diseases, United
States, cumulative, week ending June 20, 1998 (24th Week)
==================================================================================
                                             Cum. 1998
------------------------------------------------------
Anthrax                                              -
Brucellosis                                         31
Cholera                                              3
Congenital rubella syndrome                          2
Cryptosporidiosis*                                 814
Diphtheria                                           1
Encephalitis:  California*                           2
               eastern equine*                       -
               St. Louis*                            -
               western equine*                       -
Hansen Disease                                      54
Hantavirus pulmonary syndrome*+                      4
Hemolytic uremic syndrome, post-diarrheal*          14
HIV infection, pediatric*&                         106
Plague                                               2
Poliomyelitis, paralytic@                            -
Psittacosis                                         20
Rabies, human                                        -
Rocky Mountain spotted fever (RMSF)                 68
Streptococcal disease, invasive Group A          1,066
Streptococcal toxic-shock syndrome*                 33
Syphilis, congenital**                             128
Tetanus                                             11
Toxic-shock syndrome                                63
Trichinosis                                          6
Typhoid fever                                      130
Yellow fever                                         -
------------------------------------------------------
-: no reported cases
 * Not notifiable in all states
 + Updated weekly from reports to the Division of Viral and Rickettsial
   Diseases, National Center for Infectious Diseases (NCID).
 & Updated monthly to the Division of HIV/AIDS Prevention -- Surveillance
   and Epidemiology, National Center for HIV, STD, and TB Prevention
   (NCHSTP), last update May 24, 1998.
 @ One suspected case(s) of polio with onset in 1998 have also been reported
   to date.
** Updated from reports to the Division of STD Prevention, NCHSTP.

==================================================================================
Return to top. Table_II Note: To print large tables and graphs users may have to change their printer settings to landscape and use a small font size.
TABLE II. (page 1) Provisional cases of selected notifiable diseases, United States, weeks ending
June 20, 1998, and June 14, 1997 (24th Week)
Escherichia
coli O157:H7
------------------- Hepatitis
AIDS* Chlamydia NETSS** PHLIS*** Gonorrhea C\NA,NB
----------------- -------------------- -------- -------- ------------------- ----------------
Cum. Cum. Cum. Cum. Cum. Cum. Cum. Cum. Cum. Cum.
Reporting Area 1998 1997 1998 1997 1998 1998 1998 1997 1998 1997
------------------------------------------------------------------------------------------------------------------------------
UNITED STATES 20,034 25,974 236,084 225,050 606 305 138,335 128,357 1,827 1,589
NEW ENGLAND 640 897 8,701 7,943 84 60 2,297 2,678 19 30
Maine 13 25 419 427 5 - 25 25 - -
N.H. 21 14 424 355 12 16 42 56 - -
Vt. 10 18 179 186 1 3 13 24 - 1
Mass. 275 416 3,874 3,279 47 30 920 1,012 18 26
R.I. 58 70 1,153 948 3 1 172 216 1 3
Conn. 263 354 2,652 2,748 16 10 1,125 1,345 - -
MID. ATLANTIC 5,695 8,265 28,966 26,631 61 10 16,020 16,156 186 158
Upstate N.Y. 710 1,336 N N 39 - 2,781 2,797 140 123
N.Y. City 3,153 4,136 15,749 13,890 3 5 6,757 6,149 - -
N.J. 993 1,783 4,626 4,706 19 4 2,631 3,336 - -
Pa. 839 1,010 8,591 8,035 N 1 3,851 3,874 46 35
E.N. CENTRAL 1,518 1,809 40,052 33,354 106 60 26,758 19,779 239 305
Ohio 281 394 11,395 10,171 26 11 6,752 6,255 6 7
Ind. 293 328 3,288 3,991 25 20 2,083 2,717 3 9
Ill. 610 602 11,444 6,018 29 - 8,995 2,940 11 50
Mich. 252 394 9,898 8,235 26 13 7,324 5,816 219 221
Wis. 82 91 4,027 4,939 N 16 1,604 2,051 - 18
W.N. CENTRAL 351 520 13,981 14,494 75 36 6,805 6,372 108 32
Minn. 56 83 2,016 3,019 30 20 708 1,050 5 2
Iowa 20 66 2,010 2,149 17 - 638 580 11 15
Mo. 176 254 5,375 5,353 10 12 3,928 3,418 88 4
N. Dak. 4 4 290 392 1 1 29 24 - 2
S. Dak. 9 2 765 563 1 1 125 57 - -
Nebr. 36 48 1,020 902 7 - 346 324 2 2
Kans. 50 63 2,505 2,116 9 2 1,031 919 2 7
S. ATLANTIC 5,037 6,477 49,873 40,021 41 16 39,972 38,291 94 104
Del. 57 111 1,172 612 - 1 637 524 - -
Md. 571 742 3,794 3,366 11 4 4,194 5,397 5 3
D.C. 413 469 N N 1 - 1,629 1,886 - -
Va. 368 552 4,623 5,205 N 7 2,759 3,607 5 10
W. Va. 47 38 1,298 1,400 N 1 370 440 4 8
N.C. 335 363 10,324 7,722 11 3 8,622 7,512 12 28
S.C. 318 295 8,650 5,657 1 - 5,586 5,115 1 24
Ga. 608 856 11,394 4,426 4 - 9,341 5,728 9 -
Fla. 2,320 3,051 8,618 11,633 12 - 6,834 8,082 58 31
E.S. CENTRAL 788 807 16,992 15,572 39 11 16,040 15,348 70 172
Ky. 101 112 2,834 3,016 10 - 1,610 1,912 11 7
Tenn. 272 354 5,934 5,823 20 10 5,024 4,792 56 105
Ala. 233 196 4,564 3,716 9 - 5,718 5,210 3 6
Miss. 182 145 3,660 3,017 U 1 3,688 3,434 U 54
W.S. CENTRAL 2,473 2,590 35,058 22,058 42 5 19,926 15,094 507 186
Ark. 81 96 1,442 1,297 1 1 1,128 2,113 3 5
La. 415 493 5,872 3,671 - 1 4,800 3,444 9 96
Okla. 134 138 4,646 3,349 6 3 2,530 2,115 2 4
Tex. 1,843 1,863 23,098 13,741 35 - 11,468 7,422 493 81
MOUNTAIN 725 751 8,007 13,358 59 41 2,953 3,500 226 145
Mont. 13 18 556 470 4 - 23 20 4 10
Idaho 14 22 874 658 6 1 78 47 86 23
Wyo. 2 13 301 255 1 - 15 25 37 36
Colo. 127 194 - 2,770 19 11 1,054 823 13 19
N. Mex. 111 66 1,772 1,865 9 6 329 418 51 30
Ariz. 286 188 3,534 5,180 N 9 1,296 1,654 3 17
Utah 57 60 717 785 13 8 66 110 19 3
Nev. 115 190 253 1,375 7 6 92 403 13 7
PACIFIC 2,807 3,858 34,454 51,619 99 66 7,564 11,139 378 457
Wash. 203 287 4,967 4,197 23 22 858 896 10 14
Oreg. 88 144 2,584 2,154 27 23 349 320 2 2
Calif. 2,463 3,377 25,060 43,858 47 18 6,010 9,510 311 359
Alaska 12 22 875 635 2 - 152 185 1 -
Hawaii 41 28 968 775 N 3 195 228 54 82
Guam - 2 8 193 N - 2 27 - -
P.R. 834 760 U U - U 187 298 - 61
V.I. 17 35 N N N U U U U U
Amer. Samoa - - U U N U U U U U
C.N.M.I. - 1 N N N U 7 16 - 2
------------------------------------------------------------------------------------------------------------------------------
N: Not notifiable U: Unavailable -: no reported cases C.N.M.I.: Commonwealth of North Mariana Islands
* Updated monthly to the Division of HIV/AIDS Prevention, -- Surveillance and Epidemiology, National Center for HIV, STD,
and TB Prevention, last update May 24, 1998.
** National Electronic Telecommunications System for Surveillance.
*** Public Health Laboratory Information System.
=======================================================================================================================================================
TABLE II. (page 2) Provisional cases of selected notifiable diseases, United States, weeks ending
June 20, 1998, and June 14, 1997 (24th Week)
Lyme Syphilis Rabies,
Legionellosis Disease Malaria (Primary & Secondary) Tuberculosis Animal
---------------- ---------------- ---------------- --------------------- ----------------- -------
Cum. Cum. Cum. Cum. Cum. Cum. Cum. Cum. Cum. Cum. Cum.
Reporting Area 1998 1997 1998 1997 1998 1997 1998 1997 1998 * 1997 1998
-------------------------------------------------------------------------------------------------------------------------------------------
UNITED STATES 466 382 2,204 1,655 494 641 3,035 3,961 3,438 9,058 3,179
NEW ENGLAND 23 27 643 402 19 31 36 77 146 197 620
Maine 1 1 1 3 3 1 1 - U 15 101
N.H. 2 4 13 7 3 2 1 - 2 6 33
Vt. 1 4 3 3 - 2 3 - 1 3 30
Mass. 9 8 125 55 11 16 22 39 119 109 200
R.I. 4 5 31 43 2 2 - 1 24 13 35
Conn. 6 5 470 291 - 8 9 37 U 51 221
MID. ATLANTIC 100 66 1,221 947 126 184 99 197 244 1,375 686
Upstate N.Y. 28 15 664 122 33 27 16 20 U 191 486
N.Y. City 19 3 3 76 60 110 22 36 U 714 U
N.J. 4 11 193 288 19 35 18 86 244 283 86
Pa. 49 37 361 461 14 12 43 55 U 187 114
E.N. CENTRAL 143 141 34 30 46 69 409 349 230 809 42
Ohio 63 62 32 12 3 6 74 109 5 146 33
Ind. 19 24 2 9 3 7 66 75 U 70 -
Ill. 14 5 - 2 15 30 157 36 225 423 2
Mich. 29 31 - 7 24 17 89 59 U 122 6
Wis. 18 19 U U 1 9 23 70 U 48 1
W.N. CENTRAL 34 26 21 20 30 19 70 76 116 228 330
Minn. 3 1 9 11 13 5 3 13 U 64 63
Iowa 4 7 9 - 3 6 - 3 U 20 73
Mo. 12 2 - 7 10 5 54 39 80 91 17
N. Dak. - 2 - - 2 - - - U 5 64
S. Dak. - 1 - - - - 1 - 13 4 54
Nebr. 12 10 1 1 - 1 4 1 5 6 2
Kans. 3 3 2 1 2 2 8 20 18 38 57
S. ATLANTIC 60 51 197 160 118 109 1,279 1,603 662 1,390 1,005
Del. 7 5 4 32 1 2 15 14 - 14 17
Md. 12 11 136 102 41 40 306 448 132 136 245
D.C. 4 3 4 6 7 7 36 61 53 46 -
Va. 5 10 14 2 19 26 84 130 118 140 317
W. Va. N N 4 - - - 2 3 24 24 41
N.C. 6 6 9 7 8 7 353 326 193 172 136
S.C. 5 2 1 1 4 7 148 197 142 113 72
Ga. 1 - 2 1 15 13 231 283 U 260 81
Fla. 19 14 23 9 23 7 104 141 U 485 96
E.S. CENTRAL 19 19 23 35 13 15 523 858 160 561 121
Ky. 11 6 6 5 1 4 58 72 U 80 19
Tenn. 5 6 8 12 8 4 265 355 U 208 70
Ala. 3 2 9 4 4 4 121 222 160 181 32
Miss. U 5 U 14 U 3 79 209 U 92 U
W.S. CENTRAL 16 5 10 10 17 7 389 526 53 1,146 103
Ark. - - 5 3 1 1 52 87 53 98 21
La. 1 1 - 1 4 4 134 185 - 85 -
Okla. 6 1 - 2 2 2 24 56 U 87 82
Tex. 9 3 5 4 10 - 179 198 U 876 -
MOUNTAIN 29 25 3 5 24 35 87 84 194 245 74
Mont. 1 1 - - - 2 - - 12 6 26
Idaho - 2 1 - 3 - - - 4 5 -
Wyo. 1 1 - 1 - 2 1 - 2 2 39
Colo. 5 5 1 2 7 16 7 2 U 48 1
N. Mex. 2 1 - - 9 5 12 4 27 17 -
Ariz. 4 7 - 1 4 4 62 69 92 111 7
Utah 15 5 - - 1 2 3 3 28 10 1
Nev. 1 3 1 1 - 4 2 6 29 46 -
PACIFIC 42 22 52 46 101 172 143 191 1,633 3,107 198
Wash. 4 6 1 1 9 8 9 6 17 128 -
Oreg. - - 8 9 9 10 2 4 U 68 -
Calif. 37 15 43 36 82 148 132 179 1,520 2,778 181
Alaska - - - - - 3 - 1 20 42 17
Hawaii 1 1 - - 1 3 - 1 76 91 -
Guam - - - - - - - 3 - 13 -
P.R. - - - - - 3 109 101 46 88 27
V.I. U U U U U U U U U U U
Amer. Samoa U U U U U U U U U U U
C.N.M.I. - - - - - - 1 7 8 - -
-------------------------------------------------------------------------------------------------------------------------------------------
N: Not notifiable U: Unavailable -: no reported cases
* Additional information about areas displaying 'U' for cumulative Tuberculosis cases can be found in Notices to Readers, MMWR Vol. 47, No. 2, p. 39.
=======================================================================================================================================================
Return to top. Table_III Note: To print large tables and graphs users may have to change their printer settings to landscape and use a small font size.
TABLE III. (page 1) Provisional cases of selected notifiable diseases preventable by vaccination, United
States, weeks ending June 20, 1998, and June 14, 1997 (24th Week)
Hepatitis (Viral), by type Measles (Rubeola)
H. influenzae, --------------------------------------- ------------------------------------------------------------
invasive A B Indigenous Imported** Total
---------------- ----------------- ----------------- --------------- --------------- ---------------
Cum. Cum. Cum. Cum. Cum. Cum. Cum. Cum. Cum. Cum.
Reporting Area 1998* 1997 1998 1997 1998 1997 1998 1998 1998 1998 1998 1997
-----------------------------------------------------------------------------------------------------------------------------------------------------
UNITED STATES 526 562 10,113 12,822 3,538 4,250 - 23 1 13 36 72
NEW ENGLAND 30 32 128 300 50 78 - - - 1 1 10
Maine 2 3 13 41 - 5 - - - - - -
N.H. 5 4 7 17 9 5 - - - - - 1
Vt. 2 2 10 7 1 3 - - - - - -
Mass. 19 20 38 148 15 35 - - - 1 1 8
R.I. 2 2 9 26 25 8 - - - - - -
Conn. - 1 51 61 - 22 - - - - - 1
MID. ATLANTIC 74 69 636 1,123 511 645 - 9 - 2 11 16
Upstate N.Y. 29 6 152 137 143 116 - 2 - - 2 4
N.Y. City 13 22 174 495 132 262 - - - - - 5
N.J. 28 25 140 166 90 125 - 7 - 1 8 2
Pa. 4 16 170 325 146 142 U - U 1 1 5
E.N. CENTRAL 82 85 1,249 1,382 351 722 - 9 1 3 12 7
Ohio 34 42 159 192 33 41 - - 1 1 1 -
Ind. 24 8 73 141 26 52 U 2 U 1 3 -
Ill. 23 24 218 340 66 140 - - - - - 5
Mich. - 11 713 606 210 225 - 7 - 1 8 2
Wis. 1 - 86 103 16 264 - - - - - -
W.N. CENTRAL 39 27 828 926 155 249 - - - - - 11
Minn. 25 18 60 86 16 18 - - - - - 2
Iowa 1 3 365 133 26 19 - - - - - -
Mo. 8 3 325 500 86 187 - - - - - 1
N. Dak. - - 3 9 4 1 - - - - - -
S. Dak. - 2 8 13 1 - - - - - - 8
Nebr. - 1 15 38 7 8 - - - - - -
Kans. 5 - 52 147 15 16 - - - - - -
S. ATLANTIC 111 97 886 656 505 498 - 2 - 5 7 3
Del. - - 2 13 - 3 - - - 1 1 -
Md. 34 40 162 110 79 75 - - - 1 1 1
D.C. - - 28 14 6 21 - - - - - 1
Va. 12 6 124 87 51 57 - - - 2 2 -
W. Va. 4 3 1 6 3 8 - - - - - -
N.C. 13 16 48 103 82 108 - - - - - 1
S.C. 4 3 16 64 3 57 - - - - - -
Ga. 23 20 236 120 82 47 - - - 1 1 -
Fla. 21 9 269 139 199 122 - 2 - - 2 -
E.S. CENTRAL 31 36 171 320 187 315 - - - - - 1
Ky. 4 4 10 38 22 19 - - - - - -
Tenn. 20 22 117 194 134 205 - - - - - -
Ala. 7 8 44 49 31 32 - - - - - 1
Miss. U 2 U 39 U 59 U U U U U -
W.S. CENTRAL 29 26 1,986 2,554 598 496 - - - - - 4
Ark. - 1 40 119 34 34 - - - - - -
La. 13 6 40 106 45 57 - - - - - -
Okla. 14 17 269 789 31 17 - - - - - -
Tex. 2 2 1,637 1,540 488 388 - - - - - 4
MOUNTAIN 65 64 1,606 1,901 396 409 - - - - - 7
Mont. - - 51 49 3 5 - - - - - -
Idaho - 1 126 76 17 14 - - - - - -
Wyo. - 1 23 19 2 14 - - - - - -
Colo. 14 9 123 219 46 80 - - - - - -
N. Mex. 5 6 82 147 161 139 - - - - - -
Ariz. 36 23 1,025 871 107 84 - - - - - 5
Utah 4 3 108 331 37 48 - - - - - -
Nev. 6 21 68 189 23 25 U - U - - 2
PACIFIC 65 126 2,623 3,660 785 838 - 3 - 2 5 13
Wash. 3 2 556 251 61 34 - - - 1 1 -
Oreg. 29 22 194 189 53 55 - - - - - -
Calif. 27 97 1,839 3,125 660 732 - 3 - 1 4 10
Alaska 1 1 11 22 6 11 - - - - - -
Hawaii 5 4 23 73 5 6 - - - - - 3
Guam - - - - - 3 U - U - - -
P.R. 2 - 23 172 245 660 - - - - - -
V.I. U U U U U U U U U U U U
Amer. Samoa U U U U U U U U U U U U
C.N.M.I. - 5 - 1 7 25 U - U - - 1
-----------------------------------------------------------------------------------------------------------------------------------------------------
N: Not notifiable U: Unavailable -: no reported cases
* Of 122 cases among children aged <5 years, serotype was reported for 66 and of those, 30 were type b.
** For imported measles, cases include only those resulting from importation from other countries.
=======================================================================================================================================================
TABLE III. (page 2) Provisional cases of selected notifiable diseases preventable by vaccination, United
States, weeks ending June 20, 1998, and June 14, 1997 (24th Week)
Meningococcal
Disease Mumps Pertussis Rubella
----------------- -------------------------- --------------------------- ---------------------------
Cum. Cum. Cum. Cum. Cum. Cum. Cum. Cum.
Reporting Area 1998 1997 1998 1998 1997 1998 1998 1997 1998 1998 1997
------------------------------------------------------------------------------------------------------------------------------------------
UNITED STATES 1,404 1,896 3 224 323 52 1,940 2,445 2 242 58
NEW ENGLAND 67 115 - - 7 4 322 524 - 32 -
Maine 4 11 - - - - 5 6 - - -
N.H. 4 11 - - - 2 27 61 - - -
Vt. 1 2 - - - 1 31 164 - - -
Mass. 32 62 - - 2 1 250 271 - 6 -
R.I. 3 8 - - 4 - 3 12 - - -
Conn. 23 21 - - 1 - 6 10 - 26 -
MID. ATLANTIC 139 194 - 15 34 3 249 186 1 111 13
Upstate N.Y. 36 46 - 3 5 3 120 63 1 104 2
N.Y. City 15 33 - 4 1 - 4 45 - 2 11
N.J. 37 37 - 1 6 - 5 11 - 4 -
Pa. 51 78 U 7 22 U 120 67 U 1 -
E.N. CENTRAL 202 281 - 39 36 6 182 231 - - 3
Ohio 83 103 - 19 13 5 71 68 - - -
Ind. 25 33 U 3 4 U 48 27 U - -
Ill. 47 82 - 1 8 - 14 30 - - -
Mich. 26 38 - 16 10 1 32 31 - - -
Wis. 21 25 - - 1 - 17 75 - - 3
W.N. CENTRAL 116 137 - 20 8 9 153 139 - 13 -
Minn. 19 23 - 10 3 7 86 86 - - -
Iowa 16 27 - 6 4 2 38 8 - - -
Mo. 48 64 - 3 - - 12 22 - 2 -
N. Dak. - 1 - 1 - - - 2 - - -
S. Dak. 6 4 - - - - 4 3 - - -
Nebr. 4 4 - - 1 - 5 3 - - -
Kans. 23 14 - - - - 8 15 - 11 -
S. ATLANTIC 248 315 1 32 36 4 121 195 1 6 17
Del. 1 4 - - - - 1 - - - -
Md. 22 31 - - 1 - 25 74 - - -
D.C. - 5 - - - - 1 2 - - -
Va. 22 31 - 4 4 - 6 19 - - 1
W. Va. 7 13 - - - - 1 4 - - -
N.C. 34 55 - 7 7 - 42 46 - 3 10
S.C. 37 38 - 4 9 - 13 9 - - 6
Ga. 55 60 - 1 5 1 4 6 - - -
Fla. 70 78 1 16 10 3 28 35 1 3 -
E.S. CENTRAL 103 134 1 1 19 - 48 44 - - 1
Ky. 16 35 - - 3 - 18 11 - - -
Tenn. 40 43 1 1 3 - 17 15 - - -
Ala. 47 39 - - 6 - 13 12 - - 1
Miss. U 17 U U 7 U U 6 U U -
W.S. CENTRAL 155 187 - 31 40 1 124 70 - 62 3
Ark. 22 25 - - - - 16 4 - - -
La. 35 33 - 2 11 - 1 11 - - -
Okla. 26 23 - - - - 13 8 - - -
Tex. 72 106 - 29 29 1 94 47 - 62 3
MOUNTAIN 83 114 - 21 44 16 435 660 - 5 4
Mont. 2 7 - - - - 1 7 - - -
Idaho 4 7 - 3 2 1 177 429 - - 1
Wyo. 3 1 - 1 1 - 7 4 - - -
Colo. 19 31 - 4 3 5 85 159 - - -
N. Mex. 15 19 N N N 2 64 32 - 1 -
Ariz. 28 26 - 4 27 7 68 15 - 1 3
Utah 9 11 - 3 6 1 22 4 - 2 -
Nev. 3 12 U 6 5 U 11 10 U 1 -
PACIFIC 291 419 1 65 99 9 306 396 - 13 17
Wash. 38 51 - 5 12 5 136 177 - 9 3
Oreg. 55 85 N N N - 17 23 - - -
Calif. 193 280 1 45 71 4 147 185 - 2 7
Alaska 1 1 - 2 5 - 2 2 - - -
Hawaii 4 2 - 13 11 - 4 9 - 2 7
Guam - 1 U - 1 U - - U - -
P.R. 4 9 - 1 4 - 2 - - - -
V.I. U U U U U U U U U U U
Amer. Samoa U U U U U U U U U U U
C.N.M.I. - - U - 4 U - - U - -
------------------------------------------------------------------------------------------------------------------------------------------
N: Not notifiable U: Unavailable -: no reported cases
=======================================================================================================================================================
Return to top. Table_IV Note: To print large tables and graphs users may have to change their printer settings to landscape and use a small font size.
TABLE IV. Deaths in 122 U.S. cities,* week ending
June 20, 1998 (24th Week)
===================================================================================================================================
All Causes, By Age (Years)
------------------------------------------------------------------------ P&I**
Reporting Area All Ages >=65 45-64 25-44 1-24 <1 Total
---------------------------------------------------------------------------------------------------------------
NEW ENGLAND 508 359 92 33 11 13 35
Boston, Mass. 119 77 27 5 5 5 13
Bridgeport, Conn. 41 33 5 3 - - 1
Cambridge, Mass. 18 14 2 2 - - 2
Fall River, Mass. 29 23 4 2 - - -
Hartford, Conn. 41 26 8 5 1 1 -
Lowell, Mass. 27 16 7 4 - - 1
Lynn, Mass. 13 11 - 2 - - -
New Bedford, Mass. 16 12 3 1 - - 2
New Haven, Conn. 34 27 4 2 - 1 3
Providence, R.I. 49 39 6 - 2 2 2
Somerville, Mass. 0 0 - - - - -
Springfield, Mass. 35 18 10 2 1 4 2
Waterbury, Conn. 25 20 3 1 1 - 3
Worcester, Mass. 60 42 13 4 1 - 6
MID. ATLANTIC 2,043 1,428 396 155 32 31 82
Albany, N.Y. 53 38 10 1 1 3 2
Allentown, Pa. 18 15 2 1 - - -
Buffalo, N.Y. 88 69 13 1 5 - 2
Camden, N.J. 28 16 7 5 - - 3
Elizabeth, N.J. 19 10 5 4 - - -
Erie, Pa. 35 30 5 - - - -
Jersey City, N.J. 34 19 7 7 1 - -
New York City, N.Y. 1,064 741 209 78 15 21 39
Newark, N.J. 60 27 17 11 4 - 1
Paterson, N.J. 21 13 5 2 1 - -
Philadelphia, Pa. 200 129 42 22 4 3 11
Pittsburgh, Pa.*** 92 64 19 6 1 2 3
Reading, Pa. 23 19 4 - - - 1
Rochester, N.Y. 113 86 17 8 - 2 4
Schenectady, N.Y. 33 26 5 2 - - 2
Scranton, Pa. 31 26 5 - - - -
Syracuse, N.Y. 92 70 17 5 - - 14
Trenton, N.J. 19 14 4 1 - - -
Utica, N.Y. 20 16 3 1 - - -
Yonkers, N.Y. U U U U U U U
E.N. CENTRAL 1,950 1,313 393 151 47 43 102
Akron, Ohio 38 26 12 - - - -
Canton, Ohio 34 31 2 - 1 - 2
Chicago, Ill. 393 234 91 43 12 11 28
Cincinnati, Ohio 89 65 15 6 1 2 7
Cleveland, Ohio 109 70 25 9 2 3 -
Columbus, Ohio 192 121 48 14 7 2 16
Dayton, Ohio 120 83 23 11 2 1 5
Detroit, Mich. 197 119 53 13 8 3 7
Evansville, Ind. 37 30 4 2 - 1 2
Fort Wayne, Ind. 44 38 4 1 1 - 2
Gary, Ind. 12 8 4 - - - 1
Grand Rapids, Mich. 62 48 7 4 1 2 7
Indianapolis, Ind. 178 126 36 10 3 3 -
Lansing, Mich. 47 36 8 2 1 - 5
Milwaukee, Wis. 107 71 21 8 2 5 8
Peoria, Ill. 41 30 5 4 - 2 2
Rockford, Ill. 48 28 13 6 - 1 4
South Bend, Ind. 53 39 6 5 1 2 2
Toledo, Ohio 79 59 8 4 5 3 2
Youngstown, Ohio 70 51 8 9 - 2 2
W.N. CENTRAL 753 536 107 49 23 28 46
Des Moines, Iowa U U U U U U U
Duluth, Minn. 32 24 7 - 1 - 2
Kansas City, Kans. 28 21 3 2 1 1 -
Kansas City, Mo. 107 70 10 10 4 3 4
Lincoln, Nebr. 43 35 6 1 1 - 3
Minneapolis, Minn. 188 138 26 15 3 6 11
Omaha, Nebr. 95 71 12 4 2 6 6
St. Louis, Mo. 111 65 23 9 5 9 12
St. Paul, Minn. 84 62 9 5 6 2 7
Wichita, Kans. 65 50 11 3 - 1 1
S. ATLANTIC 1,630 1,023 375 152 46 33 87
Atlanta, Ga. 560 340 134 64 13 9 15
Baltimore, Md. 211 119 51 28 10 2 25
Charlotte, N.C. 93 66 18 5 1 3 13
Jacksonville, Fla. 130 84 32 8 3 3 7
Miami, Fla. 110 82 19 5 4 - -
Norfolk, Va. 52 33 8 5 3 3 3
Richmond, Va. 56 36 16 2 - 2 1
Savannah, Ga. 48 29 13 3 2 1 -
St. Petersburg, Fla. 53 42 6 4 1 - 7
Tampa, Fla. 172 110 43 11 3 5 14
Washington, D.C. 135 80 27 17 6 5 2
Wilmington, Del. 10 2 8 - - - -
E.S. CENTRAL 795 540 162 55 15 22 48
Birmingham, Ala. 174 115 35 14 4 5 15
Chattanooga, Tenn. 66 48 13 1 3 1 5
Knoxville, Tenn. 64 50 11 3 - - 7
Lexington, Ky. 64 46 13 2 - 3 4
Memphis, Tenn. 178 115 32 16 7 8 11
Mobile, Ala. 87 60 22 3 - 2 -
Montgomery, Ala. 39 22 9 8 - - 2
Nashville, Tenn. 123 84 27 8 1 3 4
W.S. CENTRAL 1,309 842 262 128 43 34 69
Austin, Tex. 75 52 15 6 1 1 6
Baton Rouge, La. 36 10 14 7 3 2 -
Corpus Christi, Tex. 46 36 5 1 1 3 6
Dallas, Tex. 174 114 26 18 10 6 7
El Paso, Tex. 63 42 13 5 1 2 4
Ft. Worth, Tex. 95 68 14 10 2 1 2
Houston, Tex. 361 214 83 48 10 6 23
Little Rock, Ark. 60 33 15 7 2 3 -
New Orleans, La. 107 57 25 15 4 6 -
San Antonio, Tex. 186 140 31 7 6 2 16
Shreveport, La. U U U U U U U
Tulsa, Okla. 106 76 21 4 3 2 5
MOUNTAIN 1,038 688 188 101 30 30 60
Albuquerque, N.M. 113 72 24 14 1 2 4
Boise, Idaho 36 26 5 1 - 4 1
Colo. Springs, Colo. 55 32 13 7 - 3 5
Denver, Colo. 111 75 12 12 4 8 5
Las Vegas, Nev. 189 123 39 19 8 - 13
Ogden, Utah 24 19 2 2 1 - 4
Phoenix, Ariz. 225 136 46 26 8 8 12
Pueblo, Colo. 30 23 5 2 - - 2
Salt Lake City, Utah 112 75 20 10 3 4 6
Tucson, Ariz. 143 107 22 8 5 1 8
PACIFIC 1,842 1,334 332 105 33 38 127
Berkeley, Calif. 16 12 4 - - - -
Fresno, Calif. 108 81 16 7 3 1 -
Glendale, Calif. 40 34 6 - - - 3
Honolulu, Hawaii 67 49 12 2 2 2 3
Long Beach, Calif. 73 51 18 3 - 1 11
Los Angeles, Calif. 503 368 86 30 9 10 24
Pasadena, Calif. 23 16 5 1 - 1 1
Portland, Oreg. 100 78 11 4 4 3 9
Sacramento, Calif. 162 119 34 8 1 - 19
San Diego, Calif. 145 98 31 11 2 3 13
San Francisco, Calif. 136 92 30 8 2 4 18
San Jose, Calif. 158 119 25 6 4 4 9
Santa Cruz, Calif. 29 20 7 2 - - 3
Seattle, Wash. 136 85 29 14 5 3 1
Spokane, Wash. 59 48 5 4 - 2 7
Tacoma, Wash. 87 64 13 5 1 4 6
TOTAL 11,868**** 8,063 2,307 929 280 272 656
---------------------------------------------------------------------------------------------------------------
U: Unavailable -: no reported cases
* Mortality data in this table are voluntarily reported from 122 cities in the United States, most of which have populations
of 100,000 or more. A death is reported by the place of its occurrence and by the week that the death certificate was
filed. Fetal deaths are not included.
** Pneumonia and influenza.
*** Because of changes in reporting methods in this Pennsylvania city, these numbers are partial counts for the current
week. Complete counts will be available in 4 to 6 weeks.
**** Total includes unknown ages.
===================================================================================================================================
Return to top. Disclaimer All MMWR HTML versions of articles are electronic conversions from ASCII text into HTML. This conversion may have resulted in character translation or format errors in the HTML version. Users should not rely on this HTML document, but are referred to the electronic PDF version and/or the original MMWR paper copy for the official text, figures, and tables. An original paper copy of this issue can be obtained from the Superintendent of Documents, U.S. Government Printing Office (GPO), Washington, DC 20402-9371; telephone: (202) 512-1800. Contact GPO for current prices. **Questions or messages regarding errors in formatting should be addressed to mmwrq@cdc.gov.Page converted: 10/05/98 |
|||||||||
This page last reviewed 5/2/01
|