 |
|
|
|
|
|
|
| ||||||||||
|
|
|
|
|
|
|
||||
| ||||||||||
|
|
|
|
|
Persons using assistive technology might not be able to fully access information in this file. For assistance, please send e-mail to: mmwrq@cdc.gov. Type 508 Accommodation and the title of the report in the subject line of e-mail. Adult Blood Lead Epidemiology and Surveillance -- United States, Third Quarter, 1997CDC's National Institute for Occupational Safety and Health (NIOSH) Adult Blood Lead Epidemiology and Surveillance program (ABLES) monitors laboratory-reported elevated blood lead levels (BLLs) among adults in the United States. During 1997, a total of 27 states reported surveillance data to ABLES. * This report presents ABLES data for the first three quarters of 1997 and compares these data with the first three quarters of 1996. During July-September 1996 and 1997, reports from the same 27 states of BLLs greater than or equal to 25 ug/dL increased 6%, from 4879 to 5193, respectively (1). ** This quarterly increase followed an increase of 18%, from 5552 to 6564, during the first quarter and a decrease of 7%, from 6120 to 5709, during the second quarter of 1997 compared with the second quarter of 1996. These numbers reflect updated data from Alabama and Ohio for both 1997 and 1996 (2,3). ** The overall increase for the first three quarters of 1997 compared with the first three quarters of 1996 was 6% (Table_1); in comparison, the long-term trend had reflected a decrease during 1993-1996 (1,2,4) among adults in the United States (5). However, this 6% increase was not uniform; 14 states reported increases, nine states reported decreases, and four remained the same or did not report during both years (Figure_1). Reported by: JP Lofgren, MD, Alabama Dept of Public Health. K Schaller, Arizona Dept of Health Svcs. S Payne, MA, Occupational Lead Poisoning Prevention Program, California Dept of Health Svcs. BC Jung, MPH, Div of Environmental Epidemiology and Occupational Health, Connecticut Dept of Public Health. R Gergely, Iowa Dept of Public Health. A Hawkes, MD, Occupational Health Program, Maine Bur of Health. E Keyvan-Larijani, MD, Lead Poisoning Prevention Program, Maryland Dept of the Environment and Mental Hygiene. R Rabin, MSPH, Div of Occupational Safety, Massachusetts Dept of Labor and Industries. M Scoblic, MN, Michigan Dept of Public Health. M Falken, PhD, Minnesota Dept of Health. L Thistle-Elliott, MEd, Div of Public Health Svcs, New Hampshire State Dept of Health and Human Svcs. B Gerwel, MD, Occupational Disease Prevention Project, New Jersey State Dept of Health. R Prophet, PhD, New Mexico Dept of Health. R Stone, PhD, New York State Dept of Health. S Randolph, MSN, North Carolina Dept of Health and Human Svcs. A Migliozzi, MSN, Bur of Health Risk Reduction, Ohio Dept of Health. E Rhoades, MD, Oklahoma State Dept of Health. A Sandoval, MS, State Health Div, Oregon Dept of Human Resources. J Gostin, MS, Occupational Health Program, Div of Environmental Health, Pennsylvania Dept of Health. M Stoeckel, MPH, Rhode Island and Providence Plantations Dept of Health. A Gardner-Hillian, Div of Health Hazard Evaluations, South Carolina Dept of Health and Environmental Control. P Schnitzer, PhD, Bur of Epidemiology, Texas Dept of Health. W Ball, PhD, Bur of Epidemiology, Utah Dept of Health. L Toof, Div of Epidemiology and Health Promotion, Vermont Dept of Health. J Kaufman, MD, Washington State Dept of Labor and Industries. J Tierney, Wisconsin Dept of Health and Social Svcs. T Klietz, Wyoming Dept of Health. Div of Surveillance, Hazard Evaluations, and Field Studies, National Institute for Occupational Safety and Health, CDC. Editorial NoteEditorial Note: The increase in the number of reports of elevated BLLs for the first three quarters of 1997 suggests the possible ending of the long-term decline in the overall number of detected cases of elevated BLLs among adults for 1993-1996 (1,2,4 ). Factors related to this increase might include 1) improved efforts of the participating states and lead-using industries within them to identify lead-exposed workers; 2) improved compliance with Occupational Safety and Health Administration requirements for blood lead monitoring; 3) an increase in the size of the workforce in lead-using industries; 4) changes in reporting laws or in compliance with these laws; and/or 5) increased occupational exposures to lead. Compared with the first three quarters of 1996, during the first three quarters of 1997, the number of reported cases of elevated BLLs increased in 14 states and decreased in nine (Figure_1). The effect of each of these potential explanations on changes in numbers of reports may have differed by state. Changes in reporting laws or in compliance with these laws, rather than actual changes in workers' lead exposures, frequently are responsible for quarterly increases or decreases. For example, reports from Washington increased 70% for the first three quarters of 1997 compared with the same period in 1996. Follow-up investigation revealed that two laboratories were previously unaware of the mandatory reporting law and had begun to report elevated BLLs during 1997. Similarly, reports from Michigan increased 29% for the first three quarters of 1997 after implementation of a mandatory reporting law on October 11, 1997, and education and publicity about the new law, which began early during the year. Finally, the numbers of reports from Ohio and Alabama were revised recently as previously reported backlogged reports were reallocated to the correct quarters for both 1997 and 1996. An increase of 6% during the first three quarters of 1997, compared with the first three quarters of 1996, also might have been due to normal fluctuation in nationwide reporting totals, which results from changes in staffing and funding in state-based surveillance programs, interstate differences in worker BLL testing by lead-using industries, or random variation. Continued surveillance and follow-up investigation similar to that performed in Washington are required before this three-quarter increase can be confirmed as a reversal of the previous long-term decrease. During the first three quarters of 1997, a total of 17,466 reports of BLLs greater than or equal to 25 ug/dL demonstrated the continuing hazard of lead exposures as an occupational health problem in the United States. NIOSH is seeking to enhance surveillance for this preventable condition by expanding the number of states participating in ABLES, reducing variability in reporting, and distinguishing between new and recurring elevated BLLs in adults. References
* Alabama, Arizona, California, Connecticut, Iowa, Maine, Maryland, Massachusetts, Michigan, Minnesota, New Hampshire, New Jersey, New Mexico, New York, North Carolina, Ohio, Oklahoma, Oregon, Pennsylvania, Rhode Island, South Carolina, Texas, Utah, Vermont, Washington, Wisconsin, and Wyoming. ** To compare the number of reports for a constant roster of 27 states in 1997 and 1996, data for the first three quarters of 1997 for New Mexico, Rhode Island, and Wyoming were added to the previously reported totals for the first three quarters of 1996, during which these states did not report (1). In addition, data for the first three quarters of 1996 for Illinois, which discontinued reporting at the end of 1996, were subtracted from previously reported totals for the first three quarters of 1996 (1). Alabama and Ohio updated their reports for 1996, and these updated data were incorporated. Table_1 Note: To print large tables and graphs users may have to change their printer settings to landscape and use a small font size.
TABLE 1. Number of reports of elevated blood lead levels (BLLs) among adults, number
of persons with elevated BLLs, and percentage change in number of reports --
27 states, * third quarter, 1997
=====================================================================================================
                     Third quarter, 1997         Cumulative     Cumulative        % Change from
Reported BLL     ---------------------------       reports        reports      first three quarters,
  (mg/dL)        No. reports   No. persons +       1996 &          1997           1996 to 1997
----------------------------------------------------------------------------------------------------
  25-39             4,136          3,019           12,660         13,835                9%
  40-49               784            541            2,921          2,724               -7%
  50-59               191            131              652            571              -12%
   >=60                82             57              318            336                6%

  Total             5,193          3,748           16,551         17,466                6%
----------------------------------------------------------------------------------------------------
* Alabama, Arizona, California, Connecticut, Iowa, Maine, Maryland, Massachusetts, Michigan,
  Minnesota, New Hampshire, New Jersey, New Mexico, New York, North Carolina, Ohio, Okla-
  homa, Oregon, Pennsylvania, Rhode Island, South Carolina, Texas, Utah, Vermont, Washing-
  ton, Wisconsin, and Wyoming.
+ An Individual report for a person was categorized according to the highest reported BLL for
  the person during the given quarter. Persons with elevated BLLs often have more than one
  blood test report within a quarter and several during a year. ABLES lists persons quarterly
  and annually, eliminating duplicates. To allow time for amendments to data reported in the
  fourth quarter, analysis for yearly trends in the number of persons with elevated BLLs is
  reported at the time of the first- quarter report for the subsequent year, usually in July.
& To compare the number of reports for a constant roster of 27 states in 1997 and 1996, data
  for the first three quarters of 1997 for New Mexico, Rhode Island, and Wyoming were added
  to the previously reported totals for the first three quarters of 1996, during which these states
  did not report (1). In addition, data for the first three quarters of 1996 for Illinois, which
  discontinued reporting at the end of 1996, were subtracted from the previously reported totals
  for 1996 (1). Alabama and Ohio updated their reports for 1996, and these updated data were
  incorporated.
=====================================================================================================
Return to top. Figure_1 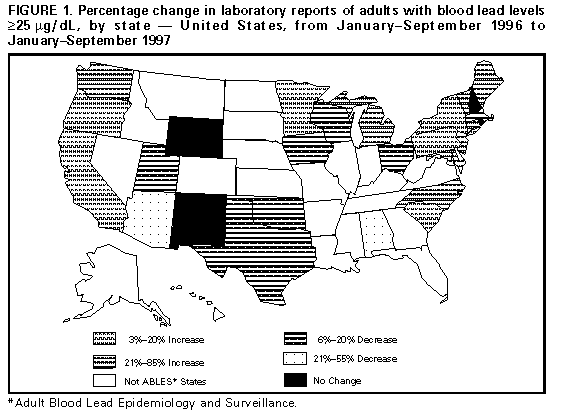 Return to top. Disclaimer All MMWR HTML versions of articles are electronic conversions from ASCII text into HTML. This conversion may have resulted in character translation or format errors in the HTML version. Users should not rely on this HTML document, but are referred to the electronic PDF version and/or the original MMWR paper copy for the official text, figures, and tables. An original paper copy of this issue can be obtained from the Superintendent of Documents, U.S. Government Printing Office (GPO), Washington, DC 20402-9371; telephone: (202) 512-1800. Contact GPO for current prices. **Questions or messages regarding errors in formatting should be addressed to mmwrq@cdc.gov.Page converted: 10/05/98 |
|||||||||
This page last reviewed 5/2/01
|