 |
|
|
|
|
|
|
| ||||||||||
|
|
|
|
|
|
|
||||
| ||||||||||
|
|
|
|
|
Persons using assistive technology might not be able to fully access information in this file. For assistance, please send e-mail to: mmwrq@cdc.gov. Type 508 Accommodation and the title of the report in the subject line of e-mail. Abortion Surveillance: Preliminary Analysis -- United States, 1995For 1995, CDC received data about legal induced abortions from the 50 states, New York City, and the District of Columbia. This report presents preliminary data for 1995; final abortion data for 1995 will be published during spring 1998. In 1995, a total of 1,210,883 legal induced abortions were reported to CDC (Table 1), a decrease of 4.5% from the number reported for 1994 (1). The number of live births decreased by 1.5% over the same period. From 1994 to 1995, the number of reported abortions decreased in 40 of 52 reporting areas. From 1994 to 1995, the national abortion ratio (number of legal abortions per 1000 live births reported by all reporting areas) decreased from 321 to 311, respectively (Table_1), (Figure_1), and the national abortion rate (number of legal abortions per 1000 women aged 15-44 years) decreased from 21 to 20, respectively. Consistent with previous years, approximately 92% of women who had legal abortions were residents of the state in which the procedure was performed. Women who obtained legal abortions in 1995 were predominately white and unmarried. As in 1994, one fifth of women who obtained legal abortions in 1995 were adolescents (aged less than or equal to 19 years); 33% were aged 20-24 years. Curettage (suction and sharp) remained the primary abortion procedure (99% of all procedures). As in previous years, more than half of legal abortions (54%) were performed during the first 8 weeks of gestation; specifically, 16% were at less than or equal to 6 weeks; 17% at 7 weeks; and 21% at 8 weeks. Approximately 88% of abortions were performed during the first 12 weeks of pregnancy. Reported by: Statistics and Computer Resources Br, Div of Reproductive Health, National Center for Chronic Disease Prevention and Health Promotion, CDC. Editorial NoteEditorial Note: During 1980-1995, the annual number of legal induced abortions in the United States varied by less than or equal to 5% (Table 1). However, since 1990 (the year in which the number of abortions was highest), the number of reported abortions has steadily decreased. In 1995, 77% of reporting areas reported fewer abortions than in 1994. During 1972-1980, the national abortion rate increased each year; during 1981-1993, the rate remained stable, fluctuating between 22 and 24 per 1000 women of reproductive age (i.e., aged 15-44 years) (Figure_1). The 1995 rate of 20 was the lowest rate recorded since 1975 (2). In 1995, the national ratio of abortions to live births (311 abortions per 1000 live births) was lower than for any year since 1976 (Figure_1) (3). The denominator of this ratio (the number of live births) peaked in 1990 and has declined each subsequent year; although the numerator of this ratio (the number of abortions) also peaked in 1990, the percentage decline from 1994 to 1995 in the annual number of abortions exceeded the percentage decline in the annual number of births (4.5% compared with 1.5%, respectively). Factors potentially associated with the decrease in the proportion of pregnancies that ended in an abortion include reduced access to abortion services, attitudinal changes concerning the decision to have an abortion or to carry a pregnancy to term, and a reduction in the number of unintended pregnancies (4-6). Although the number of women of reproductive age in the United States has increased by 13% since 1980, the proportion who are older (i.e., in later, less fertile reproductive years) has increased (7). For example, from 1980 to 1995, the percentage of women of reproductive age who were aged less than 30 years (the age group having highest fertility) declined from 58% to 46%, respectively (8), while women aged 35-44 years (the age group having lowest fertility) accounted for 25% and 36% of reproductive-aged women, respectively. The final report for 1995 will assess the impact of changes in the age distribution of reproductive-aged women on the long-term trend in the abortion rate and ratio. Many states emphasize prevention of unintended pregnancy, particularly among teenagers. During 1995, the total number of legal induced abortions was available for all 52 reporting areas. However, approximately 36% of abortions were reported from states without centralized reporting of abortions (four states) or from states whose state health departments did not collect, and therefore could not provide, information about characteristics (e.g., age or race) of women obtaining legal abortions (four states). To assist efforts to prevent unintended pregnancy, each state needs an accurate assessment of abortion on an ongoing basis (including the number and characteristics of women obtaining legal abortions). Since 1992, most reporting areas have reported abortions by gestational age in weeks of gestation for abortions performed at less than or equal to 8 weeks. As new medical methods are used for terminating pregnancies primarily at less than or equal to 8 weeks of gestation, these data will continue to assist in monitoring trends in legal abortions (9,10). Additional statistical and epidemiologic information about legal induced abortions is available from CDC's automated Reproductive Health Information line, telephone (888) 232-2306, which provides information by fax, by voice recordings, or through the mail. References
Table_1 Note: To print large tables and graphs users may have to change their printer settings to landscape and use a small font size.
TABLE 1. Reported number of legal induced abortions, abortion ratios,* abortion rates,+ and characteristics of women who obtained legal induced
abortions -- United States, selected years, 1972-1995
===================================================================================================================================================================
Characteristic                           1972            1976       1980        1985         1990        1991        1992        1993         1994       1995&
-------------------------------------------------------------------------------------------------------------------------------------------------------------------
Reported no. legal abortions            586,760        988,267   1,297,606    1,328,570   1,429,577   1,388,937   1,359,145    1,330,414   1,267,415   1,210,883
Abortion ratio                            180            312        359          354         345         339         335          334         321         311
Abortion rate                              13             21         25           24          24          24          23           22          21          20

                                                                                             Percentage distribution
                                         --------------------------------------------------------------------------------------------------------------------------
Residence
In-state                                 56.2            90.0       92.6        92.4         91.8        91.6        92.0        91.4         91.5        91.7
Out-of-state                             43.8            10.0        7.4         7.6          8.2         8.4         8.0         8.6          8.5         8.3
Age group (yrs)
  <=19                                   32.6            32.1       29.2        26.3         22.4        21.0        20.1        20.0         20.2        20.1
20-24                                    32.5            33.3       35.5        34.7         33.2        34.4        34.5        34.4         33.5        32.5
  >=25                                   34.9            34.6       35.3        39.0         44.4        44.6        45.4        45.6         46.3        47.4
Race
White                                    77.0            66.6       69.9        66.6         64.8        63.8        61.5        60.9         60.5        59.5
Black                                    23.0            33.4       30.1        29.8         31.8        32.5        33.9        34.9         34.7        35.0
Other**                                   --              --         --          3.5          3.4         3.7         4.6         4.2          4.8         5.5
Ethnicity
Hispanic                                  --              --         --          --           9.8        13.5        15.2        14.7         14.5        15.4
Non-Hispanic                              --              --         --          --          90.2        86.5        84.8        85.3         85.5        84.6
Marital status
Married                                  29.7            24.6       23.1        19.3         21.7        21.4        20.8        20.4         19.9        20.3
Unmarried                                70.3            75.4       76.9        80.7         78.3        78.6        79.2        79.6         80.1        79.7
No. live births++
    0                                    49.4            47.7       58.4        56.3         49.2        47.8        45.9        46.3         46.2        45.2
    1                                    18.2            20.7       19.4        21.6         24.4        25.3        25.9        26.0         25.9        26.5
    2                                    13.3            15.4       13.7        14.5         16.9        17.4        18.0        17.8         17.8        18.0
    3                                     8.7             8.3        5.3         5.1          6.1         6.4         6.7         6.6          6.7         6.8
  >=4                                    10.4             7.9        3.2         2.5          3.4         3.4         3.5         3.3          3.4         3.5
Type of procedure
Curettage                                88.6            92.8       95.5        97.5         98.8        98.9        98.9        99.0         99.1        98.9
  Suction                                65.2            82.6       89.8        94.6         96.0        97.3        97.0        96.4         96.5        96.6
  Sharp                                  23.4            10.2        5.7          2.9         2.8         1.6         1.9          2.6         2.6         2.3
Intrauterine instillation                10.4             6.0        3.1         1.7          0.8         0.7         0.7         0.6          0.5         0.5
Other&&                                   1.0             1.2        1.4         0.8          0.4         0.4         0.4         0.4          0.4         0.6
Weeks' gestation
  <=8                                    34.0            47.0       51.7        50.3         51.6        52.3        52.1        52.3         53.7        54.0
  <=6                                     --              --         --          --           --          --         14.3@@      14.7***
                  15.7+++     15.7+++
    7                                     --              --         --          --           --          --         15.6@@      16.2***
                  16.5+++     17.1+++
    8                                     --              --         --          --           --          --         22.2@@      21.6***
                  21.6+++     21.2+++
 9-10                                    30.7            28.1       26.2        26.6         25.3        25.1        24.2        24.4         23.5        23.1
11-12                                    17.5            14.4       12.2        12.5         11.7        11.5        12.0        11.6         10.9        10.9
13-15                                     8.4             4.5        5.1         5.9          6.4         6.1         6.0         6.3          6.3         6.3
16-20                                     8.2             5.1        3.9         3.9          4.0         3.9         4.2         4.1          4.3         4.3
 >=21                                     1.2             0.9        0.9         0.8          1.0         1.1         1.5         1.3          1.3         1.4
-------------------------------------------------------------------------------------------------------------------------------------------------------------------
*   Number of legal induced abortions per 1000 live births.
+   Number of legal induced abortions per 1000 women aged 15-44 years.
&   Preliminary data. The number of areas reporting a given characteristic varied. For 1995, the number of areas reporting residence was 43; age, 44;
    race, 36;
    ethnicity, 23; marital status, 33; number of live births, 37; type of procedure, 40; and weeks of gestation, 40.
@   Percentage distributions are based on known values in data from all ares reporting a given characteristic, except where the proportion of unknown
    values exceeded
    15%.
**  Reported as "other" race.
++  For years 1972 and 1976, data indicate number of living children.
&&  Includes hysterotomy and hysterectomy.
@@  Data are for 36 of 39 areas reporting weeks of gestation.
*** Data are for 38 of 41 areas reporting weeks of gestation.
+++ Data are for 38 of 40 areas reporting weeks of gestation.
===================================================================================================================================================================
Return to top. Figure_1 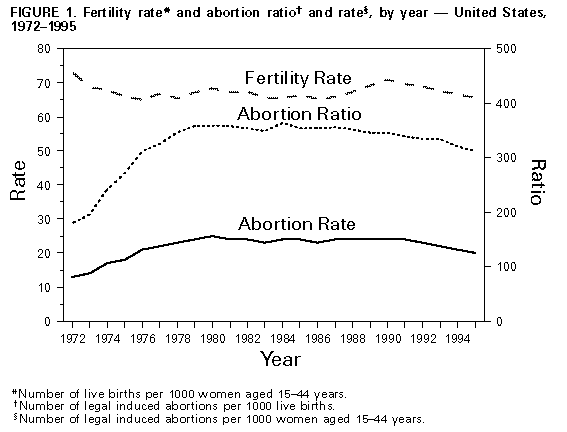 Return to top. Disclaimer All MMWR HTML versions of articles are electronic conversions from ASCII text into HTML. This conversion may have resulted in character translation or format errors in the HTML version. Users should not rely on this HTML document, but are referred to the electronic PDF version and/or the original MMWR paper copy for the official text, figures, and tables. An original paper copy of this issue can be obtained from the Superintendent of Documents, U.S. Government Printing Office (GPO), Washington, DC 20402-9371; telephone: (202) 512-1800. Contact GPO for current prices. **Questions or messages regarding errors in formatting should be addressed to mmwrq@cdc.gov.Page converted: 09/19/98 |
|||||||||
This page last reviewed 5/2/01
|