 |
|
|
|
|
|
|
| ||||||||||
|
|
|
|
|
|
|
||||
| ||||||||||
|
|
|
|
|
Persons using assistive technology might not be able to fully access information in this file. For assistance, please send e-mail to: mmwrq@cdc.gov. Type 508 Accommodation and the title of the report in the subject line of e-mail. AIDS RatesThe following map (Figure_1) provides the annual rates of acquired immunodeficiency syndrome (AIDS) per 100,000 population, by state of residence from July 1996 through June 1997. The accompanying table (Table_1) lists the metropolitan areas with the 50 highest annual rates of AIDS per 100,000 population. More detailed information about AIDS cases is provided in the HIV/AIDS Surveillance Report, single copies of which are available from the CDC National AIDS Clearinghouse, P.O. Box 6003, Rockville, MD 20849-6003; telephone (800) 458-5231 or (301) 217-0023. Internet users can view an electronic copy of the report by accessing CDC's World-Wide Web home page (http://www.cdc.gov), then selecting "Publications, Software, & Products." Rates presented here represent cases reported to CDC over the indicated 12-month period. Reported cases over a recent time period indicate the size and characteristics of the populations affected by the epidemic and the distribution and impact of AIDS nationally. These data are not appropriate for analyzing trends in the epidemic over time. Additional information about trends in the epidemic were published in MMWR 1997;46:861-7. Figure_1 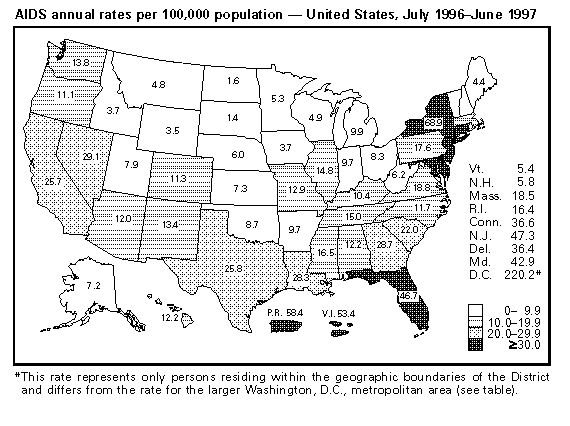 Return to top. Table_1 Note: To print large tables and graphs users may have to change their printer settings to landscape and use a small font size. Metropolitan areas * with the 50 highest AIDS annual rates per 100,000 population -- United States, July 1996-June 1997 ====================================================== Metropolitan area of residence Rate ------------------------------------------------------ New York,N.Y. 117.2 Jersey City,N.J. 109.8 Miami,Fla. 86.6 San Francisco,Calif. 83.1 Newark,N.J. 80.0 Fort Lauderdale,Fla. 78.4 West Palm Beach,Fla. 73.0 San Juan,P.R. 70.2 Baltimore,Md. 61.8 New Orleans,La. 48.7 Baton Rouge,La. 48.1 Houston,Tex. 47.6 Washington,D.C. 44.2 New Haven,Conn. 41.1 Atlanta,Ga. 40.0 Bergen-Passaic,N.J. 39.7 Wilmington,Del. 39.2 Hartford,Conn. 37.1 Jacksonville,Fla. 36.4 Los Angeles,Calif. 35.4 Orlando,Fla. 34.9 Buffalo,N.Y. 32.8 Philadelphia,Pa. 32.1 Norfolk,Va. 31.9 Las Vegas,Nev. 31.8 San Diego,Calif. 30.5 Tampa-Saint Petersburg,Fla. 29.8 Dallas,Tex. 29.7 Rochester,N.Y. 27.8 Memphis,Tenn. 26.9 Austin,Tex. 26.5 Springfield,Mass. 26.5 Richmond,Va. 26.3 Louisville,Ky. 25.0 Nassau-Suffolk,N.Y. 25.0 Oakland,Calif. 24.8 San Antonio,Tex. 24.8 Syracuse,N.Y. 24.4 Nashville,Tenn. 24.3 Middlesex,N.J. 23.9 Monmouth-Ocean,N.J. 22.2 Seattle,Wash. 22.2 Albany-Schenectady,N.Y. 22.0 Sarasota,Fla. 20.4 Fort Worth,Tex. 20.3 Albuquerque,N.M. 20.1 Chicago,Ill. 18.6 Riverside-San Bernardino,Calif. 18.6 Tucson,Ariz. 18.4 Denver,Colo. 17.5 Little Rock,Ark. 17.5 ------------------------------------------------------ * Includes only metropolitan areas with a population >=500,000. Metropolitan areas are named for a central city or county, may include several cities and counties, and may cross state boundaries. ====================================================== Return to top. Disclaimer All MMWR HTML versions of articles are electronic conversions from ASCII text into HTML. This conversion may have resulted in character translation or format errors in the HTML version. Users should not rely on this HTML document, but are referred to the electronic PDF version and/or the original MMWR paper copy for the official text, figures, and tables. An original paper copy of this issue can be obtained from the Superintendent of Documents, U.S. Government Printing Office (GPO), Washington, DC 20402-9371; telephone: (202) 512-1800. Contact GPO for current prices. **Questions or messages regarding errors in formatting should be addressed to mmwrq@cdc.gov.Page converted: 09/19/98 |
|||||||||
This page last reviewed 5/2/01
|