 |
|
|
|
|
|
|
| ||||||||||
|
|
|
|
|
|
|
||||
| ||||||||||
|
|
|
|
|
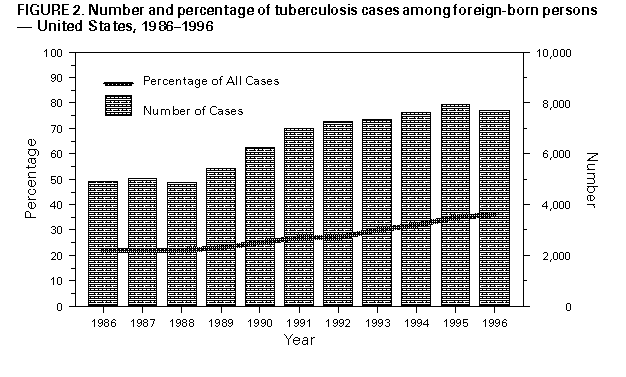
Persons using assistive technology might not be able to fully access information in this file. For assistance, please send e-mail to: mmwrq@cdc.gov. Type 508 Accommodation and the title of the report in the subject line of e-mail. Tuberculosis Morbidity -- United States, 1996During 1996, a total of 21,337 cases of tuberculosis (TB) (8.0 cases per 100,000 population) were reported to CDC from the 50 states, the District of Columbia (DC), and New York City; this total represents a 6.7% decrease from 1995 (22,860 cases {8.7 per 100,000 population}) (1). This is the fourth consecutive year that the number of reported TB cases has decreased (Figure_1), resulting in the lowest number and rate of reported TB cases since national reporting began in 1953. This report summarizes TB surveillance data for 1996 and compares these data with selected data for previous years. The findings indicate a continuing decrease in the number of TB cases among U.S.-born persons and a leveling or slight decrease in the number of cases among persons born outside the United States and its territories (i.e., foreign-born). During 1996, a total of 29 states reported fewer TB cases than in 1995, and 21 states and DC reported no change or more cases in 1996 than in 1995 (Table_1). In 1996, TB rates by state ranged from 0.7 per 100,000 population in Vermont to 16.9 in Hawaii. The rate in DC was highest of all reporting areas (25.6). Nineteen states met the interim target rate for 2000 of less than or equal to 3.5, compared with 16 in 1995 (Table_1) (2). Compared with 1995, the number of reported TB cases in 1996 decreased in each sex and age group and all racial/ethnic groups (Table_2). The number of U.S.-born case-patients decreased 9.7% (Table_2). Among U.S.-born case-patients, TB rates decreased from 6.2 in 1995 to 5.6 in 1996. The number of cases decreased in all age groups, with the largest decreases occurring among persons aged 0-4 years (14.5%) and 25-44 years (13.4%). During 1996, TB cases reported among foreign-born persons accounted for 36.6% of those with information about country of origin, compared with 34.7% in 1995 (Figure_2). In 1996, the number of TB cases among foreign-born persons decreased 2.9% (from 7930 in 1995 to 7704 in 1996) (Table_2), representing the first decreases among foreign-born persons since 1986 (the first year such data were collected). The TB rate among foreign-born persons also decreased in 1996 (31.3), compared with 1995 (33.9). In 1996, the country of origin was known for 7641 (99.2%) foreign-born case-patients; seven countries (Haiti, India, Mexico, Philippines, People's Republic of China, Republic of Korea, and Vietnam) accounted for 66.2% of cases. Of the 5225 foreign-born persons reported in 1996 whose records contained information about month and year of arrival in the United States, 1439 (27.5%) had TB diagnosed within 1 year and 1431 (27.4%), 1-5 years after entering the United States. In 1996, the number of reported cases among foreign-born persons decreased in all age groups except among persons aged 15-24 years (2.7% increase); the largest decrease occurred among persons aged 0-4 years (20.8%). Information about the initial prescribed drug regimen was available for 99% of cases reported in 1995 and 1996. Compared with 1995, the number of cases for which the initial four-drug regimen was prescribed as recommended by the Advisory Council for the Elimination of Tuberculosis, the American Thoracic Society, and CDC (isoniazid {INH}, rifampin {RIF}, pyrazinamide, and either ethambutol or streptomycin) (3,4) increased 4.1% (from 13,582 {63.3%} of 21,472 in 1995 to 13,679 {67.5%} of 20,277 in 1996). In 1995, human immunodeficiency virus (HIV)-antibody-test results were available for 3490 (42.3%) of 8241 persons aged 25-44 years, and in 1996 for 3866 (50.8%) of 7604. Fourteen states reported HIV-antibody-test results for greater than or equal to 75% of cases in 1996, compared with nine states in 1995. The proportion of TB cases for which drug-susceptibility results for Mycobacterium tuberculosis isolates were reported was 90.7% (15,639 of 17,234) in 1996, an increase from 87.4% (15,993 of 18,292) in 1995. In 1996, a total of 47 states reported drug-susceptibility results for isolates from greater than or equal to 75% of cases; of these, 1225 (8.0%) of 15,282 were resistant to at least INH, compared with 1189 (8.2%) of 14,546 among the 42 states reporting results for greater than or equal to 75% of cases in 1995; 234 (1.5%) of 15,263 were resistant to at least INH and RIF, compared with 268 (1.8%) of 14,520 in 1995. The 47 states reporting drug-susceptibility results accounted for 98% of all culture-positive cases reported in 1996. Reported by: Div of Tuberculosis Elimination, National Center for HIV, STD, and TB Prevention, CDC. Editorial NoteEditorial Note: The continued decline in the number of TB cases reported annually in the United States since 1992 primarily reflects improvements in TB-prevention and TB-control programs in state and local health departments resulting from increased federal resources provided to the states beginning in the early 1990s (1). The increased funding enabled many TB-control programs to improve management of TB cases by ensuring that each patient completed an adequate course of therapy and by expanding the use of directly observed therapy (DOT) (5-7). Information about treatment outcome (e.g., completion of TB treatment and use of DOT) was collected for each reported TB case for the first time beginning in 1993. Analyses of available data about completion of TB treatment and use of DOT for TB cases reported in 1993 and 1994 indicated that treatment completion rates increased from 76% for 1993 to 78% for 1994, and the proportion receiving DOT increased from 35% for 1993 to 47% for 1994 (CDC, unpublished data, 1997). Complete data for 1995 and 1996 cases are not yet available. Although the number and rate of reported TB cases in the United States continue to decline, TB incidence for 1996 (8.0) exceeded the national goal of TB elimination (an incidence of less than 1 case per 1 million population) by 2010, with an interim incidence target of 3.5 cases per 100,000 population by 2000 (2). TB rates remain higher for foreign-born persons and minority groups. Sustained improvement of TB control and prevention in the United States and achievement of the 2010 national goal of TB elimination requires continued collaboration between federal agencies and state and local health departments. The highest priority of TB-prevention and TB-control programs must be to ensure that all persons with TB are promptly identified and treated with an adequate course of drug therapy (8). Future efforts must include intensified identification and treatment of persons with active TB and TB infection, especially foreign-born persons from areas with high TB rates that account for the greatest number of immigrants to the United States (9). The occurrence of TB among foreign-born U.S. residents reflects the global nature of TB as a public health problem. TB-control activities aimed at reducing the incidence of TB cases in other parts of the world must be strengthened. Additional resources are needed for the successful implementation of DOT short course (DOTS) in those countries. DOTS is a strategy advocated by the Global Tuberculosis Program of the World Health Organization (WHO) and the International Union Against Tuberculosis and Lung Disease (IUATLD) to ensure detection of TB cases with appropriate diagnostic procedures, provision of an appropriately supervised course of TB therapy, establishment of a secure supply of essential anti-TB drugs, and establishment of a system of records and program assessment (10). CDC is collaborating with WHO, IUATLD, and the World Bank to implement and evaluate this strategy in anticipation of advances in the global effort to eliminate TB that will result in enhanced TB prevention and control in the United States. References
Disclaimer All MMWR HTML versions of articles are electronic conversions from ASCII text into HTML. This conversion may have resulted in character translation or format errors in the HTML version. Users should not rely on this HTML document, but are referred to the electronic PDF version and/or the original MMWR paper copy for the official text, figures, and tables. An original paper copy of this issue can be obtained from the Superintendent of Documents, U.S. Government Printing Office (GPO), Washington, DC 20402-9371; telephone: (202) 512-1800. Contact GPO for current prices. **Questions or messages regarding errors in formatting should be addressed to mmwrq@cdc.gov.Page converted: 09/19/98 |
|||||||||
This page last reviewed 5/2/01
|