 |
|
|
|
|
|
|
| ||||||||||
|
|
|
|
|
|
|
||||
| ||||||||||
|
|
|
|
|
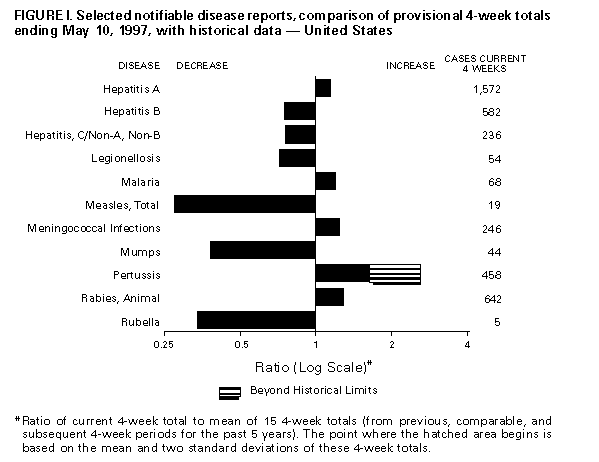
Persons using assistive technology might not be able to fully access information in this file. For assistance, please send e-mail to: mmwrq@cdc.gov. Type 508 Accommodation and the title of the report in the subject line of e-mail. Notifiable Diseases/Deaths in Selected Cities Weekly InformationFigure_I Selected notifiable disease reports, comparison of provisional 4-week totals ending May 10, 1997, with historical data -- United States Table_I Summary -- provisional cases of selected notifiable diseases, United States, cumulative, week ending May 10, 1997 (19th Week) Table_II Provisional cases of selected notifiable diseases, United States, weeks ending May 10, 1997 and May 11, 1996 (19th Week) Table_III Provisional cases of selected notifiable diseases preventable by vaccination, United States, weeks ending May 10, 1997 and May 11, 1996 (19th Week) Table_IV Deaths in 122 U.S. cities, week ending
May 10, 1997 (19th Week)
TABLE I. Summary -- provisional cases of specified notifiable diseases, United
States, cumulative, week ending May 10, 1997 (19th Week)
==================================================================================
                                             Cum. 1997
------------------------------------------------------
Anthrax                                              -
Brucellosis                                         15
Cholera                                              1
Congenital rubella syndrome                          2
Cryptosporidiosis*                                 399
Diphtheria                                           4
Encephalitis:  California*                           4
               eastern equine*                       -
               St. Louis*                            -
               western equine*                       -
Hansen Disease                                      40
Hantavirus pulmonary syndrome*+                      3
Hemolytic uremic syndrome, post-diarrheal*          14
HIV infection, pediatric*&                          92
Plague                                               1
Poliomyelitis, paralytic                             -
Psittacosis                                         15
Rabies, human                                        2
Rocky Mountain spotted fever (RMSF)                 47
Streptococcal disease, invasive Group A            500
Streptococcal toxic-shock syndrome*                 13
Syphilis, congenital@                               47
Tetanus                                             11
Toxic-shock syndrome                                39
Trichinosis                                          5
Typhoid fever                                       96
Yellow fever                                         -
------------------------------------------------------
-: no reported cases
 * Not notifiable in all states
 + Updated weekly from reports to the Division of Viral and Rickettsial
   Diseases, National Center for Infectious Diseases (NCID).
 & Updated monthly to the Division of HIV/AIDS Prevention, National Center
   for HIV, STD, and TB Prevention (NCHSTP), last update April 29, 1997.
 @ Updated quarterly from reports to the Division of STD Prevention,
   NCHSTP.

==================================================================================
Return to top. Table_II Note: To print large tables and graphs users may have to change their printer settings to landscape and use a small font size.
TABLE II. (page 1) Provisional cases of selected notifiable diseases, United States, weeks ending
May 10, 1997, and May 11, 1996 (19th Week)
Escherichia
coli O157:H7
------------------- Hepatitis
AIDS* Chlamydia NETSS** PHLIS*** Gonorrhea C\NA,NB
----------------- -------------------- -------- -------- ------------------- ----------------
Cum. Cum. Cum. Cum. Cum. Cum. Cum. Cum. Cum. Cum.
Reporting Area 1997 1996 1997 1996 1997 1997 1997 1996 1997 1996
------------------------------------------------------------------------------------------------------------------------------
UNITED STATES 20,222 22,011 134,060 148,362 356 156 86,477 108,717 1,053 1,173
NEW ENGLAND 671 872 5,618 6,902 30 14 1,866 2,849 17 40
Maine 25 15 333 U 1 - 17 18 - -
N.H. 8 25 252 255 1 - 47 54 3 3
Vt. 16 8 136 172 2 1 18 23 - 12
Mass. 282 488 2,573 2,406 22 13 823 793 12 22
R.I. 55 61 761 777 1 - 188 202 2 3
Conn. 285 275 1,563 3,292 3 - 773 1,759 - -
MID. ATLANTIC 6,683 5,899 16,236 26,366 27 4 9,806 13,230 117 99
Upstate N.Y. 1,143 753 N N 16 3 1,737 48 95 78
N.Y. City 3,308 3,288 8,154 14,055 5 - 3,793 6,129 - 2
N.J. 1,444 1,144 2,593 5,498 6 - 1,499 3,372 - -
Pa. 788 714 5,489 6,813 N 1 2,777 3,681 22 19
E.N. CENTRAL 1,416 1,879 21,646 32,699 62 20 13,023 21,373 213 192
Ohio 270 441 5,082 7,519 18 9 3,221 5,370 5 4
Ind. 302 305 3,204 3,595 13 2 2,205 2,461 5 6
Ill. 509 770 4,128 9,488 14 - 2,051 6,262 16 44
Mich. 259 253 6,689 7,992 17 2 4,416 5,486 187 138
Wis. 76 110 2,543 4,105 N 7 1,130 1,794 - -
W.N. CENTRAL 383 530 8,103 11,702 50 31 3,751 4,546 54 21
Minn. 79 108 - 1,806 29 18 U - 1 -
Iowa 59 43 1,765 1,360 12 5 452 381 15 8
Mo. 150 231 3,942 5,120 3 5 2,609 3,070 25 8
N. Dak. 4 4 323 381 3 2 23 11 2 -
S. Dak. 2 7 428 479 - - 41 73 - -
Nebr. 35 39 258 793 2 - 89 164 1 2
Kans. 54 98 1,387 1,763 1 1 537 847 10 3
S. ATLANTIC 4,846 5,746 30,323 20,110 48 11 30,029 36,656 94 65
Del. 69 113 - - 1 1 401 532 - -
Md. 576 658 2,577 2,253 2 1 4,673 4,825 6 -
D.C. 282 376 N N - - 1,319 1,571 - -
Va. 421 316 3,926 4,440 N 4 2,927 3,566 8 5
W. Va. 27 32 1,259 800 N - 583 397 3 6
N.C. 281 279 6,270 U 12 5 5,757 7,139 22 18
S.C. 270 278 4,498 U 1 - 3,991 4,163 17 13
Ga. 683 865 3,375 4,256 15 - 4,438 8,017 U -
Fla. 2,237 2,829 8,418 8,361 17 - 5,940 6,446 38 23
E.S. CENTRAL 609 771 11,898 10,487 29 7 12,018 11,277 140 218
Ky. 60 119 2,388 2,485 9 - 1,628 1,482 7 12
Tenn. 285 281 4,557 4,433 15 7 3,875 3,850 78 179
Ala. 151 243 2,763 3,192 2 - 3,890 4,935 5 1
Miss. 113 128 2,190 377 3 - 2,625 1,010 50 26
W.S. CENTRAL 2,040 2,090 12,271 8,042 13 4 8,736 7,715 105 136
Ark. 83 97 460 545 1 1 928 1,449 - 2
La. 385 554 2,582 2,502 3 3 2,430 2,813 75 59
Okla. 116 67 2,782 2,562 - - 1,755 1,625 4 43
Tex. 1,456 1,372 6,447 2,433 9 - 3,623 1,828 26 32
MOUNTAIN 601 639 7,665 5,418 34 24 2,617 2,836 138 252
Mont. 16 8 311 483 3 - 14 12 4 9
Idaho 18 10 569 600 5 - 43 34 18 65
Wyo. 11 2 184 268 2 - 20 10 51 79
Colo. 156 178 100 8 13 8 554 643 19 25
N. Mex. 58 43 1,278 1,446 4 3 508 332 26 31
Ariz. 158 193 3,559 1,018 N 10 1,112 1,385 15 28
Utah 41 77 609 555 4 - 77 113 2 7
Nev. 143 128 1,055 1,040 3 3 289 307 3 8
PACIFIC 2,973 3,585 20,300 26,636 63 38 4,631 8,235 175 150
Wash. 241 309 3,378 3,687 11 4 747 855 9 26
Oreg. 128 188 1,250 1,899 16 14 194 150 4 3
Calif. 2,570 3,025 14,652 20,054 33 17 3,383 6,852 107 52
Alaska 12 10 489 315 3 - 162 181 - 2
Hawaii 22 53 531 681 N 3 145 197 55 67
Guam 2 3 - 134 N - - 26 - 3
P.R. 520 418 N N 22 U 241 105 39 13
V.I. 29 6 N N N U - - - -
Amer. Samoa - - - - N U - - - -
C.N.M.I. - - N N N U 11 11 2 -
------------------------------------------------------------------------------------------------------------------------------
N: Not notifiable U: Unavailable -: no reported cases C.N.M.I.: Commonwealth of North Mariana Islands
* Updated monthly to the Division of HIV/AIDS Prevention, National Center for HIV, STD, and TB Prevention, last update April 29, 1997.
** National Electronic Telecommunications System for Surveillance.
*** Public Health Laboratory Information System.
=======================================================================================================================================================
TABLE II. (page 2) Provisional cases of selected notifiable diseases, United States, weeks ending
May 10, 1997, and May 11, 1996 (19th Week)
Lyme Syphilis Rabies,
Legionellosis Disease Malaria (Primary & Secondary) Tuberculosis Animal
---------------- ---------------- ---------------- --------------------- ----------------- -------
Cum. Cum. Cum. Cum. Cum. Cum. Cum. Cum. Cum. Cum. Cum.
Reporting Area 1997 1996 1997 1996 1997 1996 1997 1996 1997 1996 1997
-------------------------------------------------------------------------------------------------------------------------------------------
UNITED STATES 300 268 918 1,467 423 398 2,835 4,448 4,859 6,120 2,503
NEW ENGLAND 23 13 179 146 12 11 59 66 114 192 389
Maine 1 1 3 - 1 3 - - - 8 82
N.H. 4 - 4 2 1 1 - 1 1 3 19
Vt. 3 1 2 - 1 1 - - 2 - 64
Mass. 7 6 45 13 7 4 34 27 71 55 73
R.I. 4 5 33 21 2 2 - - 7 18 7
Conn. 4 N 92 110 - - 25 38 33 108 144
MID. ATLANTIC 49 57 590 1,173 102 124 130 255 1,061 1,051 545
Upstate N.Y. 11 10 83 457 21 19 14 25 123 115 392
N.Y. City - 3 5 198 51 73 29 121 564 539 -
N.J. 6 7 136 121 21 24 49 69 223 237 50
Pa. 32 37 366 397 9 8 38 40 151 160 103
E.N. CENTRAL 115 96 16 11 30 48 269 714 575 685 33
Ohio 64 33 12 7 4 6 91 281 116 104 28
Ind. 15 24 4 4 3 3 64 93 48 65 2
Ill. - 13 - - 5 23 24 192 288 389 1
Mich. 31 16 - - 15 8 45 71 81 102 2
Wis. 5 10 U U 3 8 45 77 42 25 -
W.N. CENTRAL 26 18 10 34 11 9 51 188 159 158 152
Minn. 1 1 8 1 5 3 - 39 43 37 16
Iowa 5 2 - 5 3 1 3 11 20 19 59
Mo. 5 4 - 11 2 4 32 122 59 55 7
N. Dak. 2 - - - - - - - 4 2 21
S. Dak. 1 2 - - - - - - 2 11 17
Nebr. 8 7 2 - 1 - - 6 4 12 1
Kans. 4 2 - 17 - 1 16 10 27 22 31
S. ATLANTIC 44 31 76 48 105 64 1,191 1,473 1,012 1,072 1,112
Del. 4 2 - 24 2 2 11 16 7 20 25
Md. 15 5 56 4 29 19 309 220 101 94 201
D.C. 2 1 5 1 6 3 41 60 30 49 1
Va. 4 9 - - 21 7 104 181 111 82 225
W. Va. - 1 - 3 - 1 1 3 21 22 26
N.C. 5 3 3 10 6 7 271 398 123 123 351
S.C. 2 3 1 2 5 3 157 165 125 120 57
Ga. - - 1 - 12 8 197 291 173 228 103
Fla. 12 7 10 4 24 14 100 139 321 334 123
E.S. CENTRAL 9 17 24 21 12 10 689 1,028 377 476 100
Ky. - 2 2 6 2 3 64 54 74 84 10
Tenn. 4 7 9 6 3 5 288 346 79 148 65
Ala. 1 1 2 1 4 1 167 209 149 157 25
Miss. 4 7 11 8 3 1 170 419 75 87 -
W.S. CENTRAL 4 2 4 8 5 10 301 458 122 661 61
Ark. - - - 5 1 - 29 114 74 63 17
La. 1 - 1 - 4 - 138 208 - - 1
Okla. - 2 2 2 - - 48 62 48 57 43
Tex. 3 - 1 1 - 10 86 74 - 541 -
MOUNTAIN 16 14 1 - 28 22 58 52 177 211 28
Mont. 1 1 - - 2 1 - - 2 7 6
Idaho 1 - - - - - - 1 4 3 -
Wyo. 1 2 - - 1 2 - 1 2 1 8
Colo. 3 5 - - 14 12 1 16 37 37 -
N. Mex. 1 - - - 4 1 - - 8 28 1
Ariz. 4 3 1 - 3 3 49 30 77 91 12
Utah 4 - - - 1 2 2 - 6 10 -
Nev. 1 3 - - 3 1 6 4 41 34 1
PACIFIC 14 20 18 26 118 100 87 214 1,262 1,614 83
Wash. 3 1 - 1 6 6 6 2 74 92 -
Oreg. - - 8 8 7 8 3 3 50 64 1
Calif. 10 19 10 16 101 82 76 208 1,042 1,367 70
Alaska - - - - 2 1 1 - 32 30 12
Hawaii 1 - - 1 2 3 1 1 64 61 -
Guam - - - - - - - 3 - 45 -
P.R. - - - - 3 - 75 42 - 47 20
V.I. - - - - - - - - - - -
Amer. Samoa - - - - - - - - - - -
C.N.M.I. - - - - - - 4 1 - - -
-------------------------------------------------------------------------------------------------------------------------------------------
N: Not notifiable U: Unavailable -: no reported cases
=======================================================================================================================================================
Return to top. Table_III Note: To print large tables and graphs users may have to change their printer settings to landscape and use a small font size.
TABLE III. (page 1) Provisional cases of selected notifiable diseases preventable by vaccination, United
States, weeks ending May 10, 1997, and May 11, 1996 (19th Week)
Hepatitis (Viral), by type Measles (Rubeola)
H. influenzae, --------------------------------------- ------------------------------------------------------------
invasive A B Indigenous Imported** Total
---------------- ----------------- ----------------- --------------- --------------- ---------------
Cum. Cum. Cum. Cum. Cum. Cum. Cum. Cum. Cum. Cum.
Reporting Area 1997* 1996 1997 1996 1997 1996 1997 1997 1997 1997 1997 1996
-----------------------------------------------------------------------------------------------------------------------------------------------------
UNITED STATES 427 447 9,245 9,807 2,933 3,359 3 29 1 14 43 120
NEW ENGLAND 24 10 204 120 69 80 - - - - - 6
Maine 3 - 26 10 4 2 - - - - - -
N.H. 2 6 13 3 5 4 - - - - - -
Vt. - - 6 2 1 5 - - - - - 1
Mass. 16 4 88 60 40 19 - - - - - 4
R.I. 2 - 20 3 8 4 - - - - - -
Conn. 1 - 51 42 11 46 - - - - - 1
MID. ATLANTIC 50 78 707 793 397 642 - 7 - 4 11 12
Upstate N.Y. 4 5 93 140 79 115 - 1 - 3 4 4
N.Y. City 17 24 257 370 127 322 - 4 - 1 5 7
N.J. 20 28 139 147 94 110 - 1 - - 1 -
Pa. 9 21 218 136 97 95 - 1 - - 1 1
E.N. CENTRAL 61 81 793 920 309 400 - 4 - 2 6 10
Ohio 38 47 164 372 35 46 - - - - - 2
Ind. 5 2 118 128 33 47 - - - - - -
Ill. 11 23 173 211 54 123 - 4 - 1 5 1
Mich. 6 4 288 131 175 151 - - - 1 1 2
Wis. 1 5 50 78 12 33 - - - - - 5
W.N. CENTRAL 20 14 681 723 198 163 - 9 - 1 10 6
Minn. 12 7 59 27 13 10 - - - 1 1 5
Iowa 2 2 95 159 28 20 - - - - - -
Mo. 2 3 357 353 133 107 - 1 - - 1 1
N. Dak. - - 7 17 1 - - - - - - -
S. Dak. 2 1 6 34 - - - 8 - - 8 -
Nebr. 1 1 47 83 9 10 U - U - - -
Kans. 1 - 110 50 14 16 - - - - - -
S. ATLANTIC 98 85 548 322 436 401 1 1 - 2 3 2
Del. - 1 11 5 2 1 - - - - - 1
Md. 34 30 115 72 62 62 - - - 1 1 -
D.C. 2 3 13 15 18 14 - - - 1 1 -
Va. 6 4 67 54 43 52 - - - - - -
W. Va. 3 4 5 10 6 11 - - - - - -
N.C. 13 13 76 42 86 129 - - - - - -
S.C. 4 3 53 29 41 38 - - - - - -
Ga. 17 22 51 7 45 5 - - - - - -
Fla. 19 5 157 88 133 89 1 1 - - 1 1
E.S. CENTRAL 32 15 302 661 268 309 - - - - - -
Ky. 5 3 26 10 13 28 - - - - - -
Tenn. 19 6 199 479 158 197 - - - - - -
Ala. 8 5 42 84 29 20 - - - - - -
Miss. - 1 35 88 68 U U - U - - -
W.S. CENTRAL 22 15 1,799 1,566 306 286 - 2 - 1 3 2
Ark. 1 - 103 193 17 33 - - - - - -
La. 2 - 79 45 43 39 - - - - - -
Okla. 14 14 634 691 10 18 - - - - - -
Tex. 5 1 983 637 236 196 - 2 - 1 3 2
MOUNTAIN 40 26 1,539 1,508 336 403 - 1 - - 1 10
Mont. - - 43 50 4 4 - - - - - -
Idaho - 1 65 118 10 50 - - - - - -
Wyo. - - 17 17 13 13 - - - - - -
Colo. 6 5 180 152 70 57 - - - - - 3
N. Mex. 3 7 106 193 117 142 - - - - - -
Ariz. 12 9 738 493 69 73 - 1 - - 1 3
Utah 3 4 285 355 36 45 - - - - - -
Nev. 16 - 105 130 17 19 - - - - - 4
PACIFIC 80 123 2,672 3,194 614 675 2 5 1 4 9 72
Wash. 1 1 197 214 20 44 - - - - - 4
Oreg. 17 17 135 466 49 47 - - - - - 2
Calif. 58 103 2,273 2,454 528 581 2 2 1 4 6 1
Alaska 1 - 14 26 12 1 - - - - - 63
Hawaii 3 2 53 34 5 2 - 3 - - 3 2
Guam - - - 3 - - U - U - - -
P.R. - - 132 21 452 66 - - - - - 1
V.I. - - - - - - U - U - - -
Amer. Samoa - - - - - - U - U - - -
C.N.M.I. 4 10 1 1 19 5 U 1 U - 1 -
-----------------------------------------------------------------------------------------------------------------------------------------------------
N: Not notifiable U: Unavailable -: no reported cases
* Of 89 cases among children aged <5 years, serotype was reported for 39 and of those, 16 were type b.
** For imported measles, cases include only those resulting from importation from other countries.
=======================================================================================================================================================
TABLE III. (page 2) Provisional cases of selected notifiable diseases preventable by vaccination, United
States, weeks ending May 10, 1997, and May 11, 1996 (19th Week)
Meningococcal
Disease Mumps Pertussis Rubella
----------------- -------------------------- --------------------------- ---------------------------
Cum. Cum. Cum. Cum. Cum. Cum. Cum. Cum.
Reporting Area 1997 1996 1997 1997 1996 1997 1997 1996 1997 1997 1996
------------------------------------------------------------------------------------------------------------------------------------------
UNITED STATES 1,522 1,403 13 222 252 70 1,818 1,133 3 15 74
NEW ENGLAND 94 56 - 6 - 11 420 224 - - 11
Maine 9 8 - - - - 6 10 - - -
N.H. 9 1 - - - - 55 16 - - -
Vt. 2 3 - - - - 149 7 - - 2
Mass. 51 19 - 1 - 11 193 188 - - 7
R.I. 6 5 - 4 - - 12 - - - -
Conn. 17 20 - 1 - - 5 3 - - 2
MID. ATLANTIC 126 135 - 24 33 - 134 88 - 1 5
Upstate N.Y. 31 35 - 4 8 - 50 45 - - 3
N.Y. City 23 25 - - 8 - 19 14 - 1 1
N.J. 27 29 - - 2 - 5 4 - - 1
Pa. 45 46 - 20 15 - 60 25 - - -
E.N. CENTRAL 203 218 1 25 68 4 144 171 - 2 3
Ohio 84 75 1 10 26 3 60 55 - - -
Ind. 23 31 - 4 5 1 20 10 - - -
Ill. 62 64 - 7 13 - 20 49 - - 1
Mich. 17 25 - 4 23 - 26 11 - - 2
Wis. 17 23 - - 1 - 18 46 - 2 -
W.N. CENTRAL 111 106 - 8 4 6 106 51 - - -
Minn. 12 9 - 3 1 4 65 32 - - -
Iowa 23 22 - 3 - - 15 2 - - -
Mo. 58 47 - - 1 2 16 10 - - -
N. Dak. - 2 - - 2 - 2 - - - -
S. Dak. 3 3 - - - - 1 1 - - -
Nebr. 5 10 U 2 - U 2 2 U - -
Kans. 10 13 - - - - 5 4 - - -
S. ATLANTIC 277 202 4 39 25 8 173 104 - 2 12
Del. 4 2 - - - - - 10 - - -
Md. 27 20 - 4 12 1 63 42 - - -
D.C. 1 3 - - - - 2 - - - 1
Va. 24 26 - 4 3 1 19 5 - 1 -
W. Va. 10 9 - - - - 3 2 - - -
N.C. 47 31 - 6 - - 35 24 - - -
S.C. 37 28 2 9 3 1 8 1 - 1 1
Ga. 53 62 - 4 2 4 6 4 - - -
Fla. 74 21 2 12 5 1 37 16 - - 10
E.S. CENTRAL 117 113 1 15 10 1 36 121 - - -
Ky. 28 16 - 2 - - 2 110 - - -
Tenn. 44 34 - 4 1 - 16 7 - - -
Ala. 29 33 1 5 3 1 10 1 - - -
Miss. 16 30 U 4 6 U 8 3 U - N
W.S. CENTRAL 162 164 - 23 22 4 29 39 - 1 7
Ark. 22 21 - - - - 3 3 - - -
La. 28 32 - 7 8 - 7 3 - - 1
Okla. 17 14 - - - 3 5 4 - - -
Tex. 95 97 - 16 14 1 14 29 - 1 6
MOUNTAIN 87 84 1 11 13 24 519 124 1 1 4
Mont. 6 1 - - - - 2 5 - - -
Idaho 5 11 - 2 - 13 382 40 - - 2
Wyo. - - - 1 - - 3 - - - -
Colo. 26 14 1 3 1 10 98 24 - - -
N. Mex. 16 18 N N N - 20 26 - - -
Ariz. 16 25 - - 1 - 9 5 1 1 1
Utah 12 8 - 3 2 1 3 3 - - -
Nev. 6 7 - 2 9 - 2 21 - - 1
PACIFIC 345 325 6 71 77 12 257 211 2 8 32
Wash. 43 43 - 5 8 8 137 87 - - 1
Oreg. 69 61 - 1 - 4 11 22 - - -
Calif. 231 215 5 54 54 - 104 93 2 3 29
Alaska 1 4 1 2 2 - 1 - - - -
Hawaii 1 2 - 9 13 - 4 9 - 5 2
Guam - 1 U - 3 U - - U - -
P.R. 7 2 - 4 1 - - - - - -
V.I. - - U - - U - - U - -
Amer. Samoa - - U - - U - - U - -
C.N.M.I. - - U 1 - U - - U - -
------------------------------------------------------------------------------------------------------------------------------------------
N: Not notifiable U: Unavailable -: no reported cases
=======================================================================================================================================================
Return to top. Table_IV Note: To print large tables and graphs users may have to change their printer settings to landscape and use a small font size.
TABLE IV. Deaths in 122 U.S. cities,* week ending
May 10, 1997 (19th Week)
===================================================================================================================================
All Causes, By Age (Years)
------------------------------------------------------------------------ P&I**
Reporting Area All Ages >=65 45-64 25-44 1-24 <1 Total
---------------------------------------------------------------------------------------------------------------
NEW ENGLAND 602 443 100 38 10 11 40
Boston, Mass. 149 100 28 9 6 6 12
Bridgeport, Conn. 31 21 5 4 - 1 2
Cambridge, Mass. 21 19 2 - - - 1
Fall River, Mass. 35 28 5 2 - - -
Hartford, Conn. 71 56 8 4 1 2 3
Lowell, Mass. 30 26 3 1 - - 4
Lynn, Mass. 18 11 3 3 1 - -
New Bedford, Mass. 25 19 5 1 - - 1
New Haven, Conn. 30 18 7 3 2 - 2
Providence, R.I. 47 38 8 - - 1 3
Somerville, Mass. 8 8 - - - - -
Springfield, Mass. 41 30 7 4 - - 3
Waterbury, Conn. 36 27 7 2 - - 3
Worcester, Mass. 60 42 12 5 - 1 6
MID. ATLANTIC 2,240 1,550 419 188 43 40 108
Albany, N.Y. 45 30 8 4 - 3 3
Allentown, Pa. 22 18 4 - - - -
Buffalo, N.Y. 62 50 7 3 2 - 3
Camden, N.J. 19 9 5 2 1 2 -
Elizabeth, N.J. 22 15 5 1 1 - 1
Erie, Pa. 42 36 4 1 - 1 2
Jersey City, N.J. 38 24 8 4 1 1 1
New York City, N.Y. 1,187 790 237 124 18 18 35
Newark, N.J. 35 13 12 9 - 1 3
Paterson, N.J. 26 12 12 2 - - 1
Philadelphia, Pa. 300 203 53 23 13 8 20
Pittsburgh, Pa.*** 55 43 10 2 - - 3
Reading, Pa. 8 7 1 - - - 1
Rochester, N.Y. 133 98 21 7 3 4 9
Schenectady, N.Y. 27 22 4 1 - - 3
Scranton, Pa. 35 32 3 - - - 1
Syracuse, N.Y. 83 64 15 2 1 1 11
Trenton, N.J. 47 34 7 2 3 1 3
Utica, N.Y. 20 19 1 - - - 1
Yonkers, N.Y. 34 31 2 1 - - 7
E.N. CENTRAL 2,140 1,447 444 144 55 47 146
Akron, Ohio 39 28 7 3 - 1 -
Canton, Ohio 38 32 2 3 1 - 8
Chicago, Ill. 453 265 107 56 13 10 30
Cincinnati, Ohio 145 99 29 8 7 2 12
Cleveland, Ohio 159 104 36 13 3 3 5
Columbus, Ohio 210 143 50 9 2 6 17
Dayton, Ohio 110 82 19 3 2 4 15
Detroit, Mich. 201 122 59 9 3 7 6
Evansville, Ind. 60 42 12 - 5 1 1
Fort Wayne, Ind. 54 42 8 4 - - 5
Gary, Ind. U U U U U U U
Grand Rapids, Mich. 40 26 7 5 - 2 1
Indianapolis, Ind. 186 134 33 7 7 5 13
Lansing, Mich. 39 29 7 2 - 1 3
Milwaukee, Wis. 117 81 17 12 4 3 15
Peoria, Ill. 28 18 8 1 1 - 2
Rockford, Ill. 42 28 12 1 1 - 3
South Bend, Ind. 42 35 3 3 1 - 2
Toledo, Ohio 108 82 18 2 4 2 6
Youngstown, Ohio 69 55 10 3 1 - 2
W.N. CENTRAL 714 511 114 39 17 18 42
Des Moines, Iowa U U U U U U U
Duluth, Minn. 26 21 5 - - - -
Kansas City, Kans. 28 18 7 2 1 - 2
Kansas City, Mo. 104 61 15 5 3 5 2
Lincoln, Nebr. 33 26 6 1 - - 1
Minneapolis, Minn. 168 129 23 9 3 4 16
Omaha, Nebr. 96 62 19 9 2 4 9
St. Louis, Mo. 132 103 18 3 5 3 8
St. Paul, Minn. 58 40 10 6 1 1 3
Wichita, Kans. 69 51 11 4 2 1 1
S. ATLANTIC 1,094 720 208 105 29 32 67
Atlanta, Ga. 186 99 44 26 3 14 3
Baltimore, Md. 149 87 33 19 9 1 15
Charlotte, N.C. 80 54 14 7 2 3 9
Jacksonville, Fla. 119 90 19 9 - 1 3
Miami, Fla. 104 60 24 13 6 1 -
Norfolk, Va. 60 37 9 9 2 3 6
Richmond, Va. 79 55 13 7 2 2 4
Savannah, Ga. 63 46 11 2 1 3 7
St. Petersburg, Fla. 72 56 10 2 2 2 4
Tampa, Fla. 173 129 31 9 2 2 16
Washington, D.C. U U U U U U U
Wilmington, Del. 9 7 - 2 - - -
E.S. CENTRAL 589 395 108 57 17 12 37
Birmingham, Ala. U U U U U U U
Chattanooga, Tenn. 63 47 7 9 - - 5
Knoxville, Tenn. 73 50 12 7 3 1 4
Lexington, Ky. 38 26 5 3 2 2 4
Memphis, Tenn. 140 93 29 13 3 2 12
Mobile, Ala. 54 34 13 3 3 1 -
Montgomery, Ala. 41 28 6 4 3 - 4
Nashville, Tenn. 180 117 36 18 3 6 8
W.S. CENTRAL 1,357 866 281 131 49 30 90
Austin, Tex. 86 48 19 11 2 6 4
Baton Rouge, La. 31 22 5 3 - 1 -
Corpus Christi, Tex. 66 47 11 5 2 1 5
Dallas, Tex. 168 93 39 27 7 2 9
El Paso, Tex. 70 56 10 1 2 1 7
Ft. Worth, Tex. 102 68 20 5 9 - 10
Houston, Tex. 390 225 88 52 17 8 26
Little Rock, Ark. 61 41 14 3 1 2 2
New Orleans, La. U U U U U U U
San Antonio, Tex. 201 139 36 15 4 7 12
Shreveport, La. 64 47 11 2 3 1 3
Tulsa, Okla. 118 80 28 7 2 1 12
MOUNTAIN 1,003 680 196 75 31 21 68
Albuquerque, N.M. 123 84 20 13 1 5 1
Boise, Idaho 32 23 6 3 - - 4
Colo. Springs, Colo. 59 38 16 2 2 1 5
Denver, Colo. 97 66 18 5 2 6 5
Las Vegas, Nev. 178 115 41 14 6 2 7
Ogden, Utah 24 15 6 2 1 - 3
Phoenix, Ariz. 192 140 32 13 3 4 23
Pueblo, Colo. 37 28 8 - - 1 2
Salt Lake City, Utah 108 68 16 10 12 2 10
Tucson, Ariz. 153 103 33 13 4 - 8
PACIFIC 1,750 1,205 319 150 38 38 136
Berkeley, Calif. 17 11 4 2 - - -
Fresno, Calif. 75 56 10 3 1 5 7
Glendale, Calif. 28 25 1 2 - - 3
Honolulu, Hawaii 75 58 7 7 2 1 7
Long Beach, Calif. 75 54 14 2 2 3 11
Los Angeles, Calif. 401 270 81 32 11 7 15
Pasadena, Calif. 18 14 2 2 - - 3
Portland, Oreg. 132 88 27 9 2 6 6
Sacramento, Calif. 171 131 24 9 5 2 30
San Diego, Calif. 135 83 29 20 3 - 9
San Francisco, Calif. 120 79 25 14 1 1 12
San Jose, Calif. 186 121 38 15 6 6 18
Santa Cruz, Calif. 26 20 4 2 - - 3
Seattle, Wash. 144 88 26 23 3 4 4
Spokane, Wash. 55 41 11 1 - 2 3
Tacoma, Wash. 92 66 16 7 2 1 5
TOTAL 11,489**** 7,817 2,189 927 289 249 734
---------------------------------------------------------------------------------------------------------------
U: Unavailable -: no reported cases
* Mortality data in this table are voluntarily reported from 122 cities in the United States, most of which have populations
of 100,000 or more. A death is reported by the place of its occurrence and by the week that the death certificate was
filed. Fetal deaths are not included.
** Pneumonia and influenza.
*** Because of changes in reporting methods in these 3 Pennsylvania cities, these numbers are partial counts for the current
week. Complete counts will be available in 4 to 6 weeks.
**** Total includes unknown ages.
===================================================================================================================================
Return to top. Disclaimer All MMWR HTML versions of articles are electronic conversions from ASCII text into HTML. This conversion may have resulted in character translation or format errors in the HTML version. Users should not rely on this HTML document, but are referred to the electronic PDF version and/or the original MMWR paper copy for the official text, figures, and tables. An original paper copy of this issue can be obtained from the Superintendent of Documents, U.S. Government Printing Office (GPO), Washington, DC 20402-9371; telephone: (202) 512-1800. Contact GPO for current prices. **Questions or messages regarding errors in formatting should be addressed to mmwrq@cdc.gov.Page converted: 09/19/98 |
|||||||||
This page last reviewed 5/2/01
|