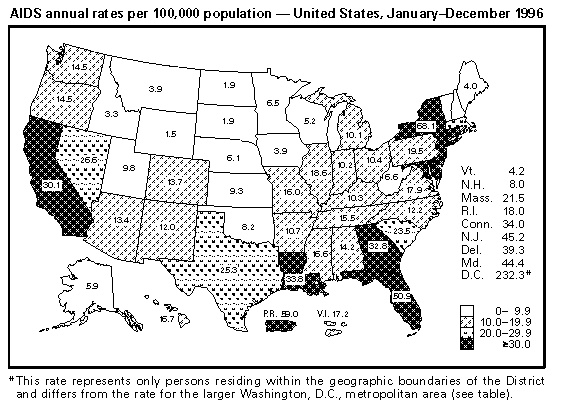
The following map (Figure_1) provides the annual rates of
acquired immunodeficiency syndrome (AIDS) per 100,000 population,
by
state of residence from January through December 1996. The
accompanying
table (Table_1) lists the metropolitan areas with the 50
highest
annual rates of AIDS per 100,000 population.
More detailed information about AIDS cases is provided in the
HIV/AIDS Surveillance Report, single copies of which are available
from the CDC National AIDS Clearinghouse, P.O. Box 6003, Rockville,
MD 20849-6003; telephone (800) 458-5231 or (301) 217-0023. Internet
users can view an electronic copy of the report by accessing CDC's
World-Wide Web home page (http://www.cdc.gov), then selecting
"Publications & Products."
Additional information abstracted from AIDS cases reported in
the United States through 1995 is available from the AIDS Public
Information Data Set, computer software designed for use with an
MS-DOS-based microcomputer. The software can be downloaded from the
World-Wide Web site http://www.cdc.gov/nchstp/hiv_aids/
software.htm. Copies are available from the CDC National AIDS
Clearinghouse by requesting inventory number D206. Figure_1
Table_1 Note:
To print large tables and graphs users may have to change their printer settings to landscape and use a small font size.
Metropolitan area * with the 50 highest AIDS annual rates per 100,000
population -- United States, January-December 1996
=======================================================================
Metropolitan area  of residence         Rate
-----------------------------------------------------------------------
New York, N.Y.                         120.1
Miami, Fla.                             99.4
Jersey City, N.J.                       97.7
San Francisco, Calif.                   95.0
West Palm Beach, Fla.                   85.4
Fort Lauderdale, Fla.                   83.6
Newark, N.J.                            73.9
San Juan, Puerto Rico                   70.4
Baltimore, Md.                          61.6
Baton Rouge, La.                        58.5
New Orleans, La.                        58.2
Washington, D.C.                        47.3
Atlanta, Ga.                            46.4
Houston, Tex.                           45.3
Wilmington, Del.                        43.4
Los Angeles, Calif.                     40.7
New Haven, Conn.                        37.3
Orlando, Fla.                           37.2
San Diego, Calif.                       37.1
Jacksonville, Fla.                      36.5
Bergen-Passaic, N.J.                    36.1
Tampa-Saint Petersburg, Fla.            36.1
Hartford, Conn.                         34.1
Philadelphia, Pa.                       33.9
Springfield, Mass.                      33.5
Dallas, Tex.                            29.3
Las Vegas, Nev.                         28.9
Oakland, Calif.                         28.5
Norfolk, Va.                            28.2
Memphis, Tenn.                          27.3
Austin, Tex.                            26.9
Rochester, N.Y.                         26.5
Middlesex, N.J.                         26.1
Seattle, Wash.                          26.1
San Antonio, Tex.                       25.7
Richmond, Va.                           25.6
Nassau-Suffolk, N.Y.                    24.3
Nashville, Tenn.                        24.1
Chicago, Ill.                           23.8
Louisville, Ky.                         23.4
Birmingham, Ala.                        22.7
Monmouth-Ocean, N.J.                    22.7
Riverside-San Bernardino, Calif.        21.7
Denver, Colo.                           20.9
Sarasota, Fla.                          20.8
Albany-Schenectady, N.Y.                20.7
Tucson, Ariz.                           20.4
Boston, Mass.                           19.0
Saint Louis, Mo.                        18.8
Portland, Ore.                          18.5
Providence, R.I.                        18.5
-----------------------------------------------------------------------
* Includes only metropolitan areas with a population >=500,000.
  Metropolitan areas are named for a central city or county, may
  include several cities and counties, and may cross state boundaries.
=======================================================================
Disclaimer
All MMWR HTML versions of articles are electronic conversions from ASCII text into HTML. This conversion may have resulted in character translation or format errors in the HTML version. Users should not rely on this HTML document, but are referred to the electronic PDF version and/or the original MMWR paper copy for the official text, figures, and tables. An original paper copy of this issue can be obtained from the Superintendent of Documents, U.S. Government Printing Office (GPO), Washington, DC 20402-9371; telephone: (202) 512-1800. Contact GPO for current prices.
**Questions or messages regarding errors in formatting should be addressed to mmwrq@cdc.gov.
