 |
|
|
|
|
|
|
| ||||||||||
|
|
|
|
|
|
|
||||
| ||||||||||
|
|
|
|
|
Persons using assistive technology might not be able to fully access information in this file. For assistance, please send e-mail to: mmwrq@cdc.gov. Type 508 Accommodation and the title of the report in the subject line of e-mail. Chlamydia trachomatis Genital Infections -- United States, 1995Genital tract infections with Chlamydia trachomatis are a major cause of pelvic inflammatory disease (PID), ectopic pregnancy, and infertility among women, and perinatal transmission of C. trachomatis to infants can cause neonatal conjunctivitis and pneumonia. In 1994, the estimated cost of untreated chlamydial infections and their complications was $2 billion in the United States (1). To determine the number of reported cases of infection and to assess the impact of screening and treatment programs on chlamydial infection in 1995, CDC analyzed notifiable disease surveillance data on chlamydia and data on chlamydia test positivity among women screened in family-planning clinics funded through CDC and the Office of Population Affairs as a result of the Preventive Health Amendments of 1992
In 1995, all states (except Alaska) and the District of Columbia reported cases of chlamydial infection to CDC. Sixteen states (Hawaii, Idaho, Mississippi, Missouri, Nebraska, Nevada, New Hampshire, New Jersey, Oklahoma, South Dakota, Tennessee, Utah, Virginia, Washington, Wisconsin, and Wyoming) provided anonymous line-listed data to CDC for 70,101 cases of chlamydial infection among women, including 68,344 with age data. Chlamydia screening and prevalence-monitoring activities were initiated in Public Health Service (PHS) Region X in 1988 as a CDC-supported demonstration project. In 1993, chlamydia screening services for women were initiated in three additional PHS regions (III, VII, and VIII) and, in 1995, in the remaining PHS regions (I, II, IV, V, VI, and IX) **. In some regions, federally funded chlamydia screening supplements local- and state-funded screening programs. Data about trends in chlamydia test positivity (number of positive tests divided by number of adequate tests performed) were available for Region X (approximately 70,000 tests per year) for 1988-1995 and for Region III (approximately 100,000 tests per year) and Region VIII (approximately 50,000 tests per year) for 1994-June 1996. In 1995, a total of 477,638 cases of chlamydial infection were reported to CDC, representing a rate of 182.2 cases per 100,000 population. State-specific rates for women ranged from 46.4 to 622.0 per 100,000 (Table_1); rates were highest in western and midwestern states ***. The overall reported rate for women (290.3) was nearly six times higher than that for men (52.1). Of the 68,344 cases in women for whom age data were available, 2452 (4%) were aged less than or equal to 14 years; 31,511 (46%), aged 15-19 years; 22,540 (33%), aged 20-24 years; and 11,841 (17%), aged greater than or equal to 25 years. In 1995, state-specific chlamydia test positivity among women aged 15-24 ye 2.8% to 9.4% (Figure_1). During 1988-1995, among women participating in the screening programs in Region X Chlamydia Project family-planning clinics, the annual rate of chlamydia test positivity declined 65% (from 9.3% to 3.3%). Rates declined substantially for all age groups, although they were persistently highest among adolescents (Figure_2). Preliminary data from the Region III Chlamydia Project indicate that from 1994 to January-June 1996, the annual positivity rate among women aged less than or equal to 19 years declined 31% (from 7.8% to 5.4%). During this period, the annual positivity rate among women aged less than or equal to 19 years declined 16% (from 5.5% to 4.6%) in the Region VIII Chlamydia Project. Reported by: Div of Sexually Transmitted Disease Prevention, National Center for HIV, STD, and TB Prevention, CDC. Editorial NoteEditorial Note: In the United States, chlamydial infection is the most common infectious disease notification to state health departments and CDC (3). During 1987-1995, the annual reported rate of chlamydial infections increased 281% (from 47.8 to 182.2 cases per 100,000), while the number of states that require reporting of this infection increased from 22 to 48. The findings in this report document the sustained high rates of chlamydial infections among U.S. women through 1995. Reported case rates primarily reflect chlamydial infections identified during screening of asymptomatic women. Screening is an essential component of chlamydia surveillance because, even though infection can cause extensive inflammation and scarring of the genital tract, most infected women have only mild manifestations or are asymptomatic. In states with low rates of screening and treatment, many chlamydial infections may not be identified or treated; consequently, state-specific rates of chlamydial infection may be low even though actual morbidity is high (4). The low reported rate of chlamydial infection among men reflects low rates of testing among this group; most men with cases of chlamydial urethritis are treated for presumptive infection without confirmatory microbiologic testing, often as the result of a Gram-stain diagnosis of nongonococcal urethritis. Increased use of chlamydia testing among men would facilitate partner notification, evaluation, treatment, and reporting. In addition, approximately half of men with chlamydial infection may be asymptomatic, and screening for chlamydia is limited among men, including those at high risk for infection. Although notifiable disease surveillance data are an important indicator of morbidity, chlamydia positivity rates among women attending family-planning clinics provide a more accurate measure of disease burden in this population. Based on analysis of data from universally tested clinic populations, comparisons of positivity rates (which may include more than one test for some patients) with prevalence rates (which are based on a single test per patient) indicate that positivity rates frequently underestimate prevalence, but generally by less than or equal to 10% (e.g., a positivity rate of 10% may correspond to a prevalence of 11%) (CDC, unpublished data, 1996). Positivity rates can be a useful indicator when prevalence data are not available. Declining positivity rates documented by the regional chlamydia screening projects confirm the effectiveness of screening and treatment of women in reducing the prevalence of infection. Both the case reports and the positivity data from family-planning clinics emphasize the continuing high burden of chlamydial disease in adolescent and young adult women. Data provided to CDC by the U.S. Department of Labor also documented high prevalences of infection among young women: in 1995, state-specific prevalence of infection among 16- to 24-year-old female entrants into the U.S. Job Corps (an economically disadvantaged population) ranged from 4.2% to 17.1% (5). In 1993 (the most recent year for which data were available), an estimated 313,000 cases of PID were diagnosed in emergency departments in the United States (National Hospital Ambulatory Medical Care Survey), and 116,000 patients were discharged from the hospital with this diagnosis (National Hospital Discharge Survey) (5). Although gonorrhea continues to cause a substantial proportion of PID cases, chlamydial infections also are an important cause of PID. A recent randomized trial of chlamydia screening among patients of a health-maintenance organization indicated that, for asymptomatic women screened and treated for chlamydial infection, the rate of subsequent PID was approximately 50% lower than for women who were not screened (6). Expansion of chlamydial screening among women could prevent a substantial proportion of PID cases. In addition, because chlamydial infections enhance transmission of human immunodeficiency virus (HIV) infection, prevention of chlamydial infection can assist in preventing sexual transmission of HIV infection among populations at risk for both diseases (7). In 1993, CDC recommended routine screening for chlamydia in all sexually active females aged <20 years at least annually, and annual screening of women aged greater than or equal to 20 years with one or more risk factors for this disease (i.e., lack of barrier contraception and new or multiple sex partners during the preceding 3 months) (8). As an alternative to risk-based criteria such as these, some public health programs can obtain comparable sensitivity and test a similar proportion of female clinic patients by screening all sexually active women aged <30 years (CDC, unpublished data, 1996). In 1997, a new Health Plan Employer Data Information Set (HEDIS) measure will evaluate use of a quality- assurance criterion for screening of all sexually active women aged <25 years enrolled in managed-care organizations (9). Despite availability since the 1980s of nonculture diagnostic tests for chlamydia, many sexually active women at risk for chlamydial infection in the United States have not been screened annually -- in part because they are not offered testing by their public or private health-care provider. Declining test prices and a new generation of DNA-amplification tests that can be performed on urine may facilitate more widespread screening for this infection. Chlamydial infections can be readily and effectively treated, using 1 g azithromycin orally in a single dose or 100 mg doxycyline orally twice daily for 7 days. Surveillance data on chlamydial infections and other sexually transmitted diseases are published by CDC (5) and can be obtained by calling (404) 639-1819. These data also are available on the World-Wide Web (http://wonder.cdc.gov/rchtml/Convert/STD/Title3600.html). Information about management of chlamydial infections and other sexually transmitted diseases is available in the 1993 Sexually Transmitted Diseases Treatment Guidelines (10), which can be obtained by calling the telephone number above and on the World-Wide Web (http://wonder.cdc.gov/rchtml/Convert/STD/ Title3301.html). References
Legislation to prevent sexually transmitted disease-related infertility. Public Health Service Act Section 318A(o)(1){42 USC 247c-1(o)(1), as amended}. ** Region I=Connecticut, Maine, Massachusetts, New Hampshire, Rhode Island, and Vermont; Region II=New Jersey, New York, Puerto Rico, and U.S. Virgin Islands; Region III=Delaware, District of Columbia, Maryland, Pennsylvania, Virginia, and West Virginia; Region IV=Alabama, Florida, Georgia, Kentucky, Mississippi, North Carolina, South Carolina, and Tennessee; Region V=Illinois, Indiana, Michigan, Minnesota, Ohio, and Wisconsin; Region VI=Arkansas, Louisiana, New Mexico, Oklahoma, and Texas; Region VII=Iowa, Kansas, Missouri, and Nebraska; Region VIII=Colorado, Montana, North Dakota, South Dakota, Utah, and Wyoming; Region IX=Arizona, California, Hawaii, and Nevada; and Region X=Alaska, Idaho, Oregon, and Washington. *** Northeast=Connecticut, Maine, Massachusetts, New Hampshire, New Jersey, New York, Pennsylvania, Rhode Island, and Vermont; Midwest=Illinois, Indiana, Iowa, Kansas, Michigan, Minnesota, Missouri, Nebraska, North Dakota, Ohio, South Dakota, and Wisconsin; South=Alabama, Arkansas, Delaware, District of Columbia, Florida, Georgia, Kentucky, Louisiana, Maryland, Mississippi, North Carolina, Oklahoma, South Carolina, Tennessee, Texas, Virginia, and West Virginia; and West=Alaska, Arizona, California, Colorado, Hawaii, Idaho, Montana, Nevada, New Mexico, Oregon, Utah, Washington, and Wyoming. Table_1 Note: To print large tables and graphs users may have to change their printer settings to landscape and use a small font size.
TABLE 1. Number and rate * of reported cases of Chlamydia
trachomatis infection, by state and sex -- United States, 1995 +
======================================================================
                             Women               Men
                         ---------------    --------------
State                     Cases    Rate     Cases    Rate
----------------------------------------------------------------------
Alabama                   2,888   130.6       285    14.0
Alaska                      NR &     --        NR      --
Arizona                   8,315   390.1     1,746    83.7
Arkansas                    596    46.4        79     6.6
California               34,934   221.2     7,343    46.5
Colorado                    NA @     --        NA      --
Connecticut               5,624   333.8       816    51.3
Delaware                  2,295   622.0       406   116.6
District of Columbia      1,449   490.7       216    83.4
Florida                  18,251   250.1     4,043    58.9
Georgia                  10,263   277.5       930    26.5
Hawaii                    1,878   319.2       257    42.9
Idaho                     1,370   234.7       369    63.7
Illinois                 20,443   336.5     4,202    73.0
Indiana                   7,564   253.6     1,537    54.5
Iowa                      4,210   288.0       879    63.7
Kansas                    4,453   341.3       860    68.2
Kentucky                  5,995   301.8       909    48.5
Louisiana                 7,569   336.5     1,542    73.7
Maine                     1,024   160.9       120    19.8
Maryland                  7,646   294.8     1,094    44.7
Massachusetts             6,237   197.9     1,165    39.9
Michigan                 18,750   382.5     2,916    62.8
Minnesota                 4,681   199.8     1,351    59.6
Mississippi                 849    60.5        63     4.9
Missouri                 10,866   394.8     1,244    48.4
Montana                     995   227.1       203    47.0
Nebraska                  2,346   280.0       526    65.8
Nevada                    2,649   352.9       400    51.3
New Hampshire               725   123.9       173    30.7
New Jersey                3,902    95.2       154     4.0
New Mexico                3,721   435.5       564    67.9
New York                 24,600   261.0     2,086    23.9
North Carolina           13,589   367.0     2,191    62.7
North Dakota              1,025   318.8       299    93.5
Ohio                     24,883   431.7     4,048    75.1
Oklahoma                  4,467   266.0       598    37.4
Oregon                    4,145   260.1     1,320    85.3
Pennsylvania             20,290   323.7     2,671    46.0
Rhode Island              1,598   311.0       304    63.9
South Carolina            6,932   366.3       813    45.7
South Dakota              1,039   280.9       274    76.3
Tennessee                10,517   386.9     2,637   103.9
Texas                    38,517   405.8     6,110    66.2
Utah                      1,316   134.2       360    37.1
Vermont                     408   137.0        54    18.8
Virginia                 11,253   334.2       989    30.4
Washington                7,508   274.5     1,954    72.5
West Virginia             1,961   207.2       359    40.7
Wisconsin                 6,860   262.8     2,095    83.4
Wyoming                     560   234.0       143    59.4
Total                   383,956   290.3    65,697    52.1
----------------------------------------------------------------------
* Per 100,000 population.
+ Persons for whom sex was unknown were excluded from this analysis.
& Not reported.
@ Not available by sex.
======================================================================
Return to top. Figure_1  Return to top. Figure_2 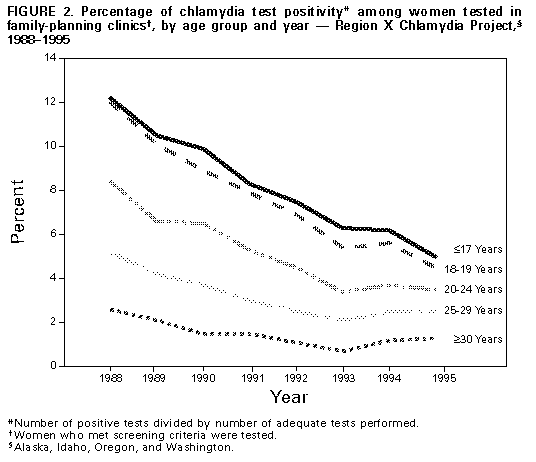 Return to top. Disclaimer All MMWR HTML versions of articles are electronic conversions from ASCII text into HTML. This conversion may have resulted in character translation or format errors in the HTML version. Users should not rely on this HTML document, but are referred to the electronic PDF version and/or the original MMWR paper copy for the official text, figures, and tables. An original paper copy of this issue can be obtained from the Superintendent of Documents, U.S. Government Printing Office (GPO), Washington, DC 20402-9371; telephone: (202) 512-1800. Contact GPO for current prices. **Questions or messages regarding errors in formatting should be addressed to mmwrq@cdc.gov.Page converted: 09/19/98 |
|||||||||
This page last reviewed 5/2/01
|