 |
|
|
|
|
|
|
| ||||||||||
|
|
|
|
|
|
|
||||
| ||||||||||
|
|
|
|
|
Persons using assistive technology might not be able to fully access information in this file. For assistance, please send e-mail to: mmwrq@cdc.gov. Type 508 Accommodation and the title of the report in the subject line of e-mail. State-Specific Variation in Rates of Twin Births -- United States, 1992-1994During 1980-1994, the number of twin births in the United States increased by 42%, from 68,339 to 97,064, and the twin birth rate (i.e., the number of twin births to total live births) increased 30%, from 18.9 to 24.6 per 1000 live births. These increases are important because the risks for preterm birth, low birthweight (LBW), long-term disability, and early death are greater for twins than for singletons (1; CDC, unpublished data, 1991). To estimate state-specific rates of twin births, CDC analyzed data from the U.S. certificates of birth for 1992-1994. This report presents the findings of this analysis of these data, which indicate that state-specific rates of twin births varied substantially, and the variations reflect factors other than state-specific differences in maternal age distributions. In this analysis, twin births were defined as individual live births in twin deliveries, rather than sets of twins (e.g., a delivery resulting in one live birth and one stillbirth is reported as one birth from a twin delivery). Because the type of twin (i.e., monozygotic {resulting from the fertilization of one ovum} or dizygotic {resulting from the fertilization of two ova}) is not listed on birth certificates, this analysis could not distinguish between twin types. To improve the reliability of the state-specific estimates of rates of twin births, data from 1992-1994 were combined. Because rates of twin births increased with increasing maternal age, state-specific rates were standardized to the U.S. maternal age distribution for 1992-1994 to account for differing age distributions. During 1992-1994, the rate of twin births in the United States was 24.0 per 1000 live births. Among the 50 states and the District of Columbia, rates ranged from 19.8 (Idaho and New Mexico) to 27.7 (Connecticut and Massachusetts). Rates were highest for the New England, Middle Atlantic, and East North Central regions (Table_1), (Figure_1). The 10 highest rates were reported for Connecticut, Massachusetts, New Jersey, Rhode Island, Illinois, Michigan, New York, Delaware, Ohio, and Maryland. In general, rates for states in the South and West were substantially lower than the overall rate for the United States; in particular, six of the 10 states in the Mountain region (New Mexico, Idaho, Utah, Montana, Arizona, and Wyoming) accounted for the lowest rates. In general, in states with rates of twin births higher than the overall rate for the United States, the maternal age distribution was older than that for the United States overall. Consequently, rates in these states generally decreased after standardization (Table_1). However, rates for nine of the 10 states with the highest observed rates remained significantly higher than the U.S. rate even after standardization. For five of these states (Connecticut, Massachusetts, Illinois, Michigan, and Ohio), rates ranked among the 10 highest after standardization. The persistent differences between rates for these states and the overall rate for the United States primarily reflected higher rates among mothers aged greater than or equal to 25 years (Figure_2); age-specific rates for states with the highest rates generally were similar to U.S. rates for mothers aged less than 25 years but higher for mothers aged greater than or equal to 25 years. In general, in states with rates of twin births lower than the overall rate for the United States, the maternal age distribution was younger than that for the United States overall. Consequently, rates in these states generally decreased after standardization (Table_1); however, rates for nine of the 10 states with the lowest observed rates remained significantly lower than the U.S. rate even after standardization. The 12 states with the lowest observed rates also had the lowest adjusted rates, although the rank order changed slightly. The state-specific variation in rates of twin births also reflected state-specific differences in racial/ethnic composition, although in some states the small numbers of twin births for which detailed age and racial/ethnic information was listed precluded reliable standardization (2; CDC, unpublished data, 1994). For 1994, the twin birth rate among non-Hispanic white mothers was 24.3; among non-Hispanic black mothers, 28.3; and among Hispanic mothers, 18.6. However, accounting for these differences does not completely account for state variation in twin births. For example, even after simultaneously adjusting for maternal age, race, and Hispanic origin, rates of twin births for Connecticut and Massachusetts remained significantly higher than the rate for the United States overall. Reported by: Reproductive Statistics Br, Div of Vital Statistics, National Center for Health Statistics, CDC. Editorial NoteEditorial Note: The findings in this report document substantial state-specific variation in rates of twin births for 1992-1994; however, this variation is accounted for only in part by state-specific differences in maternal age distributions. State variation in rates of twin births also can be influenced by differences in the use of therapies that enhance fertility (e.g., fertility drugs and techniques). These therapies have been associated with the recent increase in multiple births (3-5). Although reliable estimates of state-specific use of fertility drugs are not available, use of in vitro fertilization (IVF) varies widely by state (6). In addition, during 1992-1994, a total of 11 states had mandated insurance benefits for fertility treatment, including IVF (7). Differences among states in mandated benefits also may influence state rates of twin births. Although twin births constitute only approximately 2% of all births, the risk for LBW among twins is seven times greater than that among singletons. In addition, twins account for 17% of all LBW infants and approximately 12% of all infant deaths. Consequently, state rates of LBW are at least partially influenced by the rate of twin births in the state. For example, if rates of twin births were equal to that of the total United States, the LBW rate in Connecticut would be 5% lower than the observed rate and the New Mexico rate, 2% higher. State-specific rates of twin births also may influence other indicators of infant health, such as state infant mortality rates. The findings in this report can be used by public health agencies, health-care organizations and researchers, and policymakers in evaluating and planning programs related to infant health. The sustained increase in the proportion of multiple births in the United States requires continued assessment to clarify the influence of state-specific multiple-birth rates in state comparisons of infant health indicators. References
Table_1 Note: To print large tables and graphs users may have to change their printer settings to landscape and use a small font size. Table 1. Observed and adjusted rates of twin births, * by state -- United States, 1992-1994 ============================================================================== Region/State Observed rate Adjusted rate + % Difference ------------------------------------------------------------------------------ New England 25.5 & 24.7 & -3.1 Connecticut 27.7 & 25.6 & -7.5 Maine 23.8 23.5 -1.3 Massachussetts 27.7 & 25.4 & -8.2 New Hampshire 24.8 23.2 -6.4 Rhode Island 26.6 & 25.5 -4.0 Vermont 25.3 24.8 -2.0 Mid Atlantic 26.2 & 24.9 & -5.2 New Jersey 26.8 & 25.0 & -6.7 New York 26.0 & 24.8 & -4.6 Pennsylvania 25.6 & 24.9 & -2.7 East North Central 25.2 & 25.4 & 0.8 Illinois 26.2 & 26.1 & -0.6 Indiana 23.1 & 23.9 & 3.2 Michigan 26.2 & 26.2 & 0.1 Ohio 25.8 & 26.1 & 1.2 Wisconsin 25.1 & 24.6 -2.1 West North Central 24.9 & 25.1 & 0.8 Iowa 25.4 & 25.3 & -0.3 Kansas 23.3 23.6 1.4 Minnesota 24.2 23.3 & -3.8 Missouri 25.3 & 25.7 & 1.8 Nebraska 24.4 24.0 -1.8 North Dakota 24.0 23.5 -1.9 South Dakota 23.5 23.4 -0.4 Pacific 22.7 & 22.4 & -1.3 Alaska 21.9 & 21.6 & -1.4 California 22.0 & 21.8 & -1.1 Hawaii 20.2 & 19.8 & -1.9 Oregon 24.0 24.0 -0.2 Washington 21.3 & 21.0 & -1.5 South Atlantic 23.9 23.8 -0.4 Delaware 25.8 25.7 -0.6 District of Columbia 24.4 24.6 1.0 Florida 23.2 & 23.3 & 0.4 Georgia 24.6 25.2 & 2.6 Maryland 25.7 & 24.9 & -3.3 North Carolina 24.8 & 25.6 & 3.1 South Carolina 24.1 25.1 & 3.8 Virginia 23.7 23.4 & -1.3 West Virginia 20.7 & 22.4 & 7.9 East South Central 22.5 & 23.5 & 4.4 Alabama 24.5 25.7 & 4.9 Kentucky 22.5 & 24.0 6.3 Mississippi 25.0 & 26.9 & 7.7 Tennessee 24.1 25.3 & 4.9 West South Central 23.3 & 24.2 3.9 Arkansas 22.7 & 24.5 7.7 Louisiana 24.4 25.7 & 5.3 Oklahoma 22.2 & 23.4 5.4 Texas 21.9 & 22.6 & 3.5 Mountain 22.2 & 22.5 & 1.4 Arizona 21.8 & 22.4 & 2.7 Colorado 24.2 23.7 -2.1 Idaho 19.8 & 20.2 & 1.8 Montana 21.2 & 21.3 & 0.3 Nevada 23.2 23.6 1.7 New Mexico 19.8 & 20.6 & 3.9 Utah 21.1 & 21.3 & 0.9 Wyoming 21.8 & 22.4 2.8 Total U.S. 24.0 -- -- ------------------------------------------------------------------------------ * Live births in twin deliveries oer 1000 total live births in specified geographic area. + Direct standardization with the U.S. maternal age distribution for 1992-1994 as the standard population. & Significantly different from the U.S. rate at the 0.05 level. ============================================================================== Return to top. Figure_1 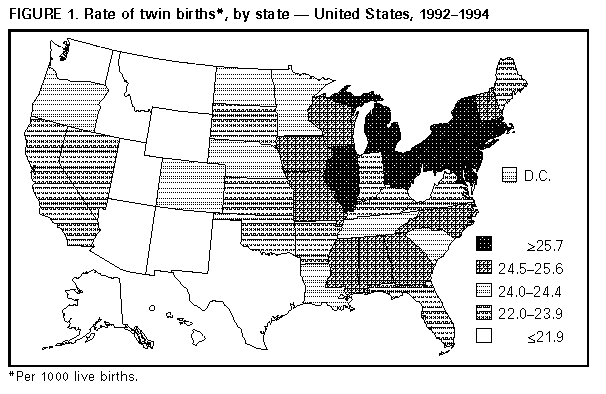 Return to top. Figure_2 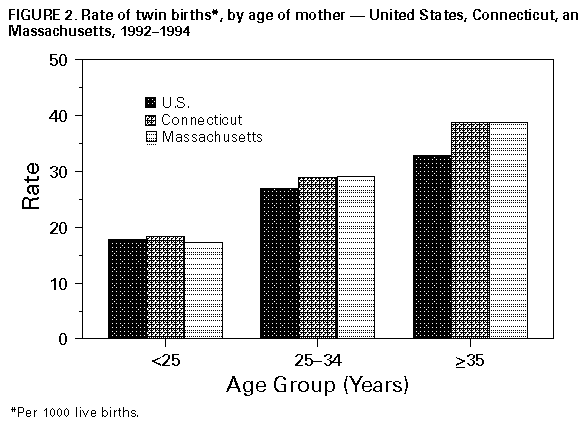 Return to top. Disclaimer All MMWR HTML versions of articles are electronic conversions from ASCII text into HTML. This conversion may have resulted in character translation or format errors in the HTML version. Users should not rely on this HTML document, but are referred to the electronic PDF version and/or the original MMWR paper copy for the official text, figures, and tables. An original paper copy of this issue can be obtained from the Superintendent of Documents, U.S. Government Printing Office (GPO), Washington, DC 20402-9371; telephone: (202) 512-1800. Contact GPO for current prices. **Questions or messages regarding errors in formatting should be addressed to mmwrq@cdc.gov.Page converted: 09/19/98 |
|||||||||
This page last reviewed 5/2/01
|