 |
|
|
|
|
|
|
| ||||||||||
|
|
|
|
|
|
|
||||
| ||||||||||
|
|
|
|
|
Persons using assistive technology might not be able to fully access information in this file. For assistance, please send e-mail to: mmwrq@cdc.gov. Type 508 Accommodation and the title of the report in the subject line of e-mail. Influenza Surveillance -- United States, 1992-93 and 1993-94Lynnette Brammer, M.P.H. Keiji Fukuda, M.D., M.P.H. Nancy Arden, M.N. Leone M. Schmeltz Lone Simonsen, Ph.D. Ali Khan, M.D. Helen L. Regnery, Ph.D. Lawrence B. Schonberger, M.D., M.P.H. Nancy J. Cox, Ph.D. Division of Viral and Rickettsial Diseases National Center for Infectious Diseases Abstract Problem/Condition: CDC conducts active surveillance annually from October through May on the emergence and spread of influenza virus variants and the impact of influenza-related morbidity and mortality. Influenza activity is also monitored throughout the year by passive surveillance. Reporting Period Covered: This report summarizes U.S. influenza surveillance from October 1992 through May 1994. Description of System: Influenza surveillance comprises four components, three of which provide weekly data from October through May: a) state and territorial epidemiologists provide estimates of local influenza activity; b) approximately 140 sentinel physicians report their total number of patient visits and the number of cases of influenza-like illness; and c) approximately 70 collaborating laboratories of the World Health Organization (WHO) report weekly influenza virus isolations and submit selected influenza isolates to CDC for antigenic analysis. Throughout the year, vital statistics offices of 121 cities report deaths related to pneumonia and influenza (P&I), providing an index of the impact of influenza on mortality. Results: Influenza B viruses predominated during the 1992-93 influenza season, but influenza A(H3N2) isolates increased and were associated with outbreaks in nursing homes at the end of the season. The increase in influenza A(H3N2) activity was associated with a rise in P&I-related mortality. Preseason outbreaks of influenza A(H3N2) virus were reported during August and September 1993 in Louisiana. In the past, preseason outbreaks of influenza have been associated with earlier than usual epidemic-level activity. During the 1993-94 influenza season, activity rose during November and December and peaked earlier than usual, during the last week of December and the first week of January; influenza A(H3N2) viruses predominated. Interpretation: The change in predominance from influenza B to influenza A in the spring of 1993 emphasizes the importance of annual influenza surveillance. Although influenza vaccine is effective against both influenza A and B, the antiviral drugs amantadine and rimantadine are effective only against influenza A. Outbreaks during the summer of 1993 emphasize that influenza should be considered a possible cause of respiratory infections during summer and early autumn. Actions Taken: Surveillance data were provided weekly throughout the influenza season to public health officials, WHO, and health-care providers. INTRODUCTION Influenza remains a cause of substantial morbidity and mortality in the United States (1). During influenza epidemics, visits to physicians, clinics, and emergency rooms, as well as hospitalizations caused by influenza-related complications, may increase. Persons greater than or equal to 65 years of age and those with underlying chronic health conditions, including cardiovascular disease, pulmonary disease, and certain metabolic conditions are at increased risk for complications of influenza infection and are more likely than the general population to be hospitalized if infected. During major epidemics, hospitalization rates among the elderly and persons who have underlying chronic health problems may increase twofold to fivefold compared with nonepidemic periods (2). Influenza epidemics also are associated with increased mortality. Since 1968-69, the influenza virus subtype generally associated with the highest mortality has been influenza A(H3N2). During nine of 20 influenza seasons (from 1972-73 through 1991-92), greater than 20,000 influenza-associated excess deaths occurred each season; during four of these seasons, greater than 40,000 deaths occurred (CDC, unpublished data). Although there is season-to-season variability, in recent years greater than 90% of influenza-associated deaths have occurred among persons greater than or equal to 65 years of age (3). Annual vaccination of persons at high risk for influenza-associated complications is the most effective means of reducing the impact of influenza and is recommended by the Advisory Committee on Immunization Practices for these persons and their frequent contacts (3). Typically, one or two of the three vaccine components are updated each year because influenza viruses undergo continual antigenic change. Eventually, the circulating viruses change enough that the previous year's vaccine offers diminished protection. Even when circulating viruses remain relatively unchanged, immunity induced by the influenza vaccine declines over time. Antiviral agents, which are effective only against type A influenza viruses, can be a useful adjunct to vaccination, but chemoprophylaxis is not a substitute for vaccination. CDC conducts active influenza surveillance each year from October through May * to provide timely information to health-care providers and the general public regarding current influenza activity levels and circulating virus types. In addition, information about the worldwide circulation of virus strains forms the basis for selecting the optimal vaccine components for the following year. This report summarizes influenza activity in the United States for the influenza seasons from October 1992 through May 1994. METHODS Sources of data for influenza surveillance during the 1992-93 and 1993-94 seasons were similar to those in previous years: State and Territorial Reports. Statewide or territorywide influenza activity, as assessed by the state or territorial epidemiologist, was reported weekly from October through May as either widespread (outbreaks of influenza-like illness {ILI} ** or culture-confirmed influenza in counties having a combined population of greater than or equal to 50% of the state's population), regional (outbreaks of ILI or culture-confirmed influenza in counties having a combined population of less than 50% of the state's total population), sporadic (sporadically occurring cases of ILI or culture-confirmed influenza, with no outbreaks detected), or no activity. Sentinel Physician Surveillance Network. Each week from October through May, approximately 140 volunteer family-practice physicians reported the number of patient visits per week, the number of those patients examined for ILI, *** and the number of hospitalizations for ILI or related complications, by age group. A subset of the physicians submitted nasal and throat swabs to a contract laboratory for virus isolation. World Health Organization (WHO) Collaborating Laboratories. Each week from October through May, approximately 70 WHO collaborating laboratories in the United States reported the total number of specimens received for respiratory virus testing and the number of positive isolates of influenza A(H1N1), A(H3N2), A(not subtyped), or influenza B, by age group ( less than 1, 1-4, 5-24, 25-44, 45-64, and greater than or equal to 65 years of age, or unknown). Most WHO laboratories were in state or local health departments, with a few in universities or hospitals. A subset of the isolates obtained in these laboratories was submitted for complete antigenic characterization and antiviral resistance testing to the WHO Collaborating Center for Surveillance, Epidemiology and Control of Influenza, CDC. 121 Cities Surveillance System. Each week throughout the year, the vital statistics offices of 121 cities reported the total number of death certificates by week and the number of death certificates in which pneumonia was identified as the underlying cause of death or in which influenza was mentioned in any position on the certificate. These data were used to calculate a pneumonia and influenza (P&I) mortality curve. A periodic regression model that incorporated a robust regression procedure was applied to produce a seasonal baseline of P&I deaths since 1983 and to calculate "excess" deaths above the baseline. An increase of 1.645 standard deviations above the seasonal baseline of P&I deaths was considered the epidemic threshold (i.e., the point at which the observed proportion of deaths attributed to pneumonia or influenza was significantly higher than the deaths expected at that time of the year in the absence of substantial influenza-related mortality). RESULTS 1992-93 Influenza Season Reports from State and Territorial Epidemiologists State and territorial epidemiologists first reported sustained regional influenza activity during the week ending December 19,1992 (week 51), and widespread activity 2 weeks later. This surveillance system component indicated that influenza activity in the United States peaked the week ending February 13, 1993 (week 6), when state and territorial epidemiologists reported regional or widespread activity in 30 states. Peak activity continued through the week ending February 20, 1993 (week 7), with 28 states reporting regional or widespread activity. No state reported widespread activity after the week ending April 10, 1993 (week 14). Regional activity was reported through the week ending May 22, 1993 (week 20) (Figure_1). Sentinel Physicians Surveillance Network Nationwide, the percentage of patient visits to sentinel physicians for ILI rose above baseline levels (0%-3%) during the week ending December 26, 1992 (week 52), peaked at 6% during the weeks ending February 6 and February 13, 1993 (weeks 5 and 6), and returned to baseline levels during the week ending March 20, 1993 (week 11) (Figure_2). On a regional level, the mountain region reported an earlier peak in activity and a higher percentage of patient visits due to ILI than the rest of the nation (Figure_3). Influenza activity in the New England region lagged behind the rest of the nation and peaked during the week ending March 13, 1993 (week 10). Patients in the age groups 5-24 years and 25-44 years accounted for 29% and 28%, respectively, of visits for ILI. Persons greater than or equal to 65 years of age accounted for only 10% of physician visits for ILI but 50% of ILI-associated hospitalizations. Ninety-eight physicians submitted 290 respiratory specimens for virus isolation, of which 58 (20%) were positive for influenza. Of these, 15 (26%) were influenza type A and 43 (74%) were influenza type B. WHO Collaborating Laboratories The WHO collaborating laboratories tested 36,452 specimens for respiratory viruses during the 1992-93 influenza season. From September 27, 1992, through May 22, 1993, 4,377 influenza viruses were isolated, of which 3,089 (71%) were influenza type B and 1,288 (29%) were influenza type A (Figure_4). Of the 717 influenza type A viruses that were subtyped, 645 (90%) were A(H3N2) and 72 (10%) were A(H1N1). Overall, influenza activity as determined by the WHO collaborating laboratories peaked during the week ending February 13,1993 (week 6), during which 410 influenza isolates were reported. Influenza B virus isolates were reported first during the week ending October 24,1992 (week 43). The number of influenza B isolates increased during December and peaked during the week ending February 13, 1993 (week 6), but continued to be reported through the week ending May 22, 1993 (week 20). The first influenza A isolate was reported during the week ending November 7, 1992 (week 45), but isolates were not reported during each week until the week ending January 9, 1993 (week 1). The number of influenza A isolates peaked during the week ending March 13,1993 (week 10) (Figure_5). Nationally, influenza B viruses predominated overall, but influenza A isolates were reported more frequently than influenza B isolates from the week ending March 27, 1993 (week 12), through the week ending May 22, 1993 (week 20). Virus isolation patterns differed by region, however, with influenza A viruses predominating in New England and the Middle Atlantic region. Influenza B viruses were isolated more frequently than influenza A throughout the season in the East South Central region. Virtually all influenza type B viruses isolated in the United States and antigenically characterized by CDC's WHO Collaborating Center for Surveillance, Epidemiology, and Control of Influenza were similar to B/Panama/45/90, the influenza B component of the 1992-93 influenza vaccine. All influenza A(H1N1) viruses were related to A/Texas/36/91, the H1N1 component of the 1992-93 vaccine, or the antigenically related A/Taiwan/01/86 strain. Most of the influenza A(H3N2) viruses isolated and characterized during the 1992-93 season were similar to the antigenic variant A/Beijing/32/92 included in the 1993-94 influenza vaccine; the remaining influenza A(H3N2) viruses were antigenically similar to the 1992-93 influenza vaccine component A/Beijing/353/89 (Table_1). Persons vaccinated with the 1992-93 influenza vaccine, which contained A/Beijing/353/89-like virus, demonstrated a diminished serologic response to A/Beijing/32/92-like viruses. 121 Cities Surveillance System From October 3, 1992, through March 5, 1993, the proportion of deaths attributable to P&I slightly exceeded the epidemic threshold during the weeks ending October 24, 1992 (week 43), and February 20, 1993 (week 7). Sustained excess mortality began during the week ending March 13, 1993 (week 10), and continued for 10 weeks, through the week ending May 15, 1993 (week 19). The proportion of all deaths associated with P&I peaked at 7.7% during the week ending March 27, 1993 (week 12), which was substantially higher than the expected baseline of 6.46% for this week (Figure_6). Outbreak Surveillance The first reported culture-confirmed influenza B outbreak of the 1992-93 influenza season began during the week ending December 5, 1992 (week 45). The outbreak occurred among students in a high school in Washington State and was associated with an absenteeism rate of 12% (4). Most outbreaks reported early in the season were among school-age children; however, influenza B virus outbreaks also occurred among nursing-home residents (5). The increased circulation of influenza A(H3N2) viruses late in the influenza season was paralleled by increases in P&I-associated mortality and the number of outbreaks reported among nursing homes and other chronic-care facilities, particularly in areas of highest influenza A(H3N2) activity (New England, Mountain, Middle Atlantic, and South Atlantic regions) (6). 1993-94 Influenza Season Reports from State and Territorial Epidemiologists State and territorial epidemiologists first reported sustained regional influenza activity during the week ending November 13, 1993 (week 45), followed by widespread activity 4 weeks later. This surveillance component demonstrated peak influenza activity in the United States during the week ending January 8, 1994 (week 1), when 33 states and the District of Columbia reported regional or widespread activity. No state reported widespread activity after the week ending February 26, 1994 (week 8). Regional activity was last reported for the week ending April 9, 1994 (week 14) (Figure_1). Sentinel Physicians Surveillance Network The percentage of patient visits to sentinel physicians for ILI rose above the baseline level during the week ending December 18, 1993 (week 50). Patient visits for ILI peaked at 8% during the week ending January 1,1994 (week 52), and returned to baseline levels during the week ending February 5,1994 (week 5) (Figure_2). The highest percentages (12%-14%) of office visits to sentinel physicians for ILI occurred in the East North Central, West South Central, and Pacific regions. Persons greater than or equal to 65 years of age accounted for 8% of visits for ILI but 51% of associated hospitalizations. Sentinel physicians submitted 349 nasal and throat swabs for respiratory virus testing; 92 (26%) were positive for influenza viruses. All positive specimens were influenza type A. WHO Collaborating Laboratories From September 12, 1993, through June 11, 1994, the WHO collaborating laboratories tested 36,764 specimens and identified 4,257 (12%) influenza isolates, of which 4,222 (99%) were influenza A and 35 (1%) were influenza B (Figure_4). Of these, 2,913 influenza A isolates were subtyped, and 2,898 (99%) were influenza A(H3N2). The number of influenza A isolates peaked during the first week of January. Most of the antigenically characterized viruses were similar to the 1993-94 vaccine strain, A/Beijing/32/92, although some viruses were more similar to the antigenic variant A/Shangdong/09/93. Influenza B isolates associated with sporadic ILI cases were recovered throughout the season, with a slight increase in the number in March and April (Figure_5). All antigenically characterized influenza B isolates were similar to the vaccine strain, B/Panama/45/90. No reported isolations of influenza A(H1N1) were confirmed at CDC. 121 Cities Surveillance System The proportion of deaths attributable to P&I exceeded the epidemic threshold for 10 consecutive weeks, beginning with the week ending December 25, 1993 (week 51), and continuing through the week ending February 26, 1994 (week 8). This was the earliest beginning of sustained excess P&I mortality in the previous 11 years. P&I mortality peaked at 9.2% during the week ending January 22, 1994 (week 3) (Figure_6). Outbreak Surveillance During August and early September 1993, the Louisiana Department of Health and Hospitals reported three preseason outbreaks of ILI associated with influenza type A(H3N2). The first two outbreaks occurred among residents and staff of two nursing homes, and the third affected workers on a dredging barge in southern Louisiana. All three outbreaks were associated with high attack rates (range: 20% among staff of one nursing home and 64% among its residents) (7). Virologic and serologic evidence indicated that all three outbreaks were caused by A/Beijing/32/92(H3N2)-like viruses, which were first isolated in the United States during the 1992-93 season (8). Outbreaks of ILI among school-age children were reported in early November 1993 in Wyoming and Montana and in mid-November in Idaho and were associated with influenza type A(H3N2) (9). Although most reported outbreaks were in schools, outbreaks occurred among persons in all age groups; high rates of absenteeism among workers were reported commonly during peak influenza activity. Outbreaks also occurred among residents of nursing homes (10). DISCUSSION The 1992-93 influenza season was dominated by influenza B, but increasing circulation of influenza A(H3N2) viruses toward the end of the season was associated with outbreaks caused by influenza A(H3N2) viruses in nursing homes. Early in the season, when influenza B viruses predominated, outbreaks were limited mainly to school-age children, and no excess mortality was observed. Sustained excess mortality first began during the week ending March 13, 1993 (week 10), and coincided with an increase in outbreaks among nursing homes and an increase in the number of influenza A(H3N2) isolates. Since their emergence in 1968-69, influenza A(H3N2) viruses have been associated with excess influenza-associated mortality, particularly among the elderly. Most influenza A(H3N2) viruses isolated during the 1992-93 influenza season were antigenically related to A/Beijing/32/92, which first was detected in the United States in November 1992. This strain replaced A/Beijing/353/89 (the 1992-93 H3N2 influenza vaccine component) in the 1993-94 influenza vaccine. During the summer of 1993, sporadic influenza A(H3N2) activity occurred through June and three outbreaks of influenza A(H3N2) virus were detected in Louisiana during August and September. Influenza A(H3N2) predominated during the 1993-94 season, which began earlier than usual and was moderately severe. At the end of an influenza season, an increase is often reported in the number of influenza isolates of a type or subtype different from the type/subtype that predominated during that season. Frequently, the emerging influenza virus type/subtype becomes predominant in the following season. For example, influenza B predominated during the 1992-93 season, but toward the end of that season influenza A(H3N2) activity increased. Sporadic cases of influenza A(H3N2) were reported during the summer months of 1993 and outbreaks of this strain occurred during August and September. Influenza A(H3N2) was the predominant virus during the 1993-94 season. Summer outbreaks of influenza sometimes have indicated an earlier than usual influenza season. The variable epidemiology of influenza, as exemplified by these two seasons, emphasizes the importance of ongoing influenza surveillance to provide essential information to guide public health measures and interventions. Although vaccination against influenza is the most effective method of reducing the impact of influenza, the antiviral agents amantadine and rimantadine provide a useful adjunct for the prevention and treatment of influenza type A infections. Neither drug is effective against influenza type B viruses. Awareness among health-care providers of current influenza activity and circulating strains is necessary for reducing the impact of influenza and related complications. The 1992-93 influenza vaccine contained A/Texas/36/91(H1N1), A/Beijing/353/ 89(H3N2), and B/Panama/45/90. For the 1993-94 season, the influenza A(H3N2) component was updated to the A/Beijing/32/92(H3N2) strain, and the influenza A(H1N1) and B components were retained. For 1994-95, the influenza A(H3N2) component in the vaccine was updated to A/Shangdong/09/93, and the influenza A(H1N1) and B components were retained. References
* Reports from the 121 Cities Surveillance System are monitored throughout the year. ** For this surveillance component, the case definition for "influenza-like illness" is left to the discretion of each state and territorial health department. ** "Influenza-like illness" is defined for this surveillance component as an illness characterized by fever greater than or equal to 100 and cough or sore throat, in the absence of other confirmed diagnosis. Figure_1 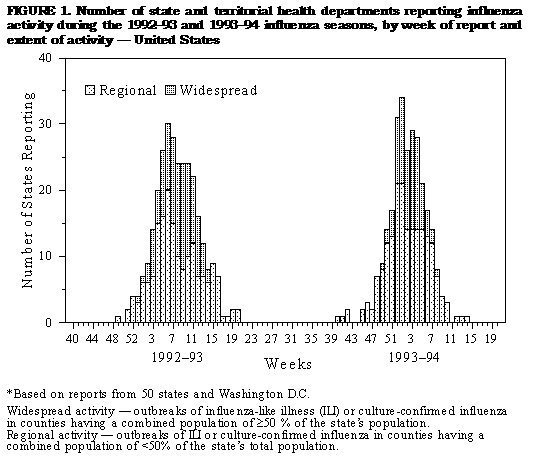 Return to top. Figure_2 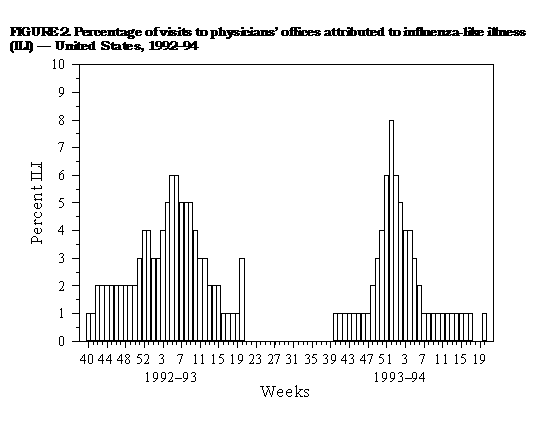 Return to top. Figure_3 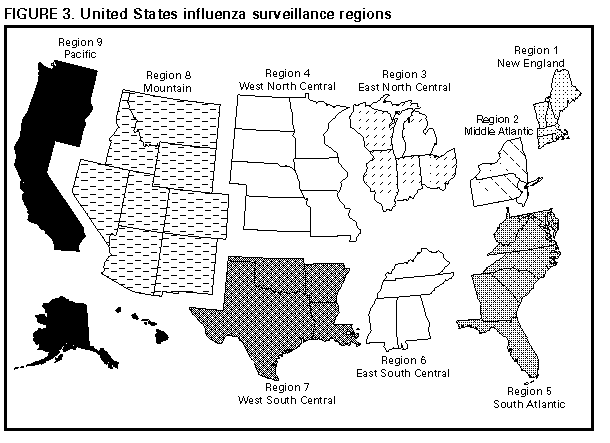 Return to top. Table_1 Note: To print large tables and graphs users may have to change their printer settings to landscape and use a small font size.
TABLE 1. Hemagglutination-inhibition reactions of influenza
A(H3N2) viruses with antisera *
===========================================================
                          Ferret antiserum
                   ----------------------------------
Viral antigen      A/Beijing/353/89   A/Beijing/32/92
-----------------------------------------------------------
A/Beijing/353/89                320                80
A/Beijing/32/92                  40               320
-----------------------------------------------------------
* A fourfold difference in hemagglutination-inhibition
  titers between two viruses is indicative of antigenic
  variation between viruses.
===========================================================
Return to top. Figure_4 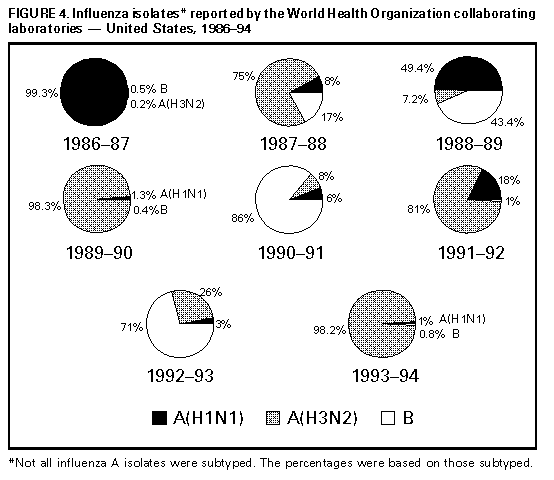 Return to top. Figure_5 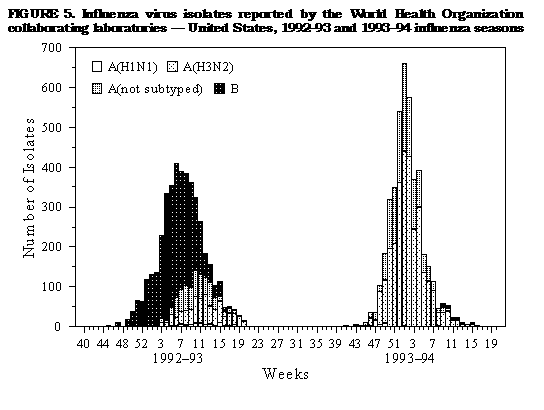 Return to top. Figure_6 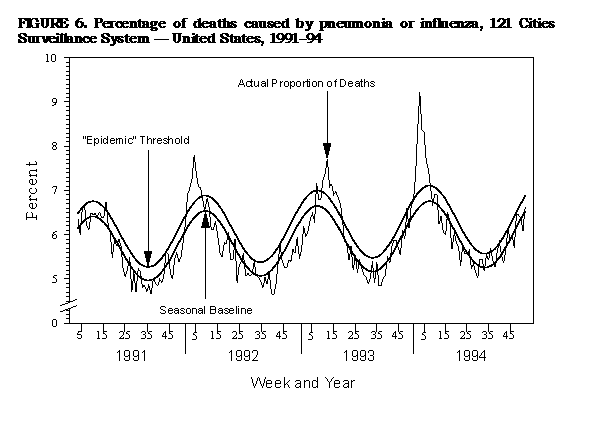 Return to top. Disclaimer All MMWR HTML versions of articles are electronic conversions from ASCII text into HTML. This conversion may have resulted in character translation or format errors in the HTML version. Users should not rely on this HTML document, but are referred to the electronic PDF version and/or the original MMWR paper copy for the official text, figures, and tables. An original paper copy of this issue can be obtained from the Superintendent of Documents, U.S. Government Printing Office (GPO), Washington, DC 20402-9371; telephone: (202) 512-1800. Contact GPO for current prices. **Questions or messages regarding errors in formatting should be addressed to mmwrq@cdc.gov.Page converted: 09/19/98 |
|||||||||
This page last reviewed 5/2/01
|