 |
|
|
|
|
|
|
| ||||||||||
|
|
|
|
|
|
|
||||
| ||||||||||
|
|
|
|
|
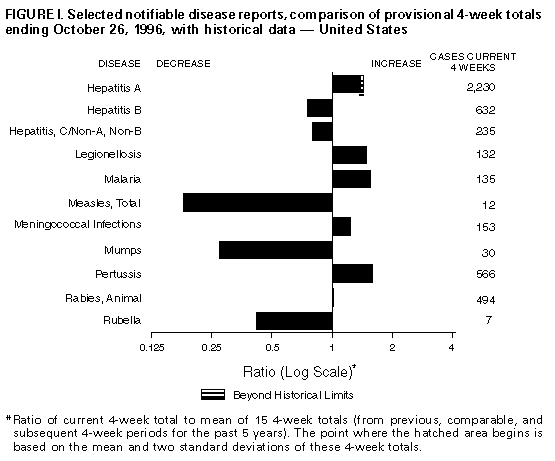
Persons using assistive technology might not be able to fully access information in this file. For assistance, please send e-mail to: mmwrq@cdc.gov. Type 508 Accommodation and the title of the report in the subject line of e-mail. Notifiable Diseases/Deaths in Selected Cities Weekly InformationFigure_I Selected notifiable disease reports, comparison of 4-week totals ending October 26, 1996, with historical data -- United States Table_I Summary -- provisional cases of selected notifiable diseases, United States, cumulative, week ending October 26, 1996 (43rd Week) Table_II Provisional cases of selected notifiable diseases, United States, weeks ending October 26, 1996 and October 28, 1995 (43rd Week) Table_III Provisional cases of selected notifiable diseases preventable by vaccination, United States, weeks ending October 26, 1996 and October 28, 1995 (43rd Week) Table_IV Deaths in 121 U.S. cities, week ending
October 26, 1996 (43rd Week)
TABLE I. Summary -- provisional cases of specified notifiable diseases, United
States, cumulative, week ending October 26, 1996 (43rd Week)
==================================================================================
                                             Cum. 1996
------------------------------------------------------
Anthrax                                              -
Brucellosis                                         67
Cholera                                              3
Congenital rubella syndrome                          1
Cryptosporidiosis*                               1,824
Diphtheria                                           1
Encephalitis:  California*                          96
               eastern equine*                       2
               St. Louis*                            -
               western equine*                       -
Hansen Disease                                      89
Hantavirus pulmonary syndrome*+                     18
HIV infection, pediatric*&                         216
Plague                                               2
Poliomyelitis, paralytic@                            -
Psittacosis                                         35
Rabies, human                                        1
Rocky Mountain spotted fever (RMSF)                601
Streptococcal toxic-shock syndrome*                 13
Syphilis, congenital**                             225
Tetanus                                             23
Toxic-shock syndrome                               112
Trichinosis                                         17
Typhoid fever                                      292
------------------------------------------------------
 * Not notifiable in all states
 + Updated weekly from reports to the Division of Viral and Rickettsial
   Diseases, National Center for Infectious Diseases (NCID).
 & Updated monthly to the Division of HIV/AIDS Prevention, National Center
   for HIV, STD, and TB Prevention (NCHSTP), last update September 24, 1996.
 @ Three suspected cases of polio with onset in 1996 have been reported to date.
** Updated quarterly from reports to the Division of STD Prevention,
   NCHSTP.
-: no reported cases
==================================================================================
Return to top. Table_II Note: To print large tables and graphs users may have to change their printer settings to landscape and use a small font size.
TABLE II. (page 1) Provisional cases of selected notifiable diseases, United States, weeks ending
October 26, 1996, and October 28, 1995 (43rd Week)
Escherichia
coli O157:H7
------------------- Hepatitis
AIDS* Chlamydia NETSS** PHLIS*** Gonorrhea C\NA,NB Legionellosis
----------------- --------- -------- -------- ------------------- ---------------- -----------------
Reporting Area Cum. Cum. Cum. Cum. Cum. Cum. Cum. Cum. Cum. Cum. Cum.
1996 1995 1996 1996 1996 1996 1995 1996 1995 1996 1995
------------------------------------------------------------------------------------------------------------------------------------------
UNITED STATES 51,611 59,358 313,100 2,260 1,205 246,075 325,738 2,754 3,325 784 976
NEW ENGLAND 2,065 2,843 13,704 305 75 5,696 6,340 99 104 62 30
Maine 32 82 733 21 - 52 75 - - 2 5
N.H. 66 77 397 38 36 80 95 8 12 3 2
Vt. 18 28 U 31 29 42 53 32 11 4 -
Mass. 997 1,236 5,829 139 10 1,844 2,249 53 74 26 19
R.I. 129 205 1,603 15 - 425 441 6 7 27 4
Conn. 823 1,215 5,142 61 - 3,253 3,427 - - N N
MID. ATLANTIC 14,243 16,197 34,718 200 42 28,667 35,765 259 390 191 166
Upstate N.Y. 1,855 1,972 N 138 15 5,520 7,569 203 199 64 44
N.Y. City 7,855 8,416 15,878 13 - 8,618 14,388 1 1 9 5
N.J. 2,905 3,858 4,161 49 5 3,971 3,468 - 153 12 24
Pa. 1,628 1,951 14,679 N 22 10,558 10,340 55 37 106 93
E.N. CENTRAL 4,076 4,419 68,204 523 352 47,674 65,581 373 277 221 288
Ohio 871 878 14,831 154 94 10,727 20,367 32 13 87 127
Ind. 498 467 8,553 78 48 5,568 7,521 8 4 40 70
Ill. 1,808 1,871 20,055 202 84 14,790 17,152 58 74 9 31
Mich. 685 917 17,382 89 68 12,974 15,046 275 186 65 28
Wis. 214 286 7,383 N 58 3,615 5,495 - - 20 32
W.N. CENTRAL 1,221 1,393 22,661 527 326 10,238 16,560 108 75 42 68
Minn. 226 302 2,702 238 214 U 2,430 3 4 5 6
Iowa 72 91 3,597 112 81 941 1,335 47 13 10 19
Mo. 626 642 9,920 61 - 6,795 9,447 33 18 9 14
N. Dak. 10 5 2 16 15 - 26 - 5 - 3
S. Dak. 10 17 829 21 - 120 182 - 1 2 3
Nebr. 83 93 2,084 49 4 786 955 7 20 12 16
Kans. 194 243 3,527 30 12 1,596 2,185 18 14 4 7
S. ATLANTIC 13,079 15,197 45,608 122 61 79,587 90,602 218 210 123 155
Del. 232 265 1,148 1 2 1,209 1,874 1 - 11 2
Md. 1,961 2,272 5,736 N 8 12,095 11,072 2 7 26 25
D.C. 1,001 872 N - - 3,497 3,925 - - 8 4
Va. 896 1,151 9,535 N 29 7,480 9,085 15 18 18 21
W. Va. 88 94 1 N 3 455 564 9 44 1 4
N.C. 677 837 - 38 12 15,664 20,321 44 49 10 31
S.C. 667 815 - 9 7 9,007 9,852 27 19 5 30
Ga. 1,867 1,997 9,798 30 - 15,096 16,853 U 15 3 14
Fla. 5,690 6,894 19,390 32 - 15,084 17,056 120 58 41 24
E.S. CENTRAL 1,749 1,916 25,026 63 52 26,771 33,783 465 845 38 51
Ky. 309 243 5,510 13 8 3,504 3,949 27 29 4 10
Tenn. 647 763 10,997 29 41 9,791 11,421 341 814 18 24
Ala. 470 520 6,923 10 3 11,089 13,839 5 2 3 6
Miss. 323 390 U 11 - 2,387 4,574 92 U 13 11
W.S. CENTRAL 5,138 5,126 32,462 63 12 24,763 45,802 401 284 19 21
Ark. 207 223 - 13 3 2,683 4,749 13 6 2 6
La. 1,177 875 6,211 6 4 6,721 9,150 186 155 2 3
Okla. 189 235 6,137 10 1 3,984 4,899 69 45 5 4
Tex. 3,565 3,793 20,114 34 4 11,375 27,004 133 78 10 8
MOUNTAIN 1,533 1,821 13,508 181 91 5,650 7,864 479 401 40 103
Mont. 33 20 - 23 - 25 59 14 14 1 4
Idaho 32 40 1,253 30 13 87 118 93 45 - 2
Wyo. 5 13 476 11 9 32 46 151 167 5 12
Colo. 406 571 - 63 36 1,077 2,371 50 60 7 37
N. Mex. 139 148 3,339 11 - 757 900 64 43 2 4
Ariz. 461 550 5,344 N 22 2,786 3,080 67 41 17 9
Utah 144 113 1,279 28 - 246 216 22 11 3 15
Nev. 313 366 1,817 15 11 640 1,074 18 20 5 20
PACIFIC 8,506 10,446 57,209 276 194 17,029 23,441 352 739 48 94
Wash. 538 779 7,583 93 72 1,673 2,264 49 187 6 20
Oreg. 359 387 4,496 68 37 515 658 6 35 1 -
Calif. 7,440 9,013 43,011 111 75 14,185 19,467 116 448 36 69
Alaska 28 62 1,005 4 2 359 571 3 1 1 -
Hawaii 141 205 1,114 N 8 297 481 178 68 4 5
Guam 4 - 168 N - 31 89 1 6 2 1
P.R. 1,792 1,951 N 17 U 318 501 83 194 - -
V.I. 17 30 N N U - - - - - -
Amer. Samoa - - - N U - 28 - - - -
C.N.M.I. 1 - N N U 11 51 - 5 - -
------------------------------------------------------------------------------------------------------------------------------------------
N: Not notifiable U: Unavailable -: no reported cases C.N.M.I.: Commonwealth of North Mariana Islands
* Updated monthly to the Division of HIV/AIDS Prevention, National Center for HIV, STD, and TB Prevention, last update September 24, 1996.
** National Electronic Telecommunications System for Surveillance.
*** Public Health Laboratory Information System.
=======================================================================================================================================================
TABLE II. (page 2) Provisional cases of selected notifiable diseases, United States, weeks ending
October 26, 1996, and October 28, 1995 (43rd Week)
Meningococcal Syphilis
Lyme Malaria Disease (Primary & Secondary) Tuberculosis Rabies, Animal
---------------- ---------------- ---------------- --------------------- ----------------- ----------------
Reporting Area Cum. Cum. Cum. Cum. Cum. Cum. Cum. Cum. Cum. Cum. Cum. Cum.
1996 1995 1996 1995 1996 1995 1996 1995 1996 1995 1996 1995
-----------------------------------------------------------------------------------------------------------------------------------------------------
UNITED STATES 11,379 9,419 1,215 1,120 2,649 2,514 9,014 13,774 15,277 17,484 5,616 6,588
NEW ENGLAND 3,555 1,809 51 42 118 119 149 302 344 412 602 1,307
Maine 49 24 7 6 12 10 - 2 21 11 89 46
N.H. 42 22 2 1 7 20 1 1 11 16 51 129
Vt. 15 8 4 1 4 9 - - 1 2 123 156
Mass. 309 122 21 14 47 40 68 54 174 231 94 381
R.I. 444 297 7 4 13 5 3 3 27 40 35 286
Conn. 2,696 1,336 10 16 35 35 77 242 110 112 210 309
MID. ATLANTIC 6,779 6,186 336 308 239 309 351 696 2,704 3,562 1,204 1,685
Upstate N.Y. 3,509 3,186 74 58 73 84 62 74 347 423 902 1,000
N.Y. City 256 383 175 168 32 47 106 310 1,315 1,995 - -
N.J. 1,393 1,568 59 60 55 71 77 139 602 638 109 295
Pa. 1,621 1,049 28 22 79 107 106 173 440 506 193 390
E.N. CENTRAL 68 399 110 142 362 350 1,294 2,392 1,652 1,632 87 93
Ohio 42 25 13 11 133 98 480 769 246 223 11 12
Ind. 23 16 13 17 54 49 174 286 148 151 8 14
Ill. 3 17 35 71 98 90 355 908 857 853 23 15
Mich. - 5 36 22 39 66 142 252 309 330 31 37
Wis. U 336 13 21 38 47 143 177 92 75 14 15
W.N. CENTRAL 139 160 43 24 209 158 297 638 386 487 447 323
Minn. 59 80 19 4 25 26 51 37 88 118 25 25
Iowa 20 12 3 3 41 29 17 40 53 54 207 112
Mo. 23 44 9 8 88 59 196 523 161 189 17 29
N. Dak. 1 - 1 1 3 1 - - 6 3 58 25
S. Dak. - - - 2 10 6 - - 17 21 105 86
Nebr. 5 5 3 3 19 15 11 12 13 20 5 5
Kans. 31 19 8 3 23 22 22 26 48 82 30 41
S. ATLANTIC 583 594 257 222 538 432 3,157 3,431 2,918 3,075 2,344 1,853
Del. 78 45 3 1 2 6 36 14 20 49 62 81
Md. 345 379 70 59 65 36 549 401 245 327 529 373
D.C. 3 3 7 16 10 7 115 95 110 88 9 11
Va. 46 50 41 50 51 57 331 507 234 255 514 373
W. Va. 11 22 5 4 12 8 3 10 50 60 88 103
N.C. 62 64 27 15 67 71 916 950 424 370 602 414
S.C. 6 16 12 1 52 54 322 497 290 271 79 111
Ga. 1 10 26 31 123 90 562 646 528 590 248 242
Fla. 31 5 66 45 156 103 323 311 1,017 1,065 213 145
E.S. CENTRAL 57 63 28 24 193 176 2,053 2,809 1,048 1,193 183 251
Ky. 15 13 3 3 26 40 125 154 192 261 36 26
Tenn. 19 28 12 10 51 68 689 745 320 359 75 86
Ala. 6 7 6 8 69 36 468 538 346 342 69 130
Miss. 17 15 7 3 47 32 771 1,372 190 231 3 9
W.S. CENTRAL 102 96 38 48 296 296 1,190 2,777 1,864 2,578 324 551
Ark. 23 7 - 2 33 30 124 433 162 195 21 42
La. 2 7 6 5 53 43 438 865 59 262 15 40
Okla. 20 40 - 1 32 34 151 159 139 326 27 28
Tex. 57 42 32 40 178 189 477 1,320 1,504 1,795 261 441
MOUNTAIN 7 12 52 55 152 180 112 185 506 550 135 165
Mont. - - 7 3 5 2 - 4 14 10 20 42
Idaho 1 - - 1 22 10 4 - 7 12 - 3
Wyo. 2 3 7 - 3 8 2 1 6 4 27 25
Colo. - - 22 24 33 45 23 96 73 68 41 9
N. Mex. 1 1 2 6 24 33 1 6 67 66 6 6
Ariz. - 1 6 10 38 52 67 43 199 264 30 54
Utah 1 1 4 6 15 15 2 4 39 37 4 15
Nev. 2 6 4 5 12 15 13 31 101 89 7 11
PACIFIC 89 100 300 255 542 494 411 544 3,855 3,995 290 360
Wash. 14 10 20 21 90 80 6 13 219 230 6 14
Oreg. 14 17 18 17 93 92 11 19 134 109 1 2
Calif. 60 73 251 204 346 307 393 510 3,288 3,437 275 337
Alaska - - 3 3 8 11 - 2 59 63 8 7
Hawaii 1 - 8 10 5 4 1 - 155 156 - -
Guam - - - 1 1 2 3 8 35 92 - -
P.R. - - - 1 4 23 112 243 63 162 43 36
V.I. - - - 2 - - - - - - - -
Amer. Samoa - - - - - - - - - 4 - -
C.N.M.I. - - - 1 - - 1 9 - 31 - -
-----------------------------------------------------------------------------------------------------------------------------------------------------
N: Not notifiable U: Unavailable -: no reported cases
=======================================================================================================================================================
Return to top. Table_III Note: To print large tables and graphs users may have to change their printer settings to landscape and use a small font size.
TABLE III. (page 1) Provisional cases of selected notifiable diseases preventable by vaccination, United
States, weeks ending October 26, 1996, and October 28, 1995 (43rd Week)
Hepatitis (Viral), by type Measles (Rubeola)
H. influenzae, --------------------------------------- -------------------------------------
invasive A B Indigenous Imported**
---------------- ----------------- ----------------- --------------- ---------------
Reporting Area Cum. Cum. Cum. Cum. Cum. Cum. Cum. Cum.
1996* 1995 1996 1995 1996 1995 1996 1996 1996 1996
------------------------------------------------------------------------------------------------------------------------------
UNITED STATES 847 939 23,132 24,779 7,989 8,207 1 407 - 46
NEW ENGLAND 25 37 328 257 162 186 - 11 - 4
Maine - 3 16 27 2 7 - - - -
N.H. 9 9 18 11 15 19 - - - -
Vt. 1 2 9 5 10 5 - 1 - 1
Mass. 13 12 166 106 57 71 - 9 - 3
R.I. 2 5 19 31 9 8 - - - -
Conn. - 6 100 77 69 76 U 1 U -
MID. ATLANTIC 152 137 1,554 1,530 1,218 1,157 - 23 - 5
Upstate N.Y. 45 36 379 387 289 313 - - - -
N.Y. City 32 34 492 724 497 349 - 9 - 3
N.J. 48 20 278 229 205 316 U 3 U -
Pa. 27 47 405 190 227 179 - 11 - 2
E.N. CENTRAL 141 162 1,906 2,731 816 920 - 6 - 7
Ohio 81 83 645 1,535 109 91 - 2 - 3
Ind. 14 20 289 157 132 186 - - - -
Ill. 32 40 460 558 210 242 - 2 - 1
Mich. 8 17 362 312 309 334 - - - 3
Wis. 6 2 150 169 56 67 - 2 - -
W.N. CENTRAL 40 69 2,080 1,628 371 534 - 20 - 2
Minn. 25 38 111 164 54 49 - 16 - 2
Iowa 5 3 310 70 66 42 - - - -
Mo. 7 21 991 1,142 179 367 - 3 - -
N. Dak. - - 112 22 2 4 - - - -
S. Dak. 1 1 41 56 5 2 - - - -
Nebr. 1 3 190 46 36 29 - - - -
Kans. 1 3 325 128 29 41 - 1 - -
S. ATLANTIC 163 186 1,186 968 1,242 1,084 - 5 - 9
Del. 2 - 15 9 7 8 - 1 - -
Md. 52 60 206 185 249 214 - - - 2
D.C. 6 - 35 24 29 20 U 1 U -
Va. 9 27 146 174 118 95 - - - 3
W. Va. 9 7 13 22 24 48 - - - -
N.C. 23 26 141 92 277 253 - 3 - 1
S.C. 4 2 46 41 81 44 - - - -
Ga. 37 59 150 52 32 62 - - - 2
Fla. 21 5 434 369 425 340 - - - 1
E.S. CENTRAL 26 10 1,076 1,694 680 710 - 2 - -
Ky. 4 4 38 41 52 60 - - - -
Tenn. 12 - 702 1,410 391 555 - 2 - -
Ala. 9 5 161 73 59 95 - - - -
Miss. 1 1 175 170 178 U U - U -
W.S. CENTRAL 34 57 4,930 3,706 1,103 1,153 - 26 - 2
Ark. - 6 425 489 66 57 - - - -
La. 4 1 162 114 124 172 - - - -
Okla. 27 21 2,029 981 59 144 - - - -
Tex. 3 29 2,314 2,122 854 780 - 26 - 2
MOUNTAIN 87 100 3,703 3,441 953 701 1 153 - 5
Mont. - - 98 132 12 19 U - U -
Idaho 1 3 208 282 79 83 - 1 - -
Wyo. 35 6 29 97 39 25 - 1 - -
Colo. 13 16 395 439 117 106 - 4 - 3
N. Mex. 10 12 319 709 343 262 1 17 - -
Ariz. 12 25 1,447 920 212 98 - 8 - -
Utah 8 10 871 617 82 58 - 117 - 2
Nev. 8 28 336 245 69 50 - 5 - -
PACIFIC 179 181 6,369 8,824 1,444 1,762 - 161 - 12
Wash. 4 9 560 733 84 166 - 51 - -
Oreg. 23 24 718 2,353 92 103 - 4 - -
Calif. 148 143 4,992 5,544 1,242 1,469 - 36 - 5
Alaska 2 1 36 42 14 11 - 63 - -
Hawaii 2 4 63 152 12 13 - 7 - 7
Guam - - 2 7 - 4 U - U -
P.R. 1 3 108 87 349 517 - 7 - -
V.I. - - - 8 - 15 U - U -
Amer. Samoa - - - 6 - - U - U -
C.N.M.I. 10 11 1 24 5 22 U - U -
------------------------------------------------------------------------------------------------------------------------------
N: Not notifiable U: Unavailable -: no reported cases
* Of 200 cases reported among children aged <5 years, serotype was reported for 45 and of those, 14 were type b.
** For imported measles, cases include only those resulting from importation from other countries.
============================================================================================================================================
TABLE III. (page 2) Provisional cases of selected notifiable diseases preventable by vaccination, United
States, weeks ending October 26, 1996, and October 28, 1995 (43rd Week)
Measles (Rubeola), cont'd.
--------------------------
Total Mumps Pertussis Rubella
-------------------------- -------------------------- --------------------------- ---------------------------
Reporting Area Cum. Cum. Cum. Cum. Cum. Cum. Cum. Cum.
1996 1995 1996 1996 1995 1996 1996 1995 1996 1996 1995
------------------------------------------------------------------------------------------------------------------------------------------
UNITED STATES 453 282 8 527 707 180 4,451 3,643 2 201 109
NEW ENGLAND 15 9 - 2 11 41 926 493 - 27 46
Maine - - - - 4 - 20 40 - - -
N.H. - - - - 1 12 102 44 - - 1
Vt. 2 - - - - 3 106 67 - 2 -
Mass. 12 2 - 2 2 26 641 312 - 21 7
R.I. - 5 - - 1 - 30 4 - - -
Conn. 1 2 U - 3 U 27 26 U 4 38
MID. ATLANTIC 28 12 2 76 102 14 399 318 - 11 13
Upstate N.Y. - 1 2 24 24 14 236 161 - 4 3
N.Y. City 12 5 - 16 16 - 29 47 - 4 8
N.J. 3 6 U 2 17 U 16 17 U 2 2
Pa. 13 - - 34 45 - 118 93 - 1 -
E.N. CENTRAL 13 15 2 90 136 62 492 457 - 3 3
Ohio 5 2 - 39 46 40 233 127 - - -
Ind. - - 1 9 9 18 73 49 - - -
Ill. 3 2 1 20 38 2 143 92 - 1 -
Mich. 3 5 - 21 43 2 38 62 - 2 3
Wis. 2 6 - 1 - - 5 127 - - -
W.N. CENTRAL 22 2 - 17 40 1 319 240 - - -
Minn. 18 - - 5 4 - 251 125 - - -
Iowa - - - 2 9 - 17 10 - - -
Mo. 3 1 - 7 22 1 34 55 - - -
N. Dak. - - - 2 1 - 1 8 - - -
S. Dak. - - - - - - 4 11 - - -
Nebr. - - - - 4 - 8 10 - - -
Kans. 1 1 - 1 - - 16 21 - - -
S. ATLANTIC 14 14 - 90 102 10 508 305 - 93 9
Del. 1 - - - - - 13 10 - - -
Md. 2 1 - 25 30 6 178 39 - - 1
D.C. 1 - U 1 - U 2 6 U 2 -
Va. 3 - - 12 21 - 71 19 - 2 -
W. Va. - - - - - - 2 - - - -
N.C. 4 - - 20 16 - 100 110 - 78 1
S.C. - - - 6 10 1 38 25 - 1 -
Ga. 2 2 - 3 8 - 17 22 - - -
Fla. 1 11 - 23 17 3 87 74 - 10 7
E.S. CENTRAL 2 - - 19 11 1 133 267 - 2 1
Ky. - - - - - - 84 24 - - -
Tenn. 2 - - 1 4 1 17 206 - - 1
Ala. - - - 3 4 - 23 35 - 2 -
Miss. - - U 15 3 U 9 2 N N N
W.S. CENTRAL 28 32 1 30 47 7 109 275 - 3 7
Ark. - 2 - 2 7 - 12 36 - - -
La. - 18 - 13 12 - 9 18 - 1 -
Okla. - - - - - 1 11 31 - - -
Tex. 28 12 1 15 28 6 77 190 - 2 7
MOUNTAIN 158 68 - 21 30 8 361 534 - 7 4
Mont. - - U - 1 U 28 3 U - -
Idaho 1 - - - 3 - 102 99 - 3 -
Wyo. 1 - - - - 1 6 1 - - -
Colo. 7 26 - 3 2 2 93 85 - 2 -
N. Mex. 17 31 N N N 5 59 107 - - -
Ariz. 8 10 - 1 2 - 27 153 - 1 3
Utah 119 - - 2 11 - 19 27 - - 1
Nev. 5 1 - 15 11 - 27 59 - 1 -
PACIFIC 173 130 3 182 228 36 1,204 754 2 55 26
Wash. 51 19 - 19 12 10 541 266 - 2 1
Oreg. 4 1 - - - - 33 50 - 1 -
Calif. 41 108 3 133 195 26 599 389 2 49 20
Alaska 63 - - 3 12 - 4 1 - - -
Hawaii 14 2 - 27 9 - 27 48 - 3 5
Guam - - U 5 4 U 1 2 U - 1
P.R. 7 3 - 1 2 - 1 1 - - -
V.I. - - U - 3 U - - U - -
Amer. Samoa - - U - - U - - U - -
C.N.M.I. - - U - 1 U - - U - -
------------------------------------------------------------------------------------------------------------------------------------------
N: Not notifiable U: Unavailable -: no reported cases
============================================================================================================================================
Return to top. Table_IV Note: To print large tables and graphs users may have to change their printer settings to landscape and use a small font size.
TABLE IV. Deaths in 121 U.S. cities* week ending
October 26, 1996 (43rd Week)
===================================================================================================================================
All Causes, By Age (Years)
------------------------------------------------------------------------ P&I**
Reporting Area All Ages >=65 45-64 25-44 1-24 <1 Total
---------------------------------------------------------------------------------------------------------------
NEW ENGLAND 579 440 87 31 12 9 31
Boston, Mass. 181 130 34 9 5 3 6
Bridgeport, Conn. 41 28 10 2 1 - 2
Cambridge, Mass. 19 16 3 - - - -
Fall River, Mass. 21 15 5 - 1 - -
Hartford, Conn. U U U U U U U
Lowell, Mass. 23 20 2 1 - - 4
Lynn, Mass. U U U U U U U
New Bedford, Mass. 34 29 4 1 - - 4
New Haven, Conn. 47 34 5 4 1 3 2
Providence, R.I. 59 47 10 1 - 1 2
Somerville, Mass. 4 4 - - - - 1
Springfield, Mass. 44 29 4 8 2 1 -
Waterbury, Conn. 39 35 1 2 1 - 5
Worcester, Mass. 67 53 9 3 1 1 5
MID. ATLANTIC 2,341 1,581 427 226 43 62 121
Albany, N.Y. 46 27 12 2 2 3 4
Allentown, Pa. 15 12 3 - - - -
Buffalo, N.Y. 110 79 15 12 1 3 11
Camden, N.J. 27 18 5 3 - 1 1
Elizabeth, N.J. 13 11 - 2 - - -
Erie, Pa.*** 56 48 6 2 - - 3
Jersey City, N.J. 44 27 10 5 - 2 1
New York City, N.Y. 1,213 803 248 115 25 22 46
Newark, N.J. 77 30 19 15 1 11 6
Paterson, N.J. 19 12 3 3 - 1 -
Philadelphia, Pa. 300 181 57 39 12 10 16
Pittsburgh, Pa.*** 73 55 12 3 - 3 4
Reading, Pa. 9 8 - 1 - - 1
Rochester, N.Y. 132 103 14 12 1 2 11
Schenectady, N.Y. 14 13 - 1 - - 2
Scranton, Pa.*** 47 38 7 2 - - 2
Syracuse, N.Y. 89 73 11 2 1 2 9
Trenton, N.J. 31 22 4 4 - 1 3
Utica, N.Y. 26 21 1 3 - 1 1
Yonkers, N.Y. U U U U U U U
E.N. CENTRAL 2,281 1,515 445 203 50 67 145
Akron, Ohio 55 36 12 3 3 1 -
Canton, Ohio 34 29 5 - - - 3
Chicago, Ill. 494 280 112 70 16 15 36
Cincinnati, Ohio 114 77 26 7 - 4 11
Cleveland, Ohio 158 102 44 8 2 2 2
Columbus, Ohio 215 150 35 16 7 7 14
Dayton, Ohio 124 94 17 9 2 2 7
Detroit, Mich. 203 118 54 20 4 7 7
Evansville, Ind. 49 36 10 3 - - 2
Fort Wayne, Ind. 71 49 11 9 - 2 6
Gary, Ind. 9 4 2 - 3 - -
Grand Rapids, Mich. 61 49 6 2 2 2 5
Indianapolis, Ind. 216 145 37 20 5 9 19
Madison, Wis. 56 42 10 2 1 1 4
Milwaukee, Wis. 138 103 14 10 1 10 9
Peoria, Ill. 43 25 4 10 3 1 2
Rockford, Ill. 44 29 10 4 - 1 6
South Bend, Ind. 44 31 10 2 - 1 2
Toledo, Ohio 90 66 17 5 1 1 8
Youngstown, Ohio 63 50 9 3 - 1 2
W.N. CENTRAL 703 514 104 36 18 18 33
Des Moines, Iowa 39 30 7 - 2 - 5
Duluth, Minn. 29 20 7 2 - - 1
Kansas City, Kans. 31 22 4 2 3 - -
Kansas City, Mo. 91 58 8 6 4 2 3
Lincoln, Nebr. 33 27 5 - - 1 5
Minneapolis, Minn. 157 119 21 11 4 2 14
Omaha, Nebr. 85 64 15 2 1 3 3
St. Louis, Mo. 114 83 18 6 - 7 -
St. Paul, Minn. 40 36 4 - - - 2
Wichita, Kans. 84 55 15 7 4 3 -
S. ATLANTIC 1,275 776 274 155 50 18 60
Atlanta, Ga. 178 97 46 27 8 - 2
Baltimore, Md. 258 153 56 36 7 5 17
Charlotte, N.C. 105 71 18 9 5 1 6
Jacksonville, Fla. 97 64 17 14 - 2 5
Miami, Fla. 95 55 26 8 5 1 1
Norfolk, Va. 50 36 6 2 3 3 6
Richmond, Va. 93 57 19 13 3 1 5
Savannah, Ga. 48 33 7 7 1 - 2
St. Petersburg, Fla. 47 37 4 4 2 - 4
Tampa, Fla. 149 96 33 13 6 1 8
Washington, D.C. 140 72 37 19 8 4 4
Wilmington, Del. 15 5 5 3 2 - -
E.S. CENTRAL 761 504 165 64 22 5 49
Birmingham, Ala. 125 74 32 11 7 - 6
Chattanooga, Tenn. 66 47 12 4 2 1 2
Knoxville, Tenn. 73 47 13 9 4 - 8
Lexington, Ky. 82 49 26 3 2 2 6
Memphis, Tenn. 143 102 28 12 1 - 10
Mobile, Ala. 105 62 26 11 5 1 2
Montgomery, Ala. 41 32 7 2 - - 4
Nashville, Tenn. 126 91 21 12 1 1 11
W.S. CENTRAL 1,449 930 282 161 39 37 77
Austin, Tex. 83 58 13 9 3 - 3
Baton Rouge, La. 70 44 15 6 1 4 3
Corpus Christi, Tex. 56 42 10 2 1 1 2
Dallas, Tex. 159 97 35 18 5 4 3
El Paso, Tex. 68 37 17 9 1 4 4
Ft. Worth, Tex. 99 68 15 11 3 2 2
Houston, Tex. 354 214 77 42 14 7 33
Little Rock, Ark. 58 35 14 7 - 2 4
New Orleans, La. 125 67 26 25 3 4 -
San Antonio, Tex. 186 132 26 16 7 5 15
Shreveport, La. 85 56 17 9 1 2 5
Tulsa, Okla. 106 80 17 7 - 2 3
MOUNTAIN 846 552 164 80 28 22 54
Albuquerque, N.M. 100 68 15 10 3 4 3
Colo. Springs, Colo. 42 25 11 2 2 2 1
Denver, Colo. 104 71 16 13 2 2 15
Las Vegas, Nev. 162 90 44 22 5 1 6
Ogden, Utah 26 19 5 1 1 - 1
Phoenix, Ariz. 151 95 27 17 4 8 10
Pueblo, Colo. 25 23 2 - - - 2
Salt Lake City, Utah 109 76 20 5 4 4 7
Tucson, Ariz. 127 85 24 10 7 1 9
PACIFIC 1,412 1,012 225 127 28 20 105
Berkeley, Calif. 12 10 2 - - - 2
Fresno, Calif. 72 45 15 9 2 1 3
Glendale, Calif. 5 5 - - - - 1
Honolulu, Hawaii 86 67 15 - 3 1 8
Long Beach, Calif. 82 62 12 6 1 1 16
Los Angeles, Calif. 224 155 32 30 5 2 10
Pasadena, Calif. 21 14 4 3 - - -
Portland, Oreg. 152 113 26 8 3 2 3
Sacramento, Calif. U U U U U U U
San Diego, Calif. 131 91 22 13 4 1 11
San Francisco, Calif. 127 91 17 17 1 1 19
San Jose, Calif. 228 165 37 16 5 5 21
Santa Cruz, Calif. 15 13 1 1 - - -
Seattle, Wash. 130 79 29 17 2 3 -
Spokane, Wash. 52 42 5 1 1 3 5
Tacoma, Wash. 75 60 8 6 1 - 6
TOTAL 11,647**** 7,824 2,173 1,083 290 258 675
---------------------------------------------------------------------------------------------------------------
U: Unavailable -: no reported cases
* Mortality data in this table are voluntarily reported from 121 cities in the United States, most of which have populations
of 100,000 or more. A death is reported by the place of its occurrence and by the week that the death certificate was
filed. Fetal deaths are not included.
** Pneumonia and influenza.
*** Because of changes in reporting methods in these 3 Pennsylvania cities, these numbers are partial counts for the current
week. Complete counts will be available in 4 to 6 weeks.
**** Total includes unknown ages.
===================================================================================================================================
Return to top. Disclaimer All MMWR HTML versions of articles are electronic conversions from ASCII text into HTML. This conversion may have resulted in character translation or format errors in the HTML version. Users should not rely on this HTML document, but are referred to the electronic PDF version and/or the original MMWR paper copy for the official text, figures, and tables. An original paper copy of this issue can be obtained from the Superintendent of Documents, U.S. Government Printing Office (GPO), Washington, DC 20402-9371; telephone: (202) 512-1800. Contact GPO for current prices. **Questions or messages regarding errors in formatting should be addressed to mmwrq@cdc.gov.Page converted: 09/19/98 |
|||||||||
This page last reviewed 5/2/01
|