 |
|
|
|
|
|
|
| ||||||||||
|
|
|
|
|
|
|
||||
| ||||||||||
|
|
|
|
|
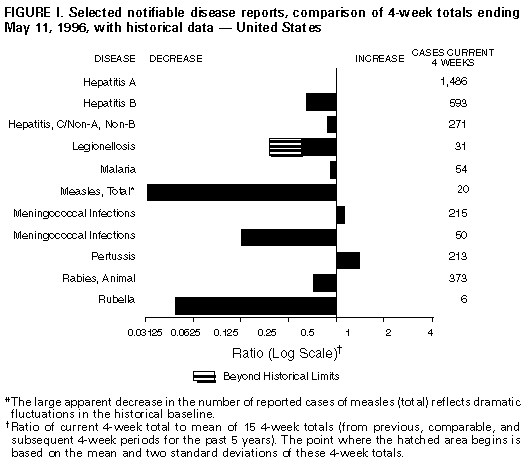
Persons using assistive technology might not be able to fully access information in this file. For assistance, please send e-mail to: mmwrq@cdc.gov. Type 508 Accommodation and the title of the report in the subject line of e-mail. Notifiable Diseases/Deaths in Selected Cities Weekly InformationFigure_I Selected notifiable disease reports, comparison of 4-week totals ending May 11, 1996, with historical data -- United States Table_I Summary -- cases of selected notifiable diseases, United States, cumulative, week ending May 11, 1996 (19th Week) Table_II Cases of selected notifiable diseases, United States, weeks ending May 11, 1996 and May 13, 1995 (19th Week) Table_III Cases of selected notifiable diseases preventable by vaccination, United States, weeks ending May 11, 1996 and May 13, 1995 (19th Week) Table_IV Deaths in 121 U.S. cities, week ending May 11, 1996 (19th Week) +------------------------------------------------------------------- -------+ | | | Erratum: Vol. 45, No. 19 | | | | SOURCE: MMWR 45(21);448 DATE: May 31, 1996 | | | | On page 405, Figure_Ie, Selected notifiable disease reports, | | comparison of 4-week totals ending May 11, 1996, with historical data --| | United States, was incorrect. The graph below is correct for the week | | ending May 11, 1996. | |
|
+-------------------------------------------------------------------
-------+
TABLE I. Summary -- cases of specified notifiable diseases, United States,
cumulative, week ending May 11, 1996 (19th Week)
============================================================================
                                             Cum. 1996
------------------------------------------------------
Anthrax                                              -
Brucellosis                                         25
Cholera                                              1
Congenital rubella syndrome                          1
Cryptosporidiosis*                                 502
Diphtheria                                           1
Encephalitis:  California*                           -
               eastern equine*                       1
               St. Louis*                            -
               western equine*                       -
Hansen Disease                                      33
Hantavirus pulmonary syndrome*+                      5
HIV infection, pediatric*&                          92
Plague                                               -
Poliomyelitis, paralytic@                            -
Psittacosis                                          9
Rabies, human                                        -
Rocky Mountain spotted fever (RMSF)                 48
Streptococcal toxic-shock syndrome*                  9
Syphilis, congenital**                               -
Tetanus                                              5
Toxic-shock syndrome                                55
Trichinosis                                         10
Typhoid fever                                      102
------------------------------------------------------
 * Not notifiable in all states
 + Updated weekly from reports to the Division of Viral and Rickettsial
   Diseases, National Center for Infectious Diseases (NCID).
 & Updated monthly to the Division of HIV/AIDS Prevention, National
   Center for HIV, STD, and TB Prevention (NCHSTP) (proposed), last update
   April 30, 1996.
 @ No suspected cases of polio reported for 1996.
** Updated quarterly from reports to the Division of STD Prevention,
   NCHSTP. First quarter 1996 is not yet available.
-: no reported cases
============================================================================
Return to top. Table_II Note: To print large tables and graphs users may have to change their printer settings to landscape and use a small font size.
TABLE II. (page 1) Cases of selected notifiable diseases, United States, weeks ending
May 11, 1996, and May 13, 1995 (19th Week)
Escherichia
coli O157:H7
------------------- Hepatitis
AIDS* Chlamydia NETSS** PHLIS*** Gonorrhea C\NA,NB Legionellosis
----------------- --------- -------- -------- ------------------- ---------------- -----------------
Reporting Area Cum. Cum. Cum. Cum. Cum. Cum. Cum. Cum. Cum. Cum. Cum.
1996 1995 1996 1996 1996 1996 1995 1996 1995 1996 1995
------------------------------------------------------------------------------------------------------------------------------------------
UNITED STATES 21,920 25,977 81,890 295 121 97,047 136,487 1,274 1,457 239 440
NEW ENGLAND 878 1,402 3,438 27 16 2,791 1,919 45 41 13 4
Maine 15 23 - 3 - 18 30 - - 1 -
N.H. 25 43 224 1 1 41 36 1 5 - -
Vt. 8 13 - 5 5 23 17 19 4 1 -
Mass. 490 635 2,437 11 10 812 1,082 22 31 6 3
R.I. 61 89 777 2 - 202 198 3 1 5 1
Conn. 279 599 - 5 - 1,695 556 - - N N
MID. ATLANTIC 5,707 6,454 12,836 40 22 10,658 15,701 126 130 50 55
Upstate N.Y. 568 803 N 21 11 2,212 3,439 107 63 10 12
N.Y. City 3,281 3,079 4,121 - - 2,608 5,788 1 1 - 1
N.J. 1,143 1,607 1,902 12 5 2,157 1,310 - 56 7 13
Pa. 715 965 6,813 N 6 3,681 5,164 18 10 33 29
E.N. CENTRAL 1,874 2,207 13,776 65 26 14,898 28,995 161 123 73 150
Ohio 438 496 3,526 24 8 2,222 9,233 4 5 34 67
Ind. 309 195 3,812 14 6 2,685 3,009 6 - 18 36
Ill. 758 888 - 17 2 5,922 7,530 22 42 2 17
Mich. 257 492 4,101 10 10 2,911 6,837 129 76 16 14
Wis. 112 136 2,337 N - 1,158 2,386 - - 3 16
W.N. CENTRAL 548 604 8,811 42 22 5,309 7,479 90 25 15 27
Minn. 109 119 - 6 13 U 1,104 - 1 1 -
Iowa 44 32 1,343 7 4 392 565 71 3 3 8
Mo. 237 273 4,950 7 - 2,920 4,306 14 10 1 8
N. Dak. 4 1 2 1 1 1 11 - 1 - 2
S. Dak. 7 7 482 2 - 74 78 - 1 2 -
Nebr. 40 51 388 4 - 57 356 1 6 6 7
Kans. 107 121 1,646 15 4 866 1,059 4 3 2 2
S. ATLANTIC 5,803 7,218 19,065 18 3 36,425 40,057 60 98 34 71
Del. 114 133 - - - 532 726 1 - - -
Md. 658 1,118 2,253 N 1 4,825 4,597 - 2 6 14
D.C. 373 441 N - - 1,571 1,776 - - 1 3
Va. 317 545 4,440 N 1 3,564 4,194 5 3 9 4
W. Va. 31 35 - N - 160 223 6 20 1 3
N.C. 266 310 - 5 1 7,139 9,067 18 25 3 14
S.C. 283 324 - 1 - 4,163 4,236 13 4 3 13
Ga. 871 888 4,256 4 - 8,017 7,594 - 11 - 9
Fla. 2,890 3,424 8,116 5 - 6,454 7,644 17 33 11 11
E.S. CENTRAL 776 816 9,668 9 4 10,687 15,815 250 494 20 13
Ky. 120 81 2,407 - - 1,482 1,667 10 11 2 3
Tenn. 283 347 3,862 N 4 3,656 4,921 215 481 9 6
Ala. 244 231 3,201 2 - 4,938 6,194 1 2 - 3
Miss. 129 157 198 3 - U 3,033 24 - 9 1
W.S. CENTRAL 2,096 2,459 4,562 11 4 6,957 11,763 150 78 2 7
Ark. 97 108 - 5 2 1,017 1,756 1 1 - 1
La. 559 360 2,502 N 2 2,813 4,330 60 45 - 2
Okla. 55 100 2,060 1 - 1,299 10 55 20 2 3
Tex. 1,385 1,891 - 1 - 1,828 5,667 34 12 - 1
MOUNTAIN 648 820 5,343 35 15 2,507 3,435 246 172 10 51
Mont. 8 8 - 3 - 12 30 9 7 1 2
Idaho 10 22 600 11 4 34 49 65 22 - 1
Wyo. 2 5 268 - - 10 18 80 69 2 2
Colo. 181 268 - 12 5 626 1,101 23 30 4 23
N. Mex. 43 71 - 2 - 313 388 31 26 - 4
Ariz. 197 202 3,549 N 6 1,278 1,231 27 7 2 5
Utah 79 52 254 5 - 49 83 7 6 - 4
Nev. 128 192 672 2 - 185 535 4 5 1 10
PACIFIC 3,590 3,997 4,391 48 9 6,815 11,323 146 296 22 62
Wash. 313 416 3,653 10 5 850 927 26 73 1 5
Oreg. 189 158 - 12 - 150 165 3 20 - -
Calif. 3,025 3,282 - 22 - 5,497 9,682 48 193 21 52
Alaska 10 39 N - - 196 299 2 1 - -
Hawaii 53 102 430 N 4 122 250 67 9 - 5
Guam 3 - 90 N - 22 36 - - - -
P.R. 423 952 N N U 105 221 16 59 - -
V.I. 6 19 N N U - 14 - - - -
Amer. Samoa - - - N U - 8 - - - -
C.N.M.I. - - N N U 11 11 - - - -
------------------------------------------------------------------------------------------------------------------------------------------
N: Not notifiable U: Unavailable -: no reported cases C.N.M.I.: Commonwealth of North Mariana Islands
* Updated monthly to the Division of HIV/AIDS Prevention, National Center for HIV, STD, and TB Prevention (proposed), last update
April 30, 1996.
** National Electronic Telecommunications System for Surveillance.
*** Public Health Laboratory Information System.
=======================================================================================================================================================
TABLE II. (page 2) Cases of selected notifiable diseases, United States, weeks ending
May 11, 1996, and May 13, 1995 (19th Week)
Meningococcal Syphilis
Lyme Malaria Disease (Primary & Secondary) Tuberculosis Rabies, Animal
---------------- ---------------- ---------------- --------------------- ----------------- ----------------
Reporting Area Cum. Cum. Cum. Cum. Cum. Cum. Cum. Cum. Cum. Cum. Cum. Cum.
1996 1995 1996 1995 1996 1995 1996 1995 1996 1995 1996 1995
-----------------------------------------------------------------------------------------------------------------------------------------------------
UNITED STATES 1,149 1,781 333 360 1,392 1,327 3,917 6,035 5,470 5,959 1,788 2,451
NEW ENGLAND 49 152 11 15 52 60 61 80 135 131 202 650
Maine - 1 3 1 9 3 - 2 4 - - -
N.H. 1 10 1 1 1 12 1 1 3 4 23 78
Vt. - 2 1 - 3 6 - - - 1 60 86
Mass. 22 15 4 3 19 19 27 30 56 68 36 249
R.I. 21 34 2 2 - - - 1 18 16 21 92
Conn. 5 90 - 8 20 20 33 46 54 42 62 145
MID. ATLANTIC 956 1,380 81 89 111 152 161 361 924 1,294 258 552
Upstate N.Y. 468 729 19 19 35 45 20 34 107 130 135 205
N.Y. City 155 124 36 40 18 19 53 185 457 716 - -
N.J. 72 148 22 20 31 37 48 73 238 233 53 135
Pa. 261 379 4 10 27 51 40 69 122 215 70 212
E.N. CENTRAL 15 16 29 49 198 197 589 1,002 652 526 15 3
Ohio 13 5 6 2 76 55 222 343 105 102 3 1
Ind. 2 7 4 3 33 31 88 99 66 47 1 -
Ill. - 3 7 33 46 52 178 367 415 358 - 2
Mich. - 1 8 6 25 33 41 116 39 - 6 -
Wis. U U 4 5 18 26 60 77 27 19 5 -
W.N. CENTRAL 36 27 9 8 116 75 162 301 137 211 171 121
Minn. 1 - 3 3 10 14 27 17 24 40 11 6
Iowa 16 1 1 - 25 15 9 25 19 31 88 40
Mo. 2 12 4 4 53 27 119 243 55 83 10 12
N. Dak. - - - - 2 - - - 2 1 15 12
S. Dak. - - - - 3 3 - - 11 8 37 28
Nebr. - 1 - 1 10 6 3 7 7 8 2 -
Kans. 17 13 1 - 13 10 4 9 19 40 8 23
S. ATLANTIC 47 142 68 77 263 219 1,296 1,588 922 910 907 800
Del. 1 19 2 1 2 2 16 7 - 19 23 39
Md. 24 87 19 19 24 15 220 150 103 158 219 161
D.C. 1 1 3 8 4 2 68 46 49 38 2 5
Va. - 8 7 15 26 26 181 265 82 62 204 144
W. Va. 3 7 1 1 6 4 1 1 22 38 35 35
N.C. 10 10 7 6 33 41 398 427 123 99 232 156
S.C. 2 5 3 - 29 30 165 258 40 109 20 47
Ga. - 4 8 10 74 51 114 276 231 10 114 114
Fla. 6 1 18 17 65 48 133 158 272 377 58 99
E.S. CENTRAL 15 9 7 8 90 80 987 1,537 406 493 64 101
Ky. 2 1 - - 16 23 54 83 88 103 17 8
Tenn. 5 5 5 3 7 23 372 305 74 165 23 41
Ala. 1 1 1 5 35 18 208 221 158 149 24 51
Miss. 7 2 1 - 32 16 353 928 86 76 - 1
W.S. CENTRAL 7 27 10 5 170 146 471 812 591 692 21 45
Ark. 4 2 - 1 22 18 130 176 20 77 3 22
La. - - - 1 33 20 208 406 - 12 10 9
Okla. 2 13 - - 14 16 59 - 30 - 8 14
Tex. 1 12 10 3 101 92 74 230 541 603 - -
MOUNTAIN - 1 22 23 86 106 44 100 194 216 32 41
Mont. - - 1 2 1 2 - 3 7 3 5 17
Idaho - - - 1 10 5 1 - 3 6 - -
Wyo. - - 2 - 3 5 1 - 1 1 11 14
Colo. - - 12 12 14 22 15 59 25 5 1 -
N. Mex. - - 1 3 18 22 - 1 29 22 1 -
Ariz. - - 3 2 26 38 24 16 87 87 12 9
Utah - - 2 2 8 5 - 3 10 10 - -
Nev. - 1 1 1 6 7 3 18 32 82 2 1
PACIFIC 24 27 96 86 306 292 146 254 1,509 1,486 118 138
Wash. 1 1 6 8 43 49 2 6 83 91 - -
Oreg. 7 1 8 6 59 52 3 6 35 21 - -
Calif. 15 25 78 64 198 186 141 241 1,306 1,283 110 132
Alaska - - 1 1 4 3 - 1 24 29 8 6
Hawaii 1 - 3 7 2 2 - - 61 62 - -
Guam - - - - 1 2 2 1 28 5 - -
P.R. - - - - 2 12 48 123 20 53 10 27
V.I. - - - - - - - 1 - - - -
Amer. Samoa - - - - - - - - - 2 - -
C.N.M.I. - - - - - - 1 - - 13 - -
-----------------------------------------------------------------------------------------------------------------------------------------------------
N: Not notifiable U: Unavailable -: no reported cases
=======================================================================================================================================================
Return to top. Table_III Note: To print large tables and graphs users may have to change their printer settings to landscape and use a small font size.
TABLE III. (page 1) Cases of selected notifiable diseases preventable by vaccination, United
States, weeks ending May 11, 1996, and May 13, 1995 (19th Week)
Hepatitis (Viral), by type Measles (Rubeola)
H. influenzae, --------------------------------------- -------------------------------------
invasive A B Indigenous Imported**
---------------- ----------------- ----------------- --------------- ---------------
Reporting Area Cum. Cum. Cum. Cum. Cum. Cum. Cum. Cum.
1996* 1995 1996 1995 1996 1995 1996 1996 1996 1996
------------------------------------------------------------------------------------------------------------------------------
UNITED STATES 497 512 9,205 9,312 3,063 3,539 4 95 2 14
NEW ENGLAND 12 28 110 70 54 80 - 5 - 1
Maine 2 1 10 13 2 2 - - - -
N.H. 7 6 3 4 2 9 U - U -
Vt. - 1 2 3 2 1 - 1 - -
Mass. 3 7 60 23 17 26 - 3 - 1
R.I. - - 3 10 4 7 - - - -
Conn. - 13 32 17 27 35 - 1 - -
MID. ATLANTIC 73 54 596 574 473 480 1 4 - 4
Upstate N.Y. 21 14 151 117 117 117 - - - -
N.Y. City 10 14 258 279 225 165 1 4 - 3
N.J. 25 8 123 82 88 126 - - - -
Pa. 17 18 64 96 43 72 - - - 1
E.N. CENTRAL 71 93 798 1,251 330 421 - 3 1 3
Ohio 47 48 372 698 46 35 - 2 - -
Ind. 2 14 130 57 52 93 - - - -
Ill. 14 24 122 256 56 115 - - 1 1
Mich. 3 7 131 146 152 150 - - - 2
Wis. 5 - 43 94 24 28 - 1 - -
W.N. CENTRAL 20 29 684 524 183 236 - 4 - 1
Minn. 7 11 27 52 10 17 - 4 - 1
Iowa 6 2 168 26 68 15 - - - -
Mo. 5 13 311 378 82 171 - - - -
N. Dak. - - 17 10 - 2 - - - -
S. Dak. 1 - 34 11 - 1 - - - -
Nebr. 1 1 77 12 6 14 - - - -
Kans. - 2 50 35 17 16 - - - -
S. ATLANTIC 121 137 301 393 405 482 - 2 - -
Del. 1 - 5 6 1 3 - 1 - -
Md. 29 39 77 75 111 105 - 1 - -
D.C. 3 - 15 3 14 9 - - - -
Va. 4 13 54 71 52 34 - - - -
W. Va. 4 6 10 10 11 21 - - - -
N.C. 14 18 42 49 129 116 - - - -
S.C. 3 - 29 13 38 19 - - - -
Ga. 58 29 7 41 5 49 - - - -
Fla. 5 32 62 125 44 126 - - - -
E.S. CENTRAL 8 4 726 493 291 375 - - - -
Ky. 2 1 9 24 21 42 - - - -
Tenn. - - 519 394 189 287 - - - -
Ala. 5 3 84 44 20 46 - - - -
Miss. 1 - 114 31 61 - U - U -
W.S. CENTRAL 16 23 1,629 972 319 370 - - - 2
Ark. - 4 220 67 31 12 - - - -
La. - 1 47 32 40 64 - - - -
Okla. 15 15 673 198 46 44 - - - -
Tex. 1 3 689 675 202 250 - - - 2
MOUNTAIN 59 44 1,327 1,602 389 287 2 9 - 1
Mont. - - 50 24 4 9 - - - -
Idaho 1 2 118 166 50 36 - - - -
Wyo. 30 2 17 58 14 8 - - - -
Colo. 5 7 146 202 54 49 1 2 - 1
N. Mex. 7 6 193 300 142 118 - - - -
Ariz. 9 13 393 442 64 33 1 3 - -
Utah 5 5 344 360 47 23 - - - -
Nev. 2 9 66 50 14 11 - 4 - -
PACIFIC 117 100 3,034 3,433 619 808 1 68 1 2
Wash. 1 4 214 215 44 60 - 4 - -
Oreg. 17 12 437 708 31 43 1 1 - -
Calif. 97 82 2,322 2,432 540 694 - 1 1 1
Alaska - - 26 14 2 5 - 62 - -
Hawaii 2 2 35 64 2 6 - - - 1
Guam - - 2 2 - - U - U -
P.R. 1 3 33 19 137 119 - 1 - -
V.I. - - - - - 1 U - U -
Amer. Samoa - - - 5 - - U - U -
C.N.M.I. 10 2 1 14 5 6 U - U -
------------------------------------------------------------------------------------------------------------------------------
* Of 106 cases reported among children aged <5 years, serotype was reported for 26 and of those, 5 were type B.
** For imported measles, cases include only those resulting from importation from other countries.
N: Not notifiable U: Unavailable -: no reported cases
============================================================================================================================================
TABLE III. (page 2) Cases of selected notifiable diseases preventable by vaccination, United
States, weeks ending May 11, 1996, and May 13, 1995 (19th Week)
Measles (Rubeola), cont'd.
--------------------------
Total Mumps Pertussis Rubella
-------------------------- -------------------------- --------------------------- ---------------------------
Reporting Area Cum. Cum. Cum. Cum. Cum. Cum. Cum. Cum.
1996 1995 1996 1996 1995 1996 1996 1995 1996 1996 1995
------------------------------------------------------------------------------------------------------------------------------------------
UNITED STATES 109 191 14 230 327 59 968 977 2 66 32
NEW ENGLAND 6 4 - - 4 1 169 151 1 8 6
Maine - - - - 2 - 8 17 - - -
N.H. - - U - - U 17 9 U - 1
Vt. 1 - - - - - 7 3 1 2 -
Mass. 4 2 - - 1 1 134 115 - 4 2
R.I. - 2 - - - - - - - - -
Conn. 1 - - - 1 - 3 7 - 2 3
MID. ATLANTIC 8 3 1 27 49 6 87 87 - 4 3
Upstate N.Y. - - 1 8 14 6 48 50 - 3 -
N.Y. City 7 - - 4 7 - 14 14 - 1 2
N.J. - 3 - - 7 - - 6 - - 1
Pa. 1 - - 15 21 - 25 17 - - -
E.N. CENTRAL 6 9 5 62 57 1 129 107 - 3 -
Ohio 2 - 3 26 18 1 55 36 - - -
Ind. - - - 5 5 - 10 8 - - -
Ill. 1 - 2 13 16 - 47 23 - 1 -
Mich. 2 7 - 18 18 - 12 28 - 2 -
Wis. 1 2 - - - - 5 12 - - -
W.N. CENTRAL 5 1 1 3 22 1 41 65 - 1 -
Minn. 5 - 1 1 2 1 31 24 - - -
Iowa - - - - 4 - 2 1 - 1 -
Mo. - 1 - - 13 - 4 15 - - -
N. Dak. - - - 2 - - - 5 - - -
S. Dak. - - - - - - 1 7 - - -
Nebr. - - - - 3 - - 3 - - -
Kans. - - - - - - 3 10 - - -
S. ATLANTIC 2 1 1 24 54 5 110 96 1 12 5
Del. 1 - - - - - 7 5 - - -
Md. 1 - - 9 13 2 45 10 - - -
D.C. - - - - - - - 2 1 1 -
Va. - - - 3 13 - 5 7 - - -
W. Va. - - - - - - 2 - - - -
N.C. - - - - 16 - 25 49 - - -
S.C. - - - 3 5 - 5 10 - 1 -
Ga. - - 1 2 - 2 4 - - - -
Fla. - 1 - 7 7 1 17 13 - 10 5
E.S. CENTRAL - - - 10 10 1 36 26 - 2 -
Ky. - - - - - - 23 2 - - -
Tenn. - - - 1 - 1 8 4 - - -
Ala. - - - 4 4 - 1 20 - - -
Miss. - - U 5 6 U 4 - N N N
W.S. CENTRAL 2 2 2 11 21 - 19 48 - 1 2
Ark. - 2 - - 5 - 2 6 - - -
La. - - - 8 6 - 3 1 - 1 -
Okla. - - - - - - 4 7 - - -
Tex. 2 - 2 3 10 - 10 34 - - 2
MOUNTAIN 10 57 1 19 12 7 120 232 - 2 3
Mont. - - - - 1 1 4 3 - - -
Idaho - - - - 2 4 48 70 - - -
Wyo. - - - - - - - - - - -
Colo. 3 17 - 1 - 1 18 33 - - -
N. Mex. - 29 N N N 1 26 23 - - -
Ariz. 3 10 - 1 1 - 4 94 - 1 3
Utah - - 1 2 1 - 3 7 - - -
Nev. 4 1 - 15 7 - 17 2 - 1 -
PACIFIC 70 114 3 74 98 37 257 165 - 33 13
Wash. 4 15 - 8 6 15 87 30 - 1 -
Oreg. 1 1 N N N - 25 11 - - 1
Calif. 2 97 2 50 80 22 137 115 - 30 11
Alaska 62 - - 2 11 - - - - - -
Hawaii 1 1 1 14 1 - 8 9 - 2 1
Guam - - U 2 3 U - - U - -
P.R. 1 3 - 1 1 - - 7 - - -
V.I. - - U - 1 U - - U - -
Amer. Samoa - - U - - U - - U - -
C.N.M.I. - - U - - U - - U - -
------------------------------------------------------------------------------------------------------------------------------------------
N: Not notifiable U: Unavailable -: no reported cases
============================================================================================================================================
Return to top. Table_IV Note: To print large tables and graphs users may have to change their printer settings to landscape and use a small font size.
TABLE IV. Deaths in 121 U.S. cities* week ending
May 11, 1996 (19th Week)
===================================================================================================================================
All Causes, By Age (Years)
------------------------------------------------------------------------ P&I**
Reporting Area All Ages >=65 45-64 25-44 1-24 <1 Total
---------------------------------------------------------------------------------------------------------------
NEW ENGLAND 516 371 93 35 10 7 22
Boston, Mass. 154 96 37 11 4 6 7
Bridgeport, Conn. 35 26 5 4 - - 4
Cambridge, Mass. 14 8 5 1 - - -
Fall River, Mass. 28 26 2 - - - -
Hartford, Conn. 37 26 7 3 1 - -
Lowell, Mass. 15 12 1 2 - - 1
Lynn, Mass. 9 9 - - - - -
New Bedford, Mass. 23 20 1 2 - - -
New Haven, Conn. 32 22 7 2 - 1 4
Providence, R.I. 60 47 7 3 3 - 4
Somerville, Mass. 2 1 1 - - - -
Springfield, Mass. 39 27 8 4 - - -
Waterbury, Conn. 21 16 4 - 1 - 1
Worcester, Mass. 47 35 8 3 1 - 1
MID. ATLANTIC 2,545 1,683 522 259 39 42 131
Albany, N.Y. 44 32 5 2 2 3 1
Allentown, Pa. 17 12 5 - - - 1
Buffalo, N.Y. U U U U U U U
Camden, N.J. 35 23 6 2 1 3 1
Elizabeth, N.J. 22 14 4 4 - - -
Erie, Pa.*** 39 26 8 4 - 1 1
Jersey City, N.J. 53 33 10 6 1 3 1
New York City, N.Y. 1,269 803 287 142 20 17 43
Newark, N.J. 80 36 21 23 - - 6
Paterson, N.J. 21 16 2 2 1 - 3
Philadelphia, Pa. 500 335 94 53 10 8 32
Pittsburgh, Pa.*** 101 70 23 5 2 1 4
Reading, Pa. 14 13 - 1 - - 2
Rochester, N.Y. 137 108 19 7 1 2 15
Schenectady, N.Y. 33 27 6 - - - 4
Scranton, Pa.*** 29 23 6 - - - 2
Syracuse, N.Y. 98 71 20 3 1 3 8
Trenton, N.J. 35 25 4 5 - 1 6
Utica, N.Y. 18 16 2 - - - 1
Yonkers, N.Y. U U U U U U U
E.N. CENTRAL 2,022 1,370 382 175 50 44 131
Akron, Ohio 47 31 9 5 - 2 -
Canton, Ohio 37 32 3 2 - - 4
Chicago, Ill. 424 244 92 55 15 17 31
Cincinnati, Ohio 148 108 22 14 2 2 17
Cleveland, Ohio 146 96 27 16 5 2 -
Columbus, Ohio 148 94 26 20 4 4 11
Dayton, Ohio 149 107 34 6 1 1 6
Detroit, Mich. 197 120 48 23 4 2 5
Evansville, Ind. 40 31 7 1 - 1 2
Fort Wayne, Ind. 37 28 4 2 1 2 2
Gary, Ind. 9 8 - 1 - - -
Grand Rapids, Mich. 39 32 6 - - 1 5
Indianapolis, Ind. 206 139 46 10 6 5 14
Madison, Wis. U U U U U U U
Milwaukee, Wis. 108 85 15 7 - 1 11
Peoria, Ill. 40 25 10 1 2 2 4
Rockford, Ill. 50 34 10 3 2 1 6
South Bend, Ind. 38 31 3 1 2 1 2
Toledo, Ohio 99 77 12 5 5 - 7
Youngstown, Ohio 60 48 8 3 1 - 4
W.N. CENTRAL 760 549 119 49 17 15 42
Des Moines, Iowa 99 77 10 9 1 2 8
Duluth, Minn. 30 28 1 - 1 - 5
Kansas City, Kans. 25 13 8 4 - - -
Kansas City, Mo. 85 58 11 3 1 1 9
Lincoln, Nebr. 29 21 4 3 1 - -
Minneapolis, Minn. 170 125 27 9 5 4 11
Omaha, Nebr. 82 60 14 4 2 2 4
St. Louis, Mo. 107 73 24 7 - 3 -
St. Paul, Minn. 53 34 11 3 3 2 3
Wichita, Kans. 80 60 9 7 3 1 2
S. ATLANTIC 1,321 807 274 166 34 40 64
Atlanta, Ga. 197 114 39 25 5 14 5
Baltimore, Md. 230 128 57 37 7 1 18
Charlotte, N.C. 77 45 26 4 2 - 5
Jacksonville, Fla. 123 79 23 16 2 3 1
Miami, Fla. 115 64 26 20 2 3 1
Norfolk, Va. 58 34 8 8 4 4 3
Richmond, Va. 71 50 13 4 2 2 4
Savannah, Ga. 69 44 13 8 1 3 6
St. Petersburg, Fla. 44 33 7 2 2 - 1
Tampa, Fla. 189 135 32 14 3 5 16
Washington, D.C. 129 67 27 28 2 5 4
Wilmington, Del. 19 14 3 - 2 - -
E.S. CENTRAL 761 516 146 65 17 16 64
Birmingham, Ala. 113 76 20 7 5 4 4
Chattanooga, Tenn. 67 48 9 6 3 1 3
Knoxville, Tenn. 85 54 20 7 3 1 13
Lexington, Ky. 32 23 5 3 - 1 3
Memphis, Tenn. 186 125 37 18 1 5 25
Mobile, Ala. 76 53 17 3 2 1 4
Montgomery, Ala. 64 48 10 4 1 1 3
Nashville, Tenn. 138 89 28 17 2 2 9
W.S. CENTRAL 1,445 940 275 143 43 44 106
Austin, Tex. 56 36 10 9 1 - 4
Baton Rouge, La. 30 23 3 2 1 1 -
Corpus Christi, Tex. 70 54 11 3 1 1 8
Dallas, Tex. 175 102 37 21 6 9 4
El Paso, Tex. 92 66 14 8 1 3 4
Ft. Worth, Tex. 95 57 19 12 4 3 4
Houston, Tex. 381 233 80 39 14 15 34
Little Rock, Ark. 55 35 9 3 4 4 5
New Orleans, La. 112 61 28 18 3 2 -
San Antonio, Tex. 189 126 39 15 6 3 21
Shreveport, La. 64 45 14 5 - - 10
Tulsa, Okla. 126 102 11 8 2 3 12
MOUNTAIN 981 672 197 66 30 16 78
Albuquerque, N.M. 109 85 16 6 2 - 4
Colo. Springs, Colo. 47 32 8 5 1 1 5
Denver, Colo. 120 85 20 6 2 7 16
Las Vegas, Nev. 232 145 56 18 12 1 17
Ogden, Utah 30 26 3 1 - - 1
Phoenix, Ariz. 179 110 41 12 10 6 19
Pueblo, Colo. 22 15 5 2 - - 1
Salt Lake City, Utah 106 71 28 5 1 1 10
Tucson, Ariz. 136 103 20 11 2 - 5
PACIFIC 1,892 1,295 336 164 53 44 125
Berkeley, Calif. 13 9 3 1 - - 1
Fresno, Calif. 85 63 13 6 1 2 8
Glendale, Calif. 30 23 5 - 1 1 1
Honolulu, Hawaii 68 49 15 4 - - 4
Long Beach, Calif. 62 39 7 12 1 3 8
Los Angeles, Calif. 545 366 103 43 19 14 16
Pasadena, Calif. 30 23 - 4 2 1 2
Portland, Oreg. 127 86 27 10 4 - 6
Sacramento, Calif. 135 98 24 4 3 6 10
San Diego, Calif. 133 88 23 15 2 5 19
San Francisco, Calif. 152 95 30 20 6 1 11
San Jose, Calif. 192 128 41 16 2 5 18
Santa Cruz, Calif. 25 19 2 3 - 1 7
Seattle, Wash. 135 92 23 11 8 1 4
Spokane, Wash. 46 31 4 6 3 2 3
Tacoma, Wash. 114 86 16 9 1 2 7
TOTAL 12,243**** 8,203 2,344 1,122 293 268 763
---------------------------------------------------------------------------------------------------------------
* Mortality data in this table are voluntarily reported from 121 cities in the United States, most of which have populations
of 100,000 or more. A death is reported by the place of its occurrence and by the week that the death certificate was
filed. Fetal deaths are not included.
** Pneumonia and influenza.
*** Because of changes in reporting methods in these 3 Pennsylvania cities, these numbers are partial counts for the current
week. Complete counts will be available in 4 to 6 weeks.
**** Total includes unknown ages.
U: Unavailable -: no reported cases
===================================================================================================================================
Return to top. Figure_Ie  Return to top. Disclaimer All MMWR HTML versions of articles are electronic conversions from ASCII text into HTML. This conversion may have resulted in character translation or format errors in the HTML version. Users should not rely on this HTML document, but are referred to the electronic PDF version and/or the original MMWR paper copy for the official text, figures, and tables. An original paper copy of this issue can be obtained from the Superintendent of Documents, U.S. Government Printing Office (GPO), Washington, DC 20402-9371; telephone: (202) 512-1800. Contact GPO for current prices. **Questions or messages regarding errors in formatting should be addressed to mmwrq@cdc.gov.Page converted: 09/19/98 |
|||||||||
This page last reviewed 5/2/01
|