 |
|
|
|
|
|
|
| ||||||||||
|
|
|
|
|
|
|
||||
| ||||||||||
|
|
|
|
|
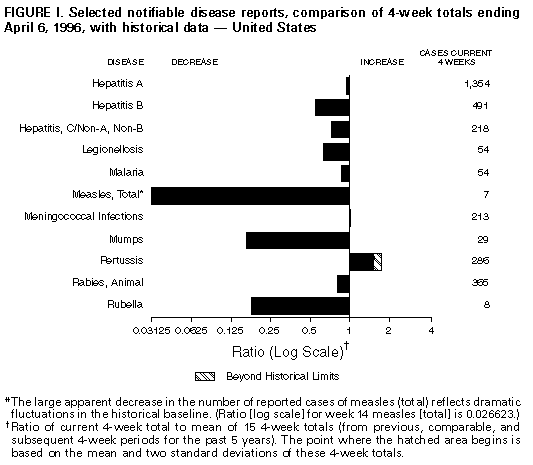
Persons using assistive technology might not be able to fully access information in this file. For assistance, please send e-mail to: mmwrq@cdc.gov. Type 508 Accommodation and the title of the report in the subject line of e-mail. Notifiable Diseases/Deaths in Selected Cities Weekly InformationFigure_I Selected notifiable disease reports, comparison of 4-week totals ending April 6, 1996, with historical data -- United States Table_I Summary -- cases of selected notifiable diseases, United States, cumulative, week ending April 6, 1996 (14th Week) Table_II Cases of selected notifiable diseases, United States, weeks ending April 6, 1996 and April 8, 1995 (14th Week) Table_III Cases of selected notifiable diseases preventable by vaccination, United States, weeks ending April 6, 1996 and April 8, 1995 (14th Week) Table_IV Deaths in 121 U.S. cities, week ending
April 6, 1996 (14th Week)
TABLE I. Summary -- cases of specified notifiable diseases, United States,
cumulative, week ending April 6, 1996 (14th Week)
============================================================================
                                             Cum. 1996
------------------------------------------------------
Anthrax                                              -
Brucellosis                                         15
Cholera                                              1
Congenital rubella syndrome                          -
Cryptosporidiosis*                                 346
Diphtheria                                           1
Encephalitis:  California*                           -
               eastern equine*                       1
               St. Louis*                            -
               western equine*                       -
Hansen Disease                                      26
Hantavirus pulmonary syndrome*+                      1
HIV infection, pediatric*&                          76
Plague                                               1
Poliomyelitis, paralytic@                            -
Psittacosis                                          5
Rabies, human                                        -
Rocky Mountain spotted fever (RMSF)                 22
Streptococcal toxic-shock syndrome*                  9
Syphilis, congenital**                               -
Tetanus                                              3
Toxic-shock syndrome                                37
Trichinosis                                          8
Typhoid fever                                       66
------------------------------------------------------
 * Not notifiable in all states
 + Updated weekly from reports to the Division of Viral and Rickettsial
   Diseases, National Center for Infectious Diseases (NCID).
 & Updated monthly to the Division of HIV/AIDS Prevention, National
   Center for Prevention Services (NCPS), last update March 26, 1996.
 @ No suspected cases of polio reported for 1996.
** Updated quarterly from reports to the Division of STD Prevention,
   NCPS. First quarter 1996 is not yet available.
-: no reported cases
============================================================================
Return to top. Table_II Note: To print large tables and graphs users may have to change their printer settings to landscape and use a small font size.
TABLE II. (page 1) Cases of selected notifiable diseases, United States, weeks ending
April 6, 1996, and April 8, 1995 (14th Week)
Escherichia
coli O157:H7
------------------- Hepatitis
AIDS* Chlamydia NETSS** PHLIS*** Gonorrhea C\NA,NB Legionellosis
----------------- --------- -------- -------- ------------------- ---------------- -----------------
Reporting Area Cum. Cum. Cum. Cum. Cum. Cum. Cum. Cum. Cum. Cum. Cum.
1996 1995 1996 1996 1996 1996 1995 1996 1995 1996 1995
------------------------------------------------------------------------------------------------------------------------------------------
UNITED STATES 16,791 19,920 59,471 194 69 72,301 105,537 859 1,106 185 304
NEW ENGLAND 657 829 2,574 22 5 1,835 1,467 24 27 6 4
Maine 10 23 - 3 - 11 18 - - 1 -
N.H. 23 37 191 1 1 36 30 1 2 - -
Vt. 7 6 - 4 4 17 12 15 2 - -
Mass. 392 447 1,797 10 - 614 847 5 22 4 3
R.I. 38 55 586 2 - 148 156 3 1 1 1
Conn. 187 261 - 2 - 1,009 404 - - N N
MID. ATLANTIC 4,440 4,783 8,788 30 15 6,684 12,247 79 102 42 41
Upstate N.Y. 538 618 N 14 10 1,351 2,768 72 44 7 9
N.Y. City 2,443 2,331 2,288 - - 1,785 4,245 1 1 - 1
N.J. 928 1,087 1,253 9 - 703 1,181 - 46 5 9
Pa. 531 747 5,247 N 5 2,845 4,053 6 11 30 22
E.N. CENTRAL 1,395 1,602 10,465 26 11 11,652 21,708 112 81 65 106
Ohio 300 404 2,594 16 8 1,410 6,880 4 4 31 42
Ind. 269 106 2,406 6 - 1,893 2,196 5 - 17 24
Ill. 518 732 - 2 1 4,694 5,565 8 30 2 13
Mich. 228 272 4,101 2 2 2,911 5,254 95 47 14 14
Wis. 80 88 1,364 N - 744 1,813 - - 1 13
W.N. CENTRAL 413 415 6,739 21 14 4,308 5,730 104 16 11 21
Minn. 84 92 - 3 9 U 834 - - - -
Iowa 31 20 927 5 2 295 423 70 3 2 8
Mo. 175 146 3,920 2 - 2,217 3,296 30 6 1 7
N. Dak. 1 1 2 1 1 1 9 - - - 1
S. Dak. 5 1 329 1 - 48 62 - 1 2 -
Nebr. 32 43 388 4 - 57 299 1 4 6 3
Kans. 85 112 1,173 5 2 691 807 3 2 - 2
S. ATLANTIC 4,590 5,798 13,958 13 2 27,522 31,315 46 67 21 45
Del. 93 114 - - - 379 567 1 - - -
Md. 444 962 1,576 N 1 3,563 3,876 - 2 4 11
D.C. 225 369 N - - 1,180 1,619 - - 1 3
Va. 224 369 3,067 N 1 2,565 3,150 3 1 6 2
W. Va. 24 21 - N - 99 192 4 19 1 3
N.C. 191 246 - 4 - 5,092 6,861 10 17 3 7
S.C. 229 270 - 1 - 2,923 3,235 11 1 1 6
Ga. 685 729 3,177 3 - 6,658 5,993 - 10 - 7
Fla. 2,475 2,718 6,138 2 - 5,063 5,822 17 17 5 6
E.S. CENTRAL 540 602 5,960 8 4 6,624 12,319 129 429 15 9
Ky. 86 63 1,940 - - 1,097 1,236 6 8 2 2
Tenn. 201 263 1,666 N 4 1,644 3,428 122 420 7 4
Ala. 157 157 2,270 2 - 3,578 5,101 1 1 - 2
Miss. 96 119 84 2 - 305 2,554 - - 6 1
W.S. CENTRAL 1,480 1,382 3,558 11 1 5,768 9,561 86 51 1 4
Ark. 70 64 - 5 - 749 1,265 1 - - -
La. 435 296 1,861 N 1 2,154 3,289 33 24 - 1
Okla. 54 83 1,697 1 - 1,037 1,087 35 21 1 3
Tex. 921 939 - 1 - 1,828 3,920 17 6 - -
MOUNTAIN 469 640 4,452 23 9 2,025 2,435 152 129 6 39
Mont. 4 8 - - - 8 27 8 7 - 2
Idaho 7 17 422 7 4 25 39 38 14 - 1
Wyo. 2 4 186 - - 10 13 47 53 - 1
Colo. 152 214 - 10 5 537 827 4 24 4 18
N. Mex. 25 69 - - - 254 307 26 18 - 3
Ariz. 136 135 2,984 N - 972 780 20 5 1 5
Utah 64 37 254 4 - 49 57 7 3 - 2
Nev. 79 156 606 2 - 170 385 2 5 1 7
PACIFIC 2,807 3,869 2,977 40 8 5,883 8,755 127 204 18 35
Wash. 220 356 2,537 5 4 653 709 23 58 1 -
Oreg. 153 129 - 12 - 126 133 3 11 - -
Calif. 2,394 3,277 - 18 - 4,888 7,485 58 126 17 30
Alaska 3 29 N 1 - 113 243 2 1 - -
Hawaii 37 78 361 N 4 103 185 41 8 - 5
Guam 3 - - N - - 23 - - - -
P.R. 420 852 N N U 60 163 20 49 - -
V.I. 3 15 N N U - 10 - - - -
Amer. Samoa - - - N U - 8 - - - -
C.N.M.I. - - N N U 11 5 - - - -
------------------------------------------------------------------------------------------------------------------------------------------
N: Not notifiable U: Unavailable -: no reported cases C.N.M.I.: Commonwealth of North Mariana Islands
* Updated monthly to the Division of HIV/AIDS Prevention, National Center for Prevention Services, last update March 26, 1996.
** National Electronic Telecommunications System for Surveillance.
*** Public Health Laboratory Information System.
=======================================================================================================================================================
TABLE II. (page 2) Cases of selected notifiable diseases, United States, weeks ending
April 6, 1996, and April 8, 1995 (14th Week)
Meningococcal Syphilis
Lyme Malaria Disease (Primary & Secondary) Tuberculosis Rabies, Animal
---------------- ---------------- ---------------- --------------------- ----------------- ----------------
Reporting Area Cum. Cum. Cum. Cum. Cum. Cum. Cum. Cum. Cum. Cum. Cum. Cum.
1996 1995 1996 1995 1996 1995 1996 1995 1996 1995 1996 1995
-----------------------------------------------------------------------------------------------------------------------------------------------------
UNITED STATES 901 1,185 233 256 1,012 975 2,901 4,424 3,436 4,016 1,136 1,764
NEW ENGLAND 44 79 8 13 25 55 49 62 91 79 132 496
Maine - 1 2 1 7 3 - 2 4 - - -
N.H. 1 8 1 1 1 11 1 1 3 3 18 62
Vt. - 1 1 - 1 5 - - - 1 37 67
Mass. 18 8 3 2 14 18 21 20 33 33 26 200
R.I. 20 9 1 2 - - - 1 16 10 16 64
Conn. 5 52 - 7 2 18 27 38 35 32 35 103
MID. ATLANTIC 756 916 57 60 80 102 110 277 541 808 171 445
Upstate N.Y. 324 466 13 10 22 34 11 26 77 79 81 187
N.Y. City 140 30 24 26 12 12 34 146 269 437 - -
N.J. 41 122 17 17 21 28 35 57 132 142 40 81
Pa. 251 298 3 7 25 28 30 48 63 150 50 177
E.N. CENTRAL 11 12 26 32 132 145 481 768 467 440 8 2
Ohio 9 5 5 1 51 39 188 271 71 74 2 1
Ind. 2 5 3 3 14 25 68 65 45 23 1 -
Ill. - 1 7 22 40 38 139 290 298 239 - 1
Mich. - 1 8 2 11 24 41 86 39 93 1 -
Wis. U U 3 4 16 19 45 56 14 11 4 -
W.N. CENTRAL 32 20 4 7 82 57 132 233 101 134 104 75
Minn. 1 - 1 3 5 10 27 15 17 31 7 5
Iowa 16 1 1 - 19 9 6 19 12 22 52 25
Mo. 2 8 1 3 33 22 96 185 48 51 9 10
N. Dak. - - - - 2 - - - 1 - 8 7
S. Dak. - - - - 3 2 - - 9 - 21 15
Nebr. - - - 1 9 6 3 5 4 8 2 -
Kans. 13 11 1 - 11 8 - 9 10 22 5 13
S. ATLANTIC 31 115 41 52 195 156 934 1,162 538 615 576 507
Del. 1 11 2 1 2 2 11 7 - 14 16 28
Md. 21 80 13 18 20 8 156 104 68 115 149 115
D.C. - - 2 3 3 1 43 41 24 23 2 2
Va. - 3 6 10 16 22 130 191 25 29 131 100
W. Va. 3 7 - - 4 3 1 1 19 28 21 23
N.C. 4 6 5 4 28 23 276 302 83 60 139 113
S.C. 1 4 2 - 25 24 129 186 40 77 10 40
Ga. - 4 7 6 60 42 83 207 156 2 73 77
Fla. 1 - 4 10 37 31 105 123 123 267 35 9
E.S. CENTRAL 6 7 3 3 69 61 703 999 310 335 36 74
Ky. - 1 - - 12 19 44 60 57 60 9 5
Tenn. - 4 2 1 3 15 219 225 72 108 13 34
Ala. - - 1 2 28 14 160 171 107 106 14 34
Miss. 6 2 - - 26 13 280 543 74 61 - 1
W.S. CENTRAL 3 19 6 5 109 105 349 656 206 428 15 39
Ark. 2 1 - 1 15 10 68 141 20 51 2 21
La. - - - 1 23 14 162 299 - - 8 9
Okla. 1 12 - - 9 11 45 52 27 39 5 9
Tex. - 6 6 3 62 70 74 164 159 338 - -
MOUNTAIN - 1 18 18 66 81 37 72 120 123 15 20
Mont. - - 1 1 1 2 - 3 - 3 - 9
Idaho - - - 1 7 4 1 - 2 5 - -
Wyo. - - 2 - 3 4 1 - 1 1 8 1
Colo. - - 10 9 9 21 13 42 21 5 - -
N. Mex. - - 1 3 12 19 - 1 11 22 1 -
Ariz. - - 1 2 21 25 19 11 50 76 4 9
Utah - - 2 1 7 2 - 2 10 10 - -
Nev. - 1 1 1 6 4 3 13 25 1 2 1
PACIFIC 18 16 70 66 254 213 106 195 1,062 1,054 79 106
Wash. - - 2 6 31 32 1 5 55 63 - -
Oreg. 5 1 5 4 42 37 3 4 30 16 - -
Calif. 12 15 60 49 174 142 102 185 917 910 71 102
Alaska - - - 1 5 - - 1 18 19 8 4
Hawaii 1 - 3 6 2 2 - - 42 46 - -
Guam - - - - - 1 - 1 - 4 - -
P.R. - - - - 3 10 44 93 20 23 13 18
V.I. - - - - - - - - - - - -
Amer. Samoa - - - - - - - - - 2 - -
C.N.M.I. - - - - - - 1 - - 10 - -
-----------------------------------------------------------------------------------------------------------------------------------------------------
N: Not notifiable U: Unavailable -: no reported cases
=======================================================================================================================================================
Return to top. Table_III Note: To print large tables and graphs users may have to change their printer settings to landscape and use a small font size.
TABLE III. (page 1) Cases of selected notifiable diseases preventable by vaccination, United
States, weeks ending April 6, 1996, and April 8, 1995 (14th Week)
Hepatitis (Viral), by type Measles (Rubeola)
H. influenzae, --------------------------------------- -------------------------------------
invasive A B Indigenous Imported**
---------------- ----------------- ----------------- --------------- ---------------
Reporting Area Cum. Cum. Cum. Cum. Cum. Cum. Cum. Cum.
1996* 1995 1996 1995 1996 1995 1996 1996 1996 1996
------------------------------------------------------------------------------------------------------------------------------
UNITED STATES 379 374 6,168 6,638 1,851 2,368 2 45 - 3
NEW ENGLAND 9 18 67 45 36 63 - 5 - 1
Maine - 1 8 6 2 2 - - - -
N.H. 7 1 3 3 1 6 - - - -
Vt. - 1 1 3 2 1 - 1 - -
Mass. 2 4 34 17 8 17 - 3 - 1
R.I. - - 3 8 4 7 - - - -
Conn. - 11 18 8 19 30 - 1 - -
MID. ATLANTIC 51 40 388 352 260 279 - 1 - 1
Upstate N.Y. 13 13 88 82 76 83 - - - -
N.Y. City 5 5 179 138 149 54 - 1 - 1
N.J. 17 8 75 66 4 96 U - U -
Pa. 16 14 46 66 31 46 - - - -
E.N. CENTRAL 56 70 559 961 222 326 - 2 - -
Ohio 34 37 277 541 34 28 - 2 - -
Ind. 2 10 100 48 38 74 - - - -
Ill. 14 19 65 199 27 88 - - - -
Mich. 2 4 90 106 117 114 - - - -
Wis. 4 - 27 67 6 22 - - - -
W.N. CENTRAL 16 16 509 305 139 169 2 2 - -
Minn. 4 4 18 21 3 9 2 2 - -
Iowa 6 1 137 15 57 14 - - - -
Mo. 5 8 233 221 57 123 - - - -
N. Dak. - - 5 4 - 1 - - - -
S. Dak. 1 - 27 3 - 1 - - - -
Nebr. - 1 51 16 5 11 - - - -
Kans. - 2 38 25 17 10 - - - -
S. ATLANTIC 94 93 228 275 313 330 - 2 - -
Del. 1 - 5 3 1 3 - 1 - -
Md. 20 33 53 57 81 68 - 1 - -
D.C. - - 6 2 5 8 - - - -
Va. 3 12 43 53 40 26 - - - -
W. Va. 1 2 6 7 8 19 - - - -
N.C. 13 11 26 24 103 93 - - - -
S.C. 3 - 24 8 28 9 - - - -
Ga. 52 21 2 37 3 33 - - - -
Fla. 1 14 63 84 44 71 - - - -
E.S. CENTRAL 7 4 270 368 68 258 - - - -
Ky. 2 1 6 20 20 28 - - - -
Tenn. - - 104 286 33 194 - - - -
Ala. 4 3 76 36 15 36 - - - -
Miss. 1 - 84 26 - - - - - -
W.S. CENTRAL 11 16 1,020 606 145 211 - 1 - -
Ark. - 3 165 37 15 4 - - - -
La. - 1 20 18 13 24 - - - -
Okla. 11 10 471 138 22 29 - - - -
Tex. - 2 364 413 95 154 - 1 - -
MOUNTAIN 40 38 856 1,160 228 169 - 3 - -
Mont. - - 22 19 2 6 - - - -
Idaho 1 2 104 135 26 21 - - - -
Wyo. 18 2 6 46 6 3 - - - -
Colo. 4 6 22 149 8 34 - - - -
N. Mex. 7 5 143 240 102 63 - - - -
Ariz. 5 10 248 290 36 22 - - - -
Utah 3 4 260 244 37 13 - - - -
Nev. 2 9 51 37 11 7 - 3 - -
PACIFIC 95 79 2,271 2,566 440 563 - 29 - 1
Wash. 1 4 139 151 25 45 - 4 - -
Oreg. 12 9 328 517 22 29 - - - -
Calif. 80 64 1,753 1,837 389 481 - 1 - -
Alaska - - 27 15 2 3 - 24 - -
Hawaii 2 2 24 46 2 5 - - - 1
Guam - - - 1 - - U - U -
P.R. - 3 25 11 90 84 - - - -
V.I. - - - - - 1 U - U -
Amer. Samoa - - - 5 - - U - U -
C.N.M.I. 10 - 1 10 5 1 U - U -
------------------------------------------------------------------------------------------------------------------------------
* Of 83 cases reported among children aged <5 years, serotype was reported for 22 and of those, 5 were type B.
** For imported measles, cases include only those resulting from importation from other countries.
N: Not notifiable U: Unavailable -: no reported cases
============================================================================================================================================
TABLE III. (page 2) Cases of selected notifiable diseases preventable by vaccination, United
States, weeks ending April 6, 1996, and April 8, 1995 (14th Week)
Measles (Rubeola), cont'd.
--------------------------
Total Mumps Pertussis Rubella
-------------------------- -------------------------- --------------------------- ---------------------------
Reporting Area Cum. Cum. Cum. Cum. Cum. Cum. Cum. Cum.
1996 1995 1996 1996 1995 1996 1996 1995 1996 1996 1995
------------------------------------------------------------------------------------------------------------------------------------------
UNITED STATES 48 168 6 155 222 68 639 711 2 41 19
NEW ENGLAND 6 3 - - 3 3 118 112 - 3 2
Maine - - - - 2 2 7 11 - - -
N.H. - - - - - 1 15 5 - - 1
Vt. 1 - - - - - 6 2 - - -
Mass. 4 1 - - - - 87 88 - 1 1
R.I. - 2 - - - - - - - - -
Conn. 1 - - - 1 - 3 6 - 2 -
MID. ATLANTIC 2 2 1 20 33 4 67 63 - 3 2
Upstate N.Y. - - - 6 9 - 38 34 - 2 -
N.Y. City 2 - - 4 4 1 11 12 - 1 1
N.J. - 2 U - 6 U - 6 U - 1
Pa. - - 1 10 14 3 18 11 - - -
E.N. CENTRAL 2 - 1 42 30 5 114 73 - 1 -
Ohio 2 - 1 17 15 5 51 31 - - -
Ind. - - - 5 5 - 9 7 - - -
Ill. - - - 9 - - 43 - - 1 -
Mich. - - - 11 10 - 9 26 - - -
Wis. - - - - - - 2 9 - - -
W.N. CENTRAL 2 1 - 2 14 22 25 34 1 1 -
Minn. 2 - - - 2 21 22 5 - - -
Iowa - - - - 3 - 2 1 1 1 -
Mo. - 1 - - 7 - - 7 - - -
N. Dak. - - - 2 - - - 5 - - -
S. Dak. - - - - - 1 1 6 - - -
Nebr. - - - - 2 - - 3 - - -
Kans. - - - - - - - 7 - - -
S. ATLANTIC 2 - - 14 39 8 53 71 - - 1
Del. 1 - - - - - 7 4 - - -
Md. 1 - - 7 8 3 25 - - - -
D.C. - - - - - - - 1 - - -
Va. - - - 3 9 3 3 7 - - -
W. Va. - - - - - 2 2 - - - -
N.C. - - - - 16 - - 49 - - -
S.C. - - - 3 3 - 3 8 - - -
Ga. - - - 1 - - 2 - - - -
Fla. - - - - 3 - 11 2 - - 1
E.S. CENTRAL - - - 6 6 - 10 20 - 2 -
Ky. - - - - - - 5 1 - - -
Tenn. - - - - - - 1 4 - - -
Ala. - - - 3 2 - 1 15 - - -
Miss. - - - 3 4 - 3 - N N N
W.S. CENTRAL 1 2 1 7 12 2 8 29 - - 1
Ark. - 2 - - 3 - 2 3 - - -
La. - - 1 7 2 - 2 1 - - -
Okla. - - - - - - 1 1 - - -
Tex. 1 - - - 7 2 3 24 - - 1
MOUNTAIN 3 56 1 13 10 10 94 191 1 1 2
Mont. - - - - - - 3 3 - - -
Idaho - - - - 2 1 40 57 - - -
Wyo. - - - - - - - - - - -
Colo. - 17 - - - 6 14 32 - - -
N. Mex. - 28 N N N - 18 14 - - -
Ariz. - 10 - 1 1 2 4 82 1 1 2
Utah - - 1 1 1 1 2 2 - - -
Nev. 3 1 - 11 6 - 13 1 - - -
PACIFIC 30 104 2 51 75 14 150 118 - 30 11
Wash. 4 14 - 5 4 1 35 20 - 1 -
Oreg. - 1 N N N 4 20 5 - - 1
Calif. 1 88 1 37 62 6 87 90 - 27 9
Alaska 24 - - 1 8 - - - - - -
Hawaii 1 1 1 8 1 3 8 3 - 2 1
Guam - - U - 2 U - - U - -
P.R. - 3 - 1 1 - - 4 - - -
V.I. - - U - 1 U - - U - -
Amer. Samoa - - U - - U - - U - -
C.N.M.I. - - U - - U - - U - -
------------------------------------------------------------------------------------------------------------------------------------------
N: Not notifiable U: Unavailable -: no reported cases
============================================================================================================================================
Return to top. Table_IV Note: To print large tables and graphs users may have to change their printer settings to landscape and use a small font size.
TABLE IV. Deaths in 121 U.S. cities* week ending
April 6, 1996 (14th Week)
===================================================================================================================================
All Causes, By Age (Years)
------------------------------------------------------------------------ P&I**
Reporting Area All Ages >=65 45-64 25-44 1-24 <1 Total
---------------------------------------------------------------------------------------------------------------
NEW ENGLAND 569 404 107 34 11 11 34
Boston, Mass. 151 104 32 9 2 3 7
Bridgeport, Conn. 49 40 3 4 1 1 -
Cambridge, Mass. 24 18 6 - - - 1
Fall River, Mass. 27 23 4 - - - -
Hartford, Conn. 42 24 13 3 2 - 3
Lowell, Mass. 17 12 4 - 1 - 2
Lynn, Mass. 11 9 1 1 - - -
New Bedford, Mass. 30 25 2 2 - 1 2
New Haven, Conn. 39 17 8 7 5 2 -
Providence, R.I. 41 30 7 2 - 1 7
Somerville, Mass. 7 5 2 - - - -
Springfield, Mass. 30 24 4 1 - 1 -
Waterbury, Conn. 38 32 5 1 - - 5
Worcester, Mass. 63 41 16 4 - 2 7
MID. ATLANTIC 2,515 1,722 460 234 44 55 129
Albany, N.Y. 47 30 11 5 - 1 5
Allentown, Pa. 25 19 6 - - - -
Buffalo, N.Y. 95 78 10 5 - 2 2
Camden, N.J. 29 19 6 1 1 2 2
Elizabeth, N.J. 18 11 5 1 1 - 1
Erie, Pa.*** 61 51 6 4 - - 7
Jersey City, N.J. 37 24 8 5 - - -
New York City, N.Y. 1,294 846 251 146 20 31 64
Newark, N.J. 59 21 15 14 4 5 6
Paterson, N.J. 15 8 5 2 - - 1
Philadelphia, Pa. 400 286 70 26 11 7 22
Pittsburgh, Pa.*** 45 29 10 5 - 1 -
Reading, Pa. 12 9 1 - 2 - 2
Rochester, N.Y. 139 112 18 5 3 1 6
Schenectady, N.Y. 31 23 7 1 - - 1
Scranton, Pa.*** 31 29 1 - - 1 1
Syracuse, N.Y. 100 72 18 6 1 3 7
Trenton, N.J. 32 23 4 3 1 1 2
Utica, N.Y. 16 10 3 3 - - -
Yonkers, N.Y. 29 22 5 2 - - -
E.N. CENTRAL 2,193 1,493 411 174 54 61 140
Akron, Ohio 57 46 7 1 1 2 -
Canton, Ohio 50 42 6 2 - - 4
Chicago, Ill. 456 277 93 56 12 18 37
Cincinnati, Ohio 107 68 28 5 3 3 9
Cleveland, Ohio 118 83 19 10 1 5 2
Columbus, Ohio 211 157 32 9 9 4 22
Dayton, Ohio 125 100 16 4 2 3 13
Detroit, Mich. 263 159 59 26 10 9 10
Evansville, Ind. 38 34 4 - - - 4
Fort Wayne, Ind. 42 32 6 1 3 - 5
Gary, Ind. 9 7 1 1 - - -
Grand Rapids, Mich. 71 52 12 3 - 4 7
Indianapolis, Ind. 192 123 43 16 6 4 6
Madison, Wis. 61 43 11 7 - - 3
Milwaukee, Wis. 121 63 34 17 3 4 7
Peoria, Ill. 38 32 5 - - 1 1
Rockford, Ill. 42 26 8 7 - 1 4
South Bend, Ind. 32 28 3 - 1 - 1
Toledo, Ohio 100 78 12 5 3 2 4
Youngstown, Ohio 60 43 12 4 - 1 1
W.N. CENTRAL 1,273 906 219 87 31 20 79
Des Moines, Iowa 149 111 26 11 - 1 15
Duluth, Minn. 27 19 5 3 - - -
Kansas City, Kans. 146 107 24 11 4 - 5
Kansas City, Mo. 137 74 30 8 13 2 8
Lincoln, Nebr. 35 26 6 1 - 2 2
Minneapolis, Minn. 200 149 33 12 1 5 15
Omaha, Nebr. 74 51 14 6 - 3 5
St. Louis, Mo. 125 89 21 9 4 2 10
St. Paul, Minn. 71 58 8 2 1 2 9
Wichita, Kans. 309 222 52 24 8 3 10
S. ATLANTIC 1,086 695 239 91 31 30 45
Atlanta, Ga. 178 101 41 19 8 9 3
Baltimore, Md. 129 84 28 13 1 3 15
Charlotte, N.C. 87 64 18 2 2 1 4
Jacksonville, Fla. 134 89 31 6 4 4 3
Miami, Fla. 108 60 28 11 7 2 2
Norfolk, Va. 46 36 5 4 - 1 1
Richmond, Va. 64 37 19 5 3 - -
Savannah, Ga. 49 32 11 4 1 1 5
St. Petersburg, Fla. 58 45 7 4 1 1 1
Tampa, Fla. 217 141 41 23 4 8 11
Washington, D.C. U U U U U U U
Wilmington, Del. 16 6 10 - - - -
E.S. CENTRAL 534 334 121 52 13 12 42
Birmingham, Ala. 115 68 22 16 2 5 3
Chattanooga, Tenn. 41 27 12 1 1 - 2
Knoxville, Tenn. 90 63 19 6 1 1 14
Lexington, Ky. 53 36 15 2 - - 8
Memphis, Tenn. U U U U U U U
Mobile, Ala. 89 55 16 11 4 3 3
Montgomery, Ala. 43 27 14 1 - 1 3
Nashville, Tenn. 103 58 23 15 5 2 9
W.S. CENTRAL 1,556 998 324 160 41 33 105
Austin, Tex. 79 46 17 12 3 1 12
Baton Rouge, La. 24 17 4 1 1 1 -
Corpus Christi, Tex. 49 37 10 1 1 - 4
Dallas, Tex. 210 125 54 19 5 7 6
El Paso, Tex. 115 77 24 7 3 4 12
Ft. Worth, Tex. 138 75 32 24 4 3 9
Houston, Tex. 394 242 79 55 15 3 32
Little Rock, Ark. 75 42 22 8 1 2 4
New Orleans, La. 57 38 5 10 2 2 -
San Antonio, Tex. 243 164 48 17 4 10 10
Shreveport, La. 71 54 13 2 2 - 5
Tulsa, Okla. 101 81 16 4 - - 11
MOUNTAIN 690 469 115 64 29 13 54
Albuquerque, N.M. 73 50 10 9 4 - 2
Colo. Springs, Colo. 52 40 6 2 2 2 5
Denver, Colo. 96 66 19 7 4 - 10
Las Vegas, Nev. U U U U U U U
Ogden, Utah 15 10 4 - 1 - 2
Phoenix, Ariz. 197 128 31 22 11 5 17
Pueblo, Colo. 28 21 4 2 1 - 1
Salt Lake City, Utah 92 53 20 9 4 6 5
Tucson, Ariz. 137 101 21 13 2 - 12
PACIFIC 1,263 873 228 110 22 30 118
Berkeley, Calif. 13 9 3 1 - - 1
Fresno, Calif. 71 50 7 10 1 3 8
Glendale, Calif. U U U U U U U
Honolulu, Hawaii 93 73 14 4 - 2 3
Long Beach, Calif. 77 44 20 9 1 3 14
Los Angeles, Calif. U U U U U U U
Pasadena, Calif. 27 20 4 1 1 1 2
Portland, Oreg. 126 93 16 11 3 3 9
Sacramento, Calif. 145 103 25 13 2 2 12
San Diego, Calif. 131 97 17 12 4 1 20
San Francisco, Calif. 129 79 26 19 3 2 18
San Jose, Calif. 172 110 38 14 2 8 12
Santa Cruz, Calif. 30 23 4 3 - - 3
Seattle, Wash. 121 85 27 5 2 2 3
Spokane, Wash. 65 44 15 3 2 1 6
Tacoma, Wash. 63 43 12 5 1 2 7
TOTAL 11,679**** 7,894 2,224 1,006 276 265 746
---------------------------------------------------------------------------------------------------------------
* Mortality data in this table are voluntarily reported from 121 cities in the United States, most of which have populations
of 100,000 or more. A death is reported by the place of its occurrence and by the week that the death certificate was
filed. Fetal deaths are not included.
** Pneumonia and influenza.
*** Because of changes in reporting methods in these 3 Pennsylvania cities, these numbers are partial counts for the current
week. Complete counts will be available in 4 to 6 weeks.
**** Total includes unknown ages.
U: Unavailable -: no reported cases
===================================================================================================================================
Return to top. Disclaimer All MMWR HTML versions of articles are electronic conversions from ASCII text into HTML. This conversion may have resulted in character translation or format errors in the HTML version. Users should not rely on this HTML document, but are referred to the electronic PDF version and/or the original MMWR paper copy for the official text, figures, and tables. An original paper copy of this issue can be obtained from the Superintendent of Documents, U.S. Government Printing Office (GPO), Washington, DC 20402-9371; telephone: (202) 512-1800. Contact GPO for current prices. **Questions or messages regarding errors in formatting should be addressed to mmwrq@cdc.gov.Page converted: 09/19/98 |
|||||||||
This page last reviewed 5/2/01
|