 |
|
|
|
|
|
|
| ||||||||||
|
|
|
|
|
|
|
||||
| ||||||||||
|
|
|
|
|
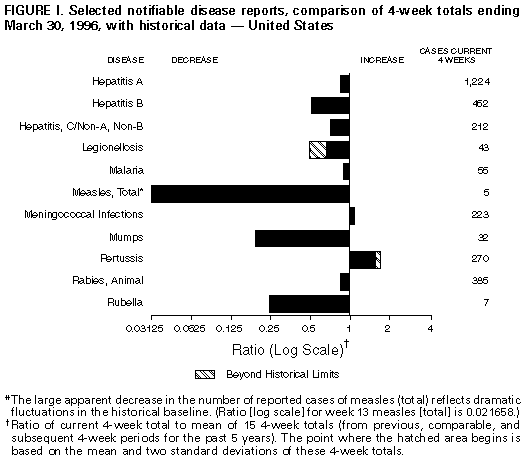
Persons using assistive technology might not be able to fully access information in this file. For assistance, please send e-mail to: mmwrq@cdc.gov. Type 508 Accommodation and the title of the report in the subject line of e-mail. Notifiable Diseases/Deaths in Selected Cities Weekly InformationFigure_I Selected notifiable disease reports, comparison of 4-week totals ending March 30, 1996, with historical data -- United States Table_I Summary -- cases of selected notifiable diseases, United States, cumulative, week ending March 30, 1996 (13 Week) Table_II Cases of selected notifiable diseases, United States, weeks ending March 30, 1996 and April 1, 1995 (13 Week) Table_III Cases of selected notifiable diseases preventable by vaccination, United States, weeks ending March 30, 1996 and April 1, 1995 (13 Week) Table_IV Deaths in 121 U.S. cities, week ending
March 30, 1996 (13 Week)
TABLE I. Summary -- cases of specified notifiable diseases, United States,
cumulative, week ending March 30, 1996 (13 Week)
============================================================================
                                             Cum. 1996
------------------------------------------------------
Anthrax                                              -
Brucellosis                                         12
Cholera                                              1
Congenital rubella syndrome                          -
Cryptosporidiosis*                                 305
Diphtheria                                           1
Encephalitis:  California*                           -
               eastern equine*                       1
               St. Louis*                            -
               western equine*                       -
Hansen Disease                                      26
Hantavirus pulmonary syndrome*+                      1
HIV infection, pediatric*&                          76
Plague                                               -
Poliomyelitis, paralytic@                            -
Psittacosis                                          5
Rabies, human                                        -
Rocky Mountain spotted fever (RMSF)                 21
Streptococcal toxic shock syndrome*                 10
Syphilis, congenital**                               -
Tetanus                                              3
Toxic-shock syndrome                                30
Trichinosis                                          6
Typhoid fever                                       57
------------------------------------------------------
 * Not notifiable in all states
 + Updated weekly from reports to the Division of Viral and Rickettsial
   Diseases, National Center for Infectious Diseases (NCID).
 & Updated monthly to the Division of HIV/AIDS Prevention, National
   Center for Prevention Services (NCPS), last update March 26, 1996.
 @ No suspected cases of polio reported for 1996.
** Updated quarterly from reports to the Division of STD Prevention,
   NCPS. First quarter 1996 is not yet available.
-: no reported cases
============================================================================
Return to top. Table_II Note: To print large tables and graphs users may have to change their printer settings to landscape and use a small font size.
TABLE II. (page 1) Cases of selected notifiable diseases, United States, weeks ending
March 30, 1996, and April 1, 1995 (13 Week)
Escherichia
coli O157:H7
------------------- Hepatitis
AIDS* Chlamydia NETSS** PHLIS*** Gonorrhea C\NA,NB Legionellosis
----------------- --------- -------- -------- ------------------- ---------------- -----------------
Reporting Area Cum. Cum. Cum. Cum. Cum. Cum. Cum. Cum. Cum. Cum. Cum.
1996 1995 1996 1996 1996 1996 1995 1996 1995 1996 1995
------------------------------------------------------------------------------------------------------------------------------------------
UNITED STATES 16,791 19,472 54,118 164 60 68,687 98,160 796 1,045 164 275
NEW ENGLAND 657 829 2,395 22 3 1,794 1,352 20 27 5 3
Maine 10 23 - 3 - 10 16 - - 1 -
N.H. 23 37 165 1 1 36 28 1 2 - -
Vt. 7 6 - 4 2 17 10 12 2 - -
Mass. 392 447 1,674 10 - 582 796 5 22 3 2
R.I. 38 55 556 2 - 140 151 2 1 1 1
Conn. 187 261 - 2 - 1,009 351 - - N N
MID. ATLANTIC 4,440 4,487 8,576 29 15 6,514 11,744 73 93 36 39
Upstate N.Y. 538 521 N 13 10 1,299 2,768 66 38 7 8
N.Y. City 2,443 2,320 2,288 - - 1,785 3,932 1 1 - 1
N.J. 928 1,079 1,253 9 - 703 1,181 - 43 5 9
Pa. 531 567 5,035 N 5 2,727 3,863 6 11 24 21
E.N. CENTRAL 1,395 1,599 9,814 23 10 10,902 20,365 106 76 57 98
Ohio 300 403 2,366 16 7 1,280 6,532 4 3 28 39
Ind. 269 106 2,224 4 - 1,788 2,051 4 - 12 21
Ill. 518 731 - 2 1 4,307 5,128 9 29 2 13
Mich. 228 271 4,095 1 2 2,909 4,950 89 44 14 14
Wis. 80 88 1,129 N - 618 1,704 - - 1 11
W.N. CENTRAL 413 413 6,046 17 13 3,950 5,414 93 15 11 16
Minn. 84 91 - 2 8 998 786 - - - -
Iowa 31 20 638 4 2 214 399 63 2 2 7
Mo. 175 146 3,639 1 - 2,005 3,155 27 6 1 6
N. Dak. 1 1 2 1 1 1 9 - - - 1
S. Dak. 5 1 309 - - 47 48 - 1 2 -
Nebr. 32 43 388 4 - 57 274 - 4 6 1
Kans. 85 111 1,070 5 2 628 743 3 2 - 1
S. ATLANTIC 4,590 5,675 13,202 13 1 26,290 28,213 40 62 21 43
Del. 93 114 - - - 357 526 1 - - -
Md. 444 961 1,384 N - 3,312 3,596 - 2 4 10
D.C. 225 369 N - - 1,124 1,531 - - 1 3
Va. 224 369 3,011 N 1 2,293 2,898 3 - 6 2
W. Va. 24 21 - N - 99 181 4 16 1 3
N.C. 191 246 - 4 - 4,944 6,270 8 17 3 7
S.C. 229 267 - 1 - 2,808 2,978 7 1 1 6
Ga. 685 614 3,139 3 - 6,642 4,809 - 10 - 6
Fla. 2,475 2,714 5,668 2 - 4,711 5,424 17 16 5 6
E.S. CENTRAL 540 601 5,531 7 1 6,288 11,332 125 423 14 9
Ky. 86 63 1,817 - - 1,027 1,236 5 8 2 2
Tenn. 201 262 1,458 N 1 1,492 3,093 119 414 6 4
Ala. 157 157 2,203 2 - 3,433 4,821 1 1 - 2
Miss. 96 119 53 2 - 336 2,182 - - 6 1
W.S. CENTRAL 1,480 1,382 1,587 7 1 5,519 8,915 85 51 1 3
Ark. 70 64 - 5 - 681 1,188 1 - - -
La. 435 296 - N 1 2,042 3,015 33 24 - 1
Okla. 54 83 1,587 1 - 968 880 34 21 1 2
Tex. 921 939 - 1 - 1,828 3,832 17 6 - -
MOUNTAIN 469 640 4,155 20 8 1,710 2,353 144 118 5 32
Mont. 4 8 - - - 6 24 8 6 - 2
Idaho 7 17 390 7 4 20 37 38 14 - 1
Wyo. 2 4 173 - - 10 13 41 46 - -
Colo. 152 214 - 8 4 505 802 4 23 4 16
N. Mex. 25 69 - - - 216 297 25 18 - 3
Ariz. 136 135 2,733 N - 734 776 20 5 - 2
Utah 64 37 254 3 - 49 54 6 3 - 2
Nev. 79 156 605 2 - 170 350 2 3 1 6
PACIFIC 2,807 3,846 2,812 26 8 5,720 8,472 110 180 14 32
Wash. 220 355 2,450 4 4 628 675 23 44 1 -
Oreg. 153 122 - 10 - 108 129 3 11 - -
Calif. 2,394 3,262 - 8 - 4,799 7,275 45 116 13 28
Alaska 3 29 N - - 99 227 2 1 - -
Hawaii 37 78 342 N 4 86 166 37 8 - 4
Guam 3 - - N - - 23 - - - -
P.R. 420 638 N N U 60 138 18 43 - -
V.I. 3 14 N N U - 9 - - - -
Amer. Samoa - - - N U - 8 - - - -
C.N.M.I. - - N N U 11 5 - - - -
------------------------------------------------------------------------------------------------------------------------------------------
N: Not notifiable U: Unavailable -: no reported cases C.N.M.I.: Commonwealth of North Mariana Islands
* Updated monthly to the Division of HIV/AIDS Prevention, National Center for Prevention Services, last update March 26, 1996.
** National Electronic Telecommunications System for Surveillance.
*** Public Health Laboratory Information System.
=======================================================================================================================================================
TABLE II. (page 2) Cases of selected notifiable diseases, United States, weeks ending
March 30, 1996, and April 1, 1995 (13 Week)
Meningococcal Syphilis
Lyme Malaria Disease (Primary & Secondary) Tuberculosis Rabies, Animal
---------------- ---------------- ---------------- --------------------- ----------------- ----------------
Reporting Area Cum. Cum. Cum. Cum. Cum. Cum. Cum. Cum. Cum. Cum. Cum. Cum.
1996 1995 1996 1995 1996 1995 1996 1995 1996 1995 1996 1995
-----------------------------------------------------------------------------------------------------------------------------------------------------
UNITED STATES 844 1,091 217 240 926 903 2,708 4,135 3,035 3,588 1,021 1,616
NEW ENGLAND 39 58 7 12 22 54 49 60 86 74 116 469
Maine - 1 2 1 7 3 - 2 4 - - -
N.H. - 7 1 1 1 11 1 1 3 1 17 62
Vt. - 1 1 - 1 5 - - - 1 34 59
Mass. 15 7 3 1 13 17 21 19 30 33 25 190
R.I. 19 1 - 2 - - - 1 14 10 11 61
Conn. 5 41 - 7 - 18 27 37 35 29 29 97
MID. ATLANTIC 718 859 57 55 77 93 99 259 490 720 153 403
Upstate N.Y. 289 422 13 9 20 30 4 26 69 74 66 182
N.Y. City 140 29 24 25 12 11 34 141 226 371 - -
N.J. 41 119 17 14 21 27 35 50 132 128 40 74
Pa. 248 289 3 7 24 25 26 42 63 147 47 147
E.N. CENTRAL 8 11 22 31 120 133 453 711 442 415 8 2
Ohio 6 5 4 1 49 34 180 237 71 66 2 1
Ind. 2 5 3 3 11 23 68 60 41 22 1 -
Ill. - 1 4 21 39 37 124 273 280 223 - 1
Mich. - - 8 2 10 22 40 86 39 93 1 -
Wis. U U 3 4 11 17 41 55 11 11 4 -
W.N. CENTRAL 28 19 3 7 76 51 121 218 83 119 86 69
Minn. 1 - - 3 4 10 26 14 15 27 4 5
Iowa 16 1 1 - 17 9 4 17 11 15 49 22
Mo. 2 8 1 3 30 18 88 174 33 51 8 10
N. Dak. - - - - 2 - - - 1 - 8 6
S. Dak. - - - - 3 - - - 9 - 10 15
Nebr. - - - 1 9 6 3 5 4 5 2 -
Kans. 9 10 1 - 11 8 - 8 10 21 5 11
S. ATLANTIC 28 106 38 51 177 147 852 1,087 363 598 523 464
Del. 1 11 2 1 2 2 11 6 - 12 16 26
Md. 18 73 13 17 18 6 146 97 63 105 137 104
D.C. - - 2 3 2 1 36 38 17 21 2 2
Va. - 2 6 10 14 20 120 174 25 29 125 88
W. Va. 3 6 - - 4 3 1 1 18 27 20 22
N.C. 4 6 5 4 25 23 258 278 71 45 119 110
S.C. 1 4 1 - 24 23 107 186 40 68 10 34
Ga. - 4 5 6 54 40 75 188 6 115 66 69
Fla. 1 - 4 10 34 29 98 119 123 176 28 9
E.S. CENTRAL 6 7 2 3 66 52 671 932 286 307 32 58
Ky. - 1 - - 11 18 42 60 50 55 7 5
Tenn. - 4 1 1 3 11 203 201 72 92 11 29
Ala. - - 1 2 26 14 155 162 95 99 14 23
Miss. 6 2 - - 26 9 271 509 69 61 - 1
W.S. CENTRAL 1 14 6 5 99 101 326 609 200 286 14 37
Ark. 1 - - 1 13 9 58 121 20 40 2 20
La. - - - 1 19 14 152 278 - - 8 9
Okla. - 11 - - 7 10 42 52 21 37 4 8
Tex. - 3 6 3 60 68 74 158 159 209 - -
MOUNTAIN - 1 17 16 59 76 32 68 97 116 14 17
Mont. - - 1 1 1 2 - 3 - 3 - 9
Idaho - - - 1 7 4 1 - 2 5 - -
Wyo. - - 2 - 3 2 1 - - 1 8 -
Colo. - - 9 8 8 20 13 40 15 5 - -
N. Mex. - - 1 3 12 18 - 1 7 22 1 -
Ariz. - - 1 2 19 25 14 11 50 69 3 7
Utah - - 2 1 3 2 - 2 10 10 - -
Nev. - 1 1 - 6 3 3 11 13 1 2 1
PACIFIC 16 16 65 60 230 196 105 191 988 953 75 97
Wash. - - 1 6 31 29 1 5 50 54 - -
Oreg. 4 1 5 4 40 36 2 4 28 10 - -
Calif. 11 15 56 46 154 129 102 182 855 829 68 94
Alaska - - - 1 3 - - - 15 19 7 3
Hawaii 1 - 3 3 2 2 - - 40 41 - -
Guam - - - - - 1 - 1 - 4 - -
P.R. - - - - 3 10 47 83 20 23 12 18
V.I. - - - - - - - - - - - -
Amer. Samoa - - - - - - - - - 2 - -
C.N.M.I. - - - - - - 1 - - 10 - -
-----------------------------------------------------------------------------------------------------------------------------------------------------
N: Not notifiable U: Unavailable -: no reported cases
=======================================================================================================================================================
Return to top. Table_III Note: To print large tables and graphs users may have to change their printer settings to landscape and use a small font size.
TABLE III. (page 1) Cases of selected notifiable diseases preventable by vaccination, United
States, weeks ending March 30, 1996, and April 1, 1995 (13 Week)
Hepatitis (Viral), by type Measles (Rubeola)
H. influenzae, --------------------------------------- -------------------------------------
invasive A B Indigenous Imported**
---------------- ----------------- ----------------- --------------- ---------------
Reporting Area Cum. Cum. Cum. Cum. Cum. Cum. Cum. Cum.
1996* 1995 1996 1995 1996 1995 1996 1996 1996 1996
------------------------------------------------------------------------------------------------------------------------------
UNITED STATES 340 356 5,602 6,138 1,665 2,176 2 42 - 3
NEW ENGLAND 8 16 61 43 29 63 - 5 - 1
Maine - 1 8 6 2 2 - - - -
N.H. 6 1 3 3 - 6 - - - -
Vt. - 1 - 3 2 1 - 1 - -
Mass. 2 4 30 16 4 17 - 3 - 1
R.I. - - 2 7 2 7 - - - -
Conn. - 9 18 8 19 30 - 1 - -
MID. ATLANTIC 48 38 381 327 250 248 - 1 - 1
Upstate N.Y. 12 13 85 72 70 73 - - - -
N.Y. City 5 5 179 126 149 47 - 1 - 1
N.J. 17 8 75 65 4 89 - - - -
Pa. 14 12 42 64 27 39 - - - -
E.N. CENTRAL 53 70 512 907 203 299 2 2 - -
Ohio 32 37 248 517 28 25 2 2 - -
Ind. 2 10 96 43 35 61 - - - -
Ill. 14 19 62 188 25 83 - - - -
Mich. 2 4 81 98 109 108 - - - -
Wis. 3 - 25 61 6 22 - - - -
W.N. CENTRAL 11 16 453 272 128 158 - - - -
Minn. 1 4 12 21 2 9 - - - -
Iowa 5 1 128 11 57 14 - - - -
Mo. 5 8 196 195 51 114 - - - -
N. Dak. - - 5 4 - 1 - - - -
S. Dak. - - 26 3 - 1 - - - -
Nebr. - 1 49 16 3 9 - - - -
Kans. - 2 37 22 15 10 - - - -
S. ATLANTIC 75 90 209 260 299 293 - 2 - -
Del. 1 - 5 3 1 3 - 1 - -
Md. 19 32 49 53 75 60 - 1 - -
D.C. - - 6 2 5 8 - - - -
Va. 3 12 36 50 38 23 - - - -
W. Va. - 2 5 7 8 19 - - - -
N.C. 10 11 26 24 103 87 - - - -
S.C. 3 - 19 7 24 9 - - - -
Ga. 38 19 - 36 1 28 - - - -
Fla. 1 14 63 78 44 56 - - - -
E.S. CENTRAL 7 3 237 361 49 243 - - - -
Ky. 2 1 6 19 19 27 - - - -
Tenn. - - 77 281 16 185 - - - -
Ala. 4 2 73 35 14 31 - - - -
Miss. 1 - 81 26 - - - - - -
W.S. CENTRAL 10 13 912 557 126 193 - - - -
Ark. - 1 151 21 14 2 - - - -
La. - 1 16 16 12 17 - - - -
Okla. 10 9 442 129 22 25 - - - -
Tex. - 2 303 391 78 149 - - - -
MOUNTAIN 38 34 764 1,046 199 153 - 3 - -
Mont. - - 18 19 2 6 - - - -
Idaho 1 2 101 132 26 20 - - - -
Wyo. 16 1 6 38 5 3 - - - -
Colo. 4 4 22 141 8 26 - - - -
N. Mex. 7 5 133 222 91 57 - - - -
Ariz. 5 10 218 215 31 21 - - - -
Utah 3 4 221 243 26 13 - - - -
Nev. 2 8 45 36 10 7 - 3 - -
PACIFIC 90 76 2,073 2,365 382 526 - 29 - 1
Wash. 1 4 128 125 21 39 - 4 - -
Oreg. 11 9 308 459 20 27 - - - -
Calif. 76 61 1,593 1,721 337 453 - 1 - -
Alaska - - 22 14 2 2 - 24 - -
Hawaii 2 2 22 46 2 5 - - - 1
Guam - - - 1 - - U - U -
P.R. - 3 28 11 85 79 - - - -
V.I. - - - - - 1 U - U -
Amer. Samoa - - - 5 - - U - U -
C.N.M.I. 10 - 1 8 5 - U - U -
------------------------------------------------------------------------------------------------------------------------------
* Of 77 cases reported among children aged <5 years, serotype was reported for 20 and of those, 4 was type B.
** For imported measles, cases include only those resulting from importation from other countries.
N: Not notifiable U: Unavailable -: no reported cases
============================================================================================================================================
TABLE III. (page 2) Cases of selected notifiable diseases preventable by vaccination, United
States, weeks ending March 30, 1996, and April 1, 1995 (13 Week)
Measles (Rubeola), cont'd.
--------------------------
Total Mumps Pertussis Rubella
-------------------------- -------------------------- --------------------------- ---------------------------
Reporting Area Cum. Cum. Cum. Cum. Cum. Cum. Cum. Cum.
1996 1995 1996 1996 1995 1996 1996 1995 1996 1996 1995
------------------------------------------------------------------------------------------------------------------------------------------
UNITED STATES 45 160 8 145 201 112 557 669 1 39 16
NEW ENGLAND 6 3 - - 3 30 105 109 1 3 2
Maine - - - - 2 2 5 10 - - -
N.H. - - - - - 1 14 5 - - 1
Vt. 1 - - - - - 6 2 - - -
Mass. 4 1 - - - 27 77 88 1 1 1
R.I. - 2 - - - - - - - - -
Conn. 1 - - - 1 - 3 4 - 2 -
MID. ATLANTIC 2 2 - 18 29 6 62 59 - 3 2
Upstate N.Y. - - - 6 9 6 38 32 - 2 -
N.Y. City 2 - - 3 2 - 9 12 - 1 1
N.J. - 2 - - 4 - - 6 - - 1
Pa. - - - 9 14 - 15 9 - - -
E.N. CENTRAL 2 - 2 40 30 27 109 69 - 1 -
Ohio 2 - - 16 15 - 46 30 - - -
Ind. - - - 5 5 2 9 7 - - -
Ill. - - 1 8 - 25 43 - - 1 -
Mich. - - 1 11 10 - 9 26 - - -
Wis. - - - - - - 2 6 - - -
W.N. CENTRAL - 1 - 2 14 - 3 32 - - -
Minn. - - - - 2 - 1 5 - - -
Iowa - - - - 3 - 2 1 - - -
Mo. - 1 - - 7 - - 7 - - -
N. Dak. - - - 2 - - - 5 - - -
S. Dak. - - - - - - - 4 - - -
Nebr. - - - - 2 - - 3 - - -
Kans. - - - - - - - 7 - - -
S. ATLANTIC 2 - - 14 36 - 44 68 - - 1
Del. 1 - - - - - 7 4 - - -
Md. 1 - - 7 7 - 22 - - - -
D.C. - - - - - - - 1 - - -
Va. - - - 3 8 - - 7 - - -
W. Va. - - - - - - - - - - -
N.C. - - - - 15 - - 47 - - -
S.C. - - - 3 3 - 3 7 - - -
Ga. - - - 1 - - 2 - - - -
Fla. - - - - 3 - 10 2 - - 1
E.S. CENTRAL - - 1 6 6 - 10 18 - 2 -
Ky. - - - - - - 5 1 - - -
Tenn. - - - - - - 1 4 - - -
Ala. - - - 3 2 - 1 13 - - -
Miss. - - 1 3 4 - 3 - N N N
W.S. CENTRAL - 2 1 6 12 - 4 22 - - 1
Ark. - 2 - - 3 - 2 2 - - -
La. - - 1 6 2 - 2 1 - - -
Okla. - - - - - - - 1 - - -
Tex. - - - - 7 - - 18 - - 1
MOUNTAIN 3 55 - 11 10 26 84 179 - - 2
Mont. - - - - - - 3 3 - - -
Idaho - - - - 2 23 39 50 - - -
Wyo. - - - - - - - - - - -
Colo. - 17 - - - - 8 32 - - -
N. Mex. - 27 N N N 3 18 9 - - -
Ariz. - 10 - 1 1 - 2 82 - - 2
Utah - - - - 1 - 1 2 - - -
Nev. 3 1 - 10 6 - 13 1 - - -
PACIFIC 30 97 4 48 61 23 136 113 - 30 8
Wash. 4 14 1 5 3 8 34 19 - 1 -
Oreg. - 1 N N N - 16 5 - - 1
Calif. 1 81 3 35 51 15 81 87 - 27 7
Alaska 24 - - 1 6 - - - - - -
Hawaii 1 1 - 7 1 - 5 2 - 2 -
Guam - - U - 2 U - - U - -
P.R. - 3 - 1 1 - - 4 - - -
V.I. - - U - 1 U - - U - -
Amer. Samoa - - U - - U - - U - -
C.N.M.I. - - U - - U - - U - -
------------------------------------------------------------------------------------------------------------------------------------------
N: Not notifiable U: Unavailable -: no reported cases
============================================================================================================================================
Return to top. Table_IV Note: To print large tables and graphs users may have to change their printer settings to landscape and use a small font size.
TABLE IV. Deaths in 121 U.S. cities* week ending
March 30, 1996 (13 Week)
===================================================================================================================================
All Causes, By Age (Years)
------------------------------------------------------------------------ P&I**
Reporting Area All Ages >=65 45-64 25-44 1-24 <1 Total
---------------------------------------------------------------------------------------------------------------
NEW ENGLAND 582 413 105 44 10 9 37
Boston, Mass. 157 106 30 15 - 5 8
Bridgeport, Conn. 32 26 6 - - - 1
Cambridge, Mass. 21 16 3 2 - - 2
Fall River, Mass. 27 23 4 - - - -
Hartford, Conn. 43 27 9 4 2 1 -
Lowell, Mass. 23 15 6 1 - 1 2
Lynn, Mass. 15 9 3 3 - - -
New Bedford, Mass. 22 17 2 3 - - -
New Haven, Conn. 63 38 16 6 3 - 8
Providence, R.I. 52 41 7 3 - 1 8
Somerville, Mass. 4 1 1 2 - - -
Springfield, Mass. 36 26 6 2 2 - 2
Waterbury, Conn. 31 26 3 1 1 - 1
Worcester, Mass. 56 42 9 2 2 1 5
MID. ATLANTIC 2,399 1,631 442 255 41 29 121
Albany, N.Y. 44 30 7 6 - 1 3
Allentown, Pa. 23 21 1 1 - - -
Buffalo, N.Y. U U U U U U U
Camden, N.J. 26 17 2 4 2 1 -
Elizabeth, N.J. 25 16 6 2 1 - -
Erie, Pa.*** 51 40 9 2 - - 4
Jersey City, N.J. 49 30 11 6 1 1 1
New York City, N.Y. 1,251 840 235 147 14 14 56
Newark, N.J. 93 43 21 21 4 4 7
Paterson, N.J. 20 12 5 3 - - 3
Philadelphia, Pa. 400 275 78 37 9 1 18
Pittsburgh, Pa.*** 54 37 10 5 2 - 6
Reading, Pa. 21 17 1 3 - - 4
Rochester, N.Y. 145 107 23 5 5 5 6
Schenectady, N.Y. 17 13 1 3 - - 2
Scranton, Pa.*** 30 23 5 2 - - 2
Syracuse, N.Y. 69 48 15 3 2 1 5
Trenton, N.J. 29 19 5 3 1 1 3
Utica, N.Y. 23 17 5 1 - - 1
Yonkers, N.Y. 29 26 2 1 - - -
E.N. CENTRAL 2,074 1,404 383 181 63 43 140
Akron, Ohio 55 35 13 4 3 - -
Canton, Ohio 47 39 5 2 1 - 6
Chicago, Ill. 435 275 83 58 14 5 35
Cincinnati, Ohio 76 56 8 9 3 - 7
Cleveland, Ohio 154 94 42 9 4 5 3
Columbus, Ohio 125 86 17 13 - 9 12
Dayton, Ohio 109 81 17 6 3 2 11
Detroit, Mich. 231 135 51 26 10 9 8
Evansville, Ind. 58 42 13 3 - - 4
Fort Wayne, Ind. 70 51 10 6 1 2 4
Gary, Ind. 15 7 4 2 1 1 -
Grand Rapids, Mich. 68 52 9 4 2 1 10
Indianapolis, Ind. 157 104 30 11 7 5 8
Madison, Wis. 57 37 14 4 2 - 6
Milwaukee, Wis. 104 75 14 12 2 1 5
Peoria, Ill. 40 30 6 2 1 1 5
Rockford, Ill. 58 44 8 4 2 - 7
South Bend, Ind. 50 40 8 - 2 - 2
Toledo, Ohio 100 69 20 6 4 1 5
Youngstown, Ohio 65 52 11 - 1 1 2
W.N. CENTRAL 1,318 944 223 90 27 26 70
Des Moines, Iowa 104 77 22 3 1 - 16
Duluth, Minn. 42 35 4 2 - 1 2
Kansas City, Kans. 180 122 40 14 2 2 6
Kansas City, Mo. 134 75 25 17 4 6 5
Lincoln, Nebr. 38 28 6 3 1 - 2
Minneapolis, Minn. 192 138 33 17 1 3 10
Omaha, Nebr. 95 74 18 2 - 1 13
St. Louis, Mo. 122 89 15 10 5 3 -
St. Paul, Minn. 53 43 5 3 - 2 3
Wichita, Kans. 358 263 55 19 13 8 13
S. ATLANTIC 1,390 921 237 154 50 28 72
Atlanta, Ga. 162 97 32 24 7 2 12
Baltimore, Md. 186 128 29 20 5 4 18
Charlotte, N.C. 93 59 16 8 8 2 6
Jacksonville, Fla. 133 91 19 15 6 2 5
Miami, Fla. 108 69 20 11 5 3 1
Norfolk, Va. 44 26 7 5 3 3 2
Richmond, Va. 90 58 16 9 2 5 5
Savannah, Ga. 47 31 8 4 2 2 2
St. Petersburg, Fla. 74 57 10 2 4 1 4
Tampa, Fla. 218 149 33 33 2 1 11
Washington, D.C. 216 137 47 23 6 3 6
Wilmington, Del. 19 19 - - - - -
E.S. CENTRAL 864 561 186 79 26 10 63
Birmingham, Ala. 112 78 18 9 3 2 7
Chattanooga, Tenn. 66 41 17 5 2 1 -
Knoxville, Tenn. 103 66 26 3 6 2 14
Lexington, Ky. 73 48 14 7 3 1 8
Memphis, Tenn. 211 139 45 25 1 1 17
Mobile, Ala. 94 65 16 8 5 - 8
Montgomery, Ala. 50 32 8 8 1 1 1
Nashville, Tenn. 155 92 42 14 5 2 8
W.S. CENTRAL 1,583 1,022 311 154 52 43 124
Austin, Tex. 74 47 15 9 3 - 8
Baton Rouge, La. 57 36 10 7 3 1 3
Corpus Christi, Tex. 65 44 13 5 1 2 8
Dallas, Tex. 227 145 41 27 6 8 6
El Paso, Tex. 82 48 11 16 4 2 8
Ft. Worth, Tex. 81 48 18 6 6 3 5
Houston, Tex. 397 250 86 41 13 7 44
Little Rock, Ark. 51 34 9 3 4 1 3
New Orleans, La. 96 61 19 7 5 4 -
San Antonio, Tex. 311 213 63 20 3 12 22
Shreveport, La. 52 39 8 4 1 - 8
Tulsa, Okla. 90 57 18 9 3 3 9
MOUNTAIN 941 629 162 95 37 15 74
Albuquerque, N.M. 93 57 15 11 7 3 4
Colo. Springs, Colo. 52 42 5 2 2 1 3
Denver, Colo. 100 60 22 11 4 1 10
Las Vegas, Nev. 183 109 47 21 2 3 17
Ogden, Utah 24 22 1 1 - - 2
Phoenix, Ariz. 199 131 32 22 8 6 14
Pueblo, Colo. 26 20 2 3 1 - 1
Salt Lake City, Utah 112 80 16 9 7 - 11
Tucson, Ariz. 152 108 22 15 6 1 12
PACIFIC 2,103 1,447 353 190 63 49 179
Berkeley, Calif. 20 12 6 2 - - -
Fresno, Calif. 101 71 16 9 3 2 10
Glendale, Calif. U U U U U U U
Honolulu, Hawaii 80 57 12 6 4 1 12
Long Beach, Calif. 73 52 13 4 2 2 12
Los Angeles, Calif. 711 477 119 64 27 24 36
Pasadena, Calif. 28 21 5 1 1 - 6
Portland, Oreg. 129 86 26 11 4 2 7
Sacramento, Calif. 183 130 26 19 5 3 13
San Diego, Calif. 141 113 15 10 2 1 21
San Francisco, Calif. 143 89 29 23 1 1 22
San Jose, Calif. 181 123 41 8 7 2 21
Santa Cruz, Calif. 37 27 7 3 - - 5
Seattle, Wash. 130 88 16 19 2 5 3
Spokane, Wash. 56 41 5 5 2 3 5
Tacoma, Wash. 90 60 17 6 3 3 6
TOTAL 13,254**** 8,972 2,402 1,242 369 252 880
---------------------------------------------------------------------------------------------------------------
* Mortality data in this table are voluntarily reported from 121 cities in the United States, most of which have populations
of 100,000 or more. A death is reported by the place of its occurrence and by the week that the death certificate was
filed. Fetal deaths are not included.
** Pneumonia and influenza.
*** Because of changes in reporting methods in these 3 Pennsylvania cities, these numbers are partial counts for the current
week. Complete counts will be available in 4 to 6 weeks.
**** Total includes unknown ages.
U: Unavailable -: no reported cases
===================================================================================================================================
Return to top. Disclaimer All MMWR HTML versions of articles are electronic conversions from ASCII text into HTML. This conversion may have resulted in character translation or format errors in the HTML version. Users should not rely on this HTML document, but are referred to the electronic PDF version and/or the original MMWR paper copy for the official text, figures, and tables. An original paper copy of this issue can be obtained from the Superintendent of Documents, U.S. Government Printing Office (GPO), Washington, DC 20402-9371; telephone: (202) 512-1800. Contact GPO for current prices. **Questions or messages regarding errors in formatting should be addressed to mmwrq@cdc.gov.Page converted: 09/19/98 |
|||||||||
This page last reviewed 5/2/01
|