 |
|
|
|
|
|
|
| ||||||||||
|
|
|
|
|
|
|
||||
| ||||||||||
|
|
|
|
|
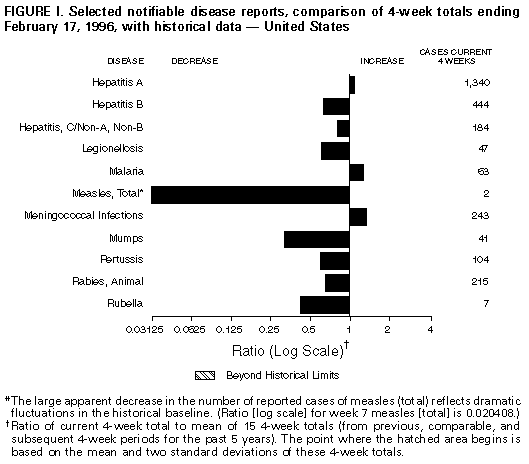
Persons using assistive technology might not be able to fully access information in this file. For assistance, please send e-mail to: mmwrq@cdc.gov. Type 508 Accommodation and the title of the report in the subject line of e-mail. Notifiable Diseases/Deaths in Selected Cities Weekly InformationFigure_I Selected notifiable disease reports, comparison of 4-week totals ending February 17, 1996, with historical data -- United States Table_I Summary -- cases of selected notifiable diseases, United States, cumulative, week ending February 17, 1996 (7th Week) Table_II Cases of selected notifiable diseases, United States, weeks ending February 17, 1996 and February 18, 1995 (7th Week) Table_III Cases of selected notifiable diseases preventable by vaccination, United States, weeks ending February 17, 1996 and February 18, 1995 (7th Week) Table_IV Deaths in 121 U.S. cities, week ending
February 17, 1996 (7th Week)
TABLE I. Summary -- cases of specified notifiable diseases, United States,
cumulative, week ending February 17, 1996 (7th Week)
============================================================================
                                             Cum. 1996
------------------------------------------------------
Anthrax                                              -
Brucellosis                                          5
Cholera                                              -
Congenital rubella syndrome                          -
Cryptosporidiosis*                                 113
Diphtheria                                           1
Encephalitis:  California*                           -
               eastern equine*                       -
               St. Louis*                            -
               western equine*                       -
Hansen Disease                                       8
Hantavirus pulmonary syndrome*+                      -
HIV infection, pediatric*&                          26
Plague                                               -
Poliomyelitis, paralytic@                            -
Psittacosis                                          2
Rabies, human                                        -
Rocky Mountain spotted fever (RMSF)                  6
Streptococcal toxic-shock syndrome*                  -
Syphilis, congenital**                               -
Tetanus                                              2
Toxic-shock syndrome                                16
Trichinosis                                          4
Typhoid fever                                       17
------------------------------------------------------
 * Not notifiable in all states
 + Updated weekly from reports to the Division of Viral and Rickettsial
   Diseases, National Center for Infectious Diseases (NCID).
 & Updated monthly to the Division of HIV/AIDS Prevention, National
   Center for Prevention Services (NCPS), last update January 30, 1996.
 @ No suspected cases of polio reported for 1996.
** Updated quarterly from reports to the Division of STD Prevention,
   NCPS. First quarter 1996 is not yet available.
-: no reported cases
============================================================================
Return to top. Table_II Note: To print large tables and graphs users may have to change their printer settings to landscape and use a small font size.
TABLE II. (page 1) Cases of selected notifiable diseases, United States, weeks ending
February 17, 1996, and February 18, 1995 (7th Week)
Escherichia
coli O157:H7
------------------- Hepatitis
AIDS* Chlamydia NETSS** PHLIS*** Gonorrhea C\NA,NB Legionellosis
----------------- --------- -------- -------- ------------------- ---------------- -----------------
Reporting Area Cum. Cum. Cum. Cum. Cum. Cum. Cum. Cum. Cum. Cum. Cum.
1996 1995 1996 1996 1996 1996 1995 1996 1995 1996 1995
------------------------------------------------------------------------------------------------------------------------------------------
UNITED STATES 4,357 9,266 19,371 81 16 33,302 52,063 338 507 82 136
NEW ENGLAND 208 502 1,325 15 2 918 836 7 6 4 -
Maine 7 15 - 2 - 3 8 - - 1 -
N.H. 3 5 84 1 1 15 16 - - - -
Vt. - - - 3 1 14 3 3 - - -
Mass. 135 285 930 6 - 336 462 4 6 2 -
R.I. 9 28 311 2 - 73 70 - - 1 -
Conn. 54 169 - 1 - 477 277 - - N N
MID. ATLANTIC 1,235 2,496 885 8 3 862 5,825 24 41 11 15
Upstate N.Y. 158 248 N 7 3 - 980 22 18 4 3
N.Y. City 696 1,567 - - - - 1,923 1 1 - 1
N.J. 244 445 885 - - 406 529 - 17 - 4
Pa. 137 236 - N - 456 2,393 1 5 7 7
E.N. CENTRAL 419 692 5,594 11 1 6,583 11,632 43 43 32 55
Ohio 143 124 749 8 - 493 4,044 2 1 15 22
Ind. 50 78 1,304 2 - 1,132 1,057 - - 6 7
Ill. 156 245 - 1 - 2,518 2,588 1 16 - 11
Mich. 37 216 3,281 - 1 2,221 2,990 40 26 11 7
Wis. 33 29 260 N - 219 953 - - - 8
W.N. CENTRAL 145 197 1,955 12 4 1,629 2,930 53 12 3 14
Minn. 20 27 - 2 2 - 434 - - - -
Iowa 17 14 59 2 1 23 204 31 2 1 2
Mo. 53 97 1,382 1 - 1,198 1,655 22 6 1 12
N. Dak. - - - 1 1 - - - - - -
S. Dak. 2 - 126 - - 19 23 - 1 - -
Nebr. 15 20 388 1 - 57 158 - 1 1 -
Kans. 38 39 - 5 - 332 456 - 2 - -
S. ATLANTIC 880 2,224 5,851 9 - 14,000 15,883 17 34 10 29
Del. 32 32 - - - 227 295 - - - -
Md. 69 347 616 N - 1,870 2,111 - 1 1 8
D.C. 64 140 N - - 667 901 - - 1 1
Va. 36 233 1,631 N - 1,192 1,632 1 - 2 -
W. Va. 7 5 - N - 45 73 3 6 1 3
N.C. 1 85 - 4 - 2,686 3,538 5 11 3 7
S.C. 13 75 - 1 - 1,649 1,775 1 1 1 3
Ga. 215 235 1,001 1 - 3,230 2,748 - 3 - 4
Fla. 443 1,072 2,603 - - 2,434 2,810 7 12 1 3
E.S. CENTRAL 152 272 1,110 3 - 3,747 5,665 3 239 9 6
Ky. 43 37 - - - 582 732 - 2 2 2
Tenn. 56 127 1,101 N - 1,201 1,393 3 236 3 2
Ala. 35 35 - 1 - 1,876 2,298 - 1 - 1
Miss. 18 73 9 2 - 88 1,242 - - 4 1
W.S. CENTRAL 495 904 684 3 1 2,123 3,938 44 7 - 1
Ark. 19 45 - 2 - 438 439 - - - -
La. 113 168 - N 1 1,173 1,737 7 - - -
Okla. 1 57 684 1 - 512 58 30 5 - 1
Tex. 362 634 - - - - 1,704 7 2 - -
MOUNTAIN 120 209 523 7 1 846 1,254 94 46 4 12
Mont. 2 7 - - - 2 17 3 2 - 1
Idaho 1 5 190 2 - 9 19 33 7 - 1
Wyo. - 4 85 - - 6 7 27 16 - -
Colo. 54 76 - 3 1 284 407 4 12 4 5
N. Mex. 8 7 - - - 139 173 17 4 - -
Ariz. 37 38 - N - 329 390 6 2 - 1
Utah 17 5 68 1 - 26 24 4 3 - 2
Nev. 1 67 180 1 - 51 217 - - - 2
PACIFIC 703 1,770 1,444 13 4 2,594 4,100 53 79 9 4
Wash. 65 93 1,298 3 4 356 350 5 7 - -
Oreg. 48 59 - 4 - 9 42 2 4 - -
Calif. 580 1,539 - 4 - 2,125 3,487 26 60 9 2
Alaska 3 18 N - - 63 136 1 - - -
Hawaii 7 61 146 N - 41 85 19 8 - 2
Guam - - - N - - 12 - - - -
P.R. 255 494 N N U 33 75 8 7 - -
V.I. 1 - N N U - - - - - -
Amer. Samoa - - - N U - 4 - - - -
C.N.M.I. - - N N U - 4 - - - -
------------------------------------------------------------------------------------------------------------------------------------------
N: Not notifiable U: Unavailable -: no reported cases C.N.M.I.: Commonwealth of North Mariana Islands
* Updated monthly to the Division of HIV/AIDS Prevention, National Center for Prevention Services, last update January 30, 1996.
** National Electronic Telecommunications System for Surveillance.
*** Public Health Laboratory Information System.
=======================================================================================================================================================
TABLE II. (page 2) Cases of selected notifiable diseases, United States, weeks ending
February 17, 1996, and February 18, 1995 (7th Week)
Meningococcal Syphilis
Lyme Malaria Disease (Primary & Secondary) Tuberculosis Rabies, Animal
---------------- ---------------- ---------------- --------------------- ----------------- ----------------
Reporting Area Cum. Cum. Cum. Cum. Cum. Cum. Cum. Cum. Cum. Cum. Cum. Cum.
1996 1995 1996 1995 1996 1995 1996 1995 1996 1995 1996 1995
-----------------------------------------------------------------------------------------------------------------------------------------------------
UNITED STATES 298 503 95 115 503 423 1,245 2,108 1,254 1,475 359 701
NEW ENGLAND 21 18 3 3 19 26 24 26 35 24 53 192
Maine - - - - 5 2 - - 4 - - -
N.H. - - - - 1 6 - 1 - - 5 25
Vt. - - 1 - 1 2 - - - - 10 23
Mass. 4 2 2 - 4 7 12 11 8 9 14 97
R.I. 12 - - 2 - - - - 7 6 8 -
Conn. 5 16 - 1 8 9 12 14 16 9 16 47
MID. ATLANTIC 247 391 26 21 30 43 20 154 142 210 50 180
Upstate N.Y. 65 123 9 2 7 14 - 13 9 20 23 115
N.Y. City 120 27 16 8 5 7 10 91 67 94 - -
N.J. - 60 - 7 14 13 6 24 47 44 14 31
Pa. 62 181 1 4 4 9 4 26 19 52 13 34
E.N. CENTRAL 5 5 10 19 59 70 286 343 257 195 2 1
Ohio 4 3 1 - 29 19 116 115 48 37 1 1
Ind. 1 1 1 1 4 12 41 31 16 6 - -
Ill. - 1 2 15 17 24 79 122 164 105 - -
Mich. - - 5 1 4 8 30 41 26 44 - -
Wis. - - 1 2 5 7 20 34 3 3 1 -
W.N. CENTRAL 11 10 2 4 39 18 53 121 30 46 33 38
Minn. - - - 2 - - - 3 7 10 3 2
Iowa 8 - 1 - 13 6 4 10 5 12 20 10
Mo. - 4 1 2 15 9 46 106 9 14 1 6
N. Dak. - - - - 1 - - - - - 2 4
S. Dak. - - - - 2 - - - 5 - 7 11
Nebr. - - - - 4 1 3 2 - - - -
Kans. 3 6 - - 4 2 - - 4 10 - 5
S. ATLANTIC 12 64 20 28 81 70 391 548 121 227 187 201
Del. - 8 2 1 1 1 9 3 - 7 10 11
Md. 9 46 8 5 10 1 65 51 21 62 57 48
D.C. - - 1 3 2 1 13 20 8 15 - 1
Va. - 1 5 3 5 4 56 76 1 - 52 36
W. Va. 2 5 - - 3 - 1 - 10 13 3 8
N.C. 1 3 2 4 12 10 122 156 24 10 26 40
S.C. - 1 - - 15 6 45 81 19 29 6 12
Ga. - - 2 3 24 26 43 97 - 40 28 36
Fla. - - - 9 9 21 37 64 38 51 5 9
E.S. CENTRAL - 4 - 1 42 22 334 508 112 112 7 27
Ky. - - - - 6 6 32 31 18 14 - 3
Tenn. - 3 - - 3 5 84 81 - 46 - 12
Ala. - - - 1 16 8 89 83 57 52 7 12
Miss. - 1 - - 17 3 129 313 37 - - -
W.S. CENTRAL - - 1 - 71 42 120 289 82 55 1 20
Ark. - - - - 8 4 41 70 10 9 - 11
La. - - - - 15 5 69 149 - - - 7
Okla. - - - - 3 6 10 23 9 21 1 2
Tex. - - 1 - 45 27 - 47 63 25 - -
MOUNTAIN - 1 7 8 41 35 16 37 49 59 5 7
Mont. - - - 1 1 1 - 1 - - - 3
Idaho - - 1 - 4 2 - - 1 2 - -
Wyo. - - - - 2 1 - - - - 3 -
Colo. - - 4 5 4 9 8 18 2 3 - -
N. Mex. - - 1 2 9 5 - 7 2 13 1 -
Ariz. - - - - 14 15 6 6 37 37 1 4
Utah - - 1 - 3 1 - 1 - 3 - -
Nev. - 1 - - 4 1 2 4 7 1 - -
PACIFIC 2 10 26 31 121 97 1 82 426 547 21 35
Wash. - - - 3 7 6 - 1 33 32 - -
Oreg. 1 - 3 2 20 24 1 1 5 3 - -
Calif. 1 10 22 24 90 66 - 80 362 477 18 34
Alaska - - - 1 2 - - - 10 12 3 1
Hawaii - - 1 1 2 1 - - 16 23 - -
Guam - - - - - 1 - 1 - 4 - -
P.R. - - - - - 6 26 40 - - 3 10
V.I. - - - - - - - - - - - -
Amer. Samoa - - - - - - - - - 1 - -
C.N.M.I. - - - - - - - - - 4 - -
-----------------------------------------------------------------------------------------------------------------------------------------------------
N: Not notifiable U: Unavailable -: no reported cases
=======================================================================================================================================================
Return to top. Table_III Note: To print large tables and graphs users may have to change their printer settings to landscape and use a small font size.
TABLE III. (page 1) Cases of selected notifiable diseases preventable by vaccination, United
States, weeks ending February 17, 1996, and February 18, 1995 (7th Week)
Hepatitis (Viral), by type Measles (Rubeola)
H. influenzae, --------------------------------------- -------------------------------------
invasive A B Indigenous Imported**
---------------- ----------------- ----------------- --------------- ---------------
Reporting Area Cum. Cum. Cum. Cum. Cum. Cum. Cum. Cum.
1996* 1995 1996 1995 1996 1995 1996 1996 1996 1996
------------------------------------------------------------------------------------------------------------------------------
UNITED STATES 161 184 2,638 2,995 739 993 - 3 - 1
NEW ENGLAND 4 1 27 20 2 34 - 2 - -
Maine - - 4 5 - 1 - 1 - -
N.H. 4 - 2 1 - 2 - - - -
Vt. - 1 - - - 1 - - - -
Mass. - - 12 3 1 4 - 1 - -
R.I. - - 2 4 1 5 - - - -
Conn. - - 7 7 - 21 - - - -
MID. ATLANTIC 25 19 154 126 115 91 - - - -
Upstate N.Y. 9 6 33 19 27 34 - - - -
N.Y. City 2 2 113 61 82 14 - - - -
N.J. 8 4 - 22 - 24 - - - -
Pa. 6 7 8 24 6 19 - - - -
E.N. CENTRAL 23 44 234 527 73 163 - - - -
Ohio 18 23 144 309 16 11 - - - -
Ind. - 3 40 26 1 28 - - - -
Ill. 5 15 9 106 5 53 - - - -
Mich. - 3 38 51 48 63 - - - -
Wis. - - 3 35 3 8 - - - -
W.N. CENTRAL 9 5 173 121 66 76 - - - -
Minn. - - - 5 - 1 - - - -
Iowa 7 1 67 8 34 11 - - - -
Mo. 2 4 60 95 21 62 - - - -
N. Dak. - - 2 - - - - - - -
S. Dak. - - 9 - - - - - - -
Nebr. - - 11 6 2 2 - - - -
Kans. - - 24 7 9 - - - - -
S. ATLANTIC 33 43 97 115 132 127 - - - -
Del. - - 1 2 - 1 - - - -
Md. 10 13 25 28 37 33 - - - -
D.C. - - 3 1 1 7 - - - -
Va. 2 5 10 30 17 10 - - - -
W. Va. - - 3 4 3 9 - - - -
N.C. 5 10 18 14 55 39 - - - -
S.C. 1 - 10 1 6 3 - - - -
Ga. 15 7 - - - 3 - - - -
Fla. - 8 27 35 13 22 - - - -
E.S. CENTRAL 2 2 87 156 11 135 - - - -
Ky. - 1 4 15 - 16 - - - -
Tenn. - - 19 110 6 100 - - - -
Ala. 2 1 9 22 5 19 - - - -
Miss. - - 55 9 - - - - - -
W.S. CENTRAL 7 4 470 205 52 47 - - - -
Ark. - 1 80 10 5 - - - - -
La. - - 6 5 5 4 - - - -
Okla. 7 3 241 71 14 9 - - - -
Tex. - - 143 119 28 34 - - - -
MOUNTAIN 13 19 413 578 119 72 - - - -
Mont. - - 10 9 - 4 - - - -
Idaho 1 1 65 65 15 13 - - - -
Wyo. 3 1 4 20 3 - - - - -
Colo. 1 2 24 86 9 20 - - - -
N. Mex. 4 4 82 116 55 20 - - - -
Ariz. 2 6 101 135 11 9 - - - -
Utah 1 2 106 128 19 2 - - - -
Nev. 1 3 21 19 7 4 U - U -
PACIFIC 45 47 983 1,147 169 248 - 1 - 1
Wash. - 3 46 28 8 8 - 1 - -
Oreg. 3 6 142 218 7 17 U - U -
Calif. 40 36 767 883 151 219 - - - -
Alaska - - 12 13 2 1 - - - -
Hawaii 2 2 16 5 1 3 - - - 1
Guam - - - - - - U - U -
P.R. - 2 14 2 27 13 - - - -
V.I. - - - - - - U - U -
Amer. Samoa - - - 4 - - U - U -
C.N.M.I. - - - 1 - - U - U -
------------------------------------------------------------------------------------------------------------------------------
* Of 32 cases reported among children aged <5 years, serotype was reported for 7 and of those, 1 was type B.
** For imported measles, cases include only those resulting from importation from other countries.
N: Not notifiable U: Unavailable -: no reported cases
============================================================================================================================================
TABLE III. (page 2) Cases of selected notifiable diseases preventable by vaccination, United
States, weeks ending February 17, 1996, and February 18, 1995 (7th Week)
Measles (Rubeola), cont'd.
--------------------------
Total Mumps Pertussis Rubella
-------------------------- -------------------------- --------------------------- ---------------------------
Reporting Area Cum. Cum. Cum. Cum. Cum. Cum. Cum. Cum.
1996 1995 1996 1996 1995 1996 1996 1995 1996 1996 1995
------------------------------------------------------------------------------------------------------------------------------------------
UNITED STATES 4 35 10 69 93 41 173 347 5 16 10
NEW ENGLAND 2 3 - - - 4 18 36 - 2 1
Maine 1 - - - - - 2 5 - - -
N.H. - - - - - 1 4 1 - - -
Vt. - - - - - - 5 2 - - -
Mass. 1 1 - - - 3 7 26 - - 1
R.I. - 2 - - - - - - - - -
Conn. - - - - - - - 2 - 2 -
MID. ATLANTIC - - - 5 12 5 25 31 - - -
Upstate N.Y. - - - 3 3 5 22 18 - - -
N.Y. City - - - 2 1 - 3 8 - - -
N.J. - - - - - - - 3 - - -
Pa. - - - - 8 - - 2 - - -
E.N. CENTRAL - - 3 20 16 3 33 47 - - -
Ohio - - 2 10 7 3 24 22 - - -
Ind. - - 1 1 2 - 2 3 - - -
Ill. - - - - - - - - - - -
Mich. - - - 9 7 - 5 21 - - -
Wis. - - - - - - 2 1 - - -
W.N. CENTRAL - 1 - 2 8 1 1 14 - - -
Minn. - - - - - 1 1 - - - -
Iowa - - - - 1 - - 1 - - -
Mo. - 1 - - 7 - - 6 - - -
N. Dak. - - - 2 - - - 1 - - -
S. Dak. - - - - - - - 1 - - -
Nebr. - - - - - - - - - - -
Kans. - - - - - - - 5 - - -
S. ATLANTIC - - 3 6 14 2 16 34 - - 1
Del. - - - - - - - 1 - - -
Md. - - 1 1 4 2 11 - - - -
D.C. - - - - - - - 1 - - -
Va. - - 1 2 4 - - - - - -
W. Va. - - - - - - - - - - -
N.C. - - - - 3 - - 30 - - -
S.C. - - 1 2 1 - 2 1 - - -
Ga. - - - 1 - - 1 - - - -
Fla. - - - - 2 - 2 1 - - 1
E.S. CENTRAL - - - 3 4 - 5 9 - - -
Ky. - - - - - - 4 - - - -
Tenn. - - - - - - - - - - -
Ala. - - - 3 2 - 1 9 - - -
Miss. - - - - 2 - - - N N N
W.S. CENTRAL - - - 3 7 1 3 4 - - -
Ark. - - - - 2 1 2 - - - -
La. - - - 3 1 - 1 - - - -
Okla. - - - - - - - - - - -
Tex. - - - - 4 - - 4 - - -
MOUNTAIN - 31 - 6 3 3 18 121 - - 2
Mont. - - - - - 2 2 2 - - -
Idaho - - - - - - 2 47 - - -
Wyo. - - - - - - - - - - -
Colo. - 17 - - - - - 23 - - -
N. Mex. - 9 N N N 1 9 3 - - -
Ariz. - 5 - - - - 2 46 - - 2
Utah - - - - 1 - - - - - -
Nev. - - U 6 2 U 3 - U - -
PACIFIC 2 - 4 24 29 22 54 51 5 14 6
Wash. 1 - - 2 1 - 5 4 - - -
Oreg. - - N N N U 12 - U - -
Calif. - - 4 15 25 22 36 45 5 14 6
Alaska - - - 1 2 - - - - - -
Hawaii 1 - - 6 1 - 1 2 - - -
Guam - - U - - U - - U - -
P.R. - - - - - - - 1 - - -
V.I. - - U - - U - - U - -
Amer. Samoa - - U - - U - - U - -
C.N.M.I. - - U - - U - - U - -
------------------------------------------------------------------------------------------------------------------------------------------
N: Not notifiable U: Unavailable -: no reported cases
============================================================================================================================================
Return to top. Table_IV Note: To print large tables and graphs users may have to change their printer settings to landscape and use a small font size.
TABLE IV. Deaths in 121 U.S. cities* week ending
February 17, 1996 (7th Week)
===================================================================================================================================
All Causes, By Age (Years)
------------------------------------------------------------------------ P&I**
Reporting Area All Ages >=65 45-64 25-44 1-24 <1 Total
---------------------------------------------------------------------------------------------------------------
NEW ENGLAND 593 438 86 42 11 16 34
Boston, Mass. 146 96 22 14 5 9 4
Bridgeport, Conn. 34 30 2 2 - - -
Cambridge, Mass. 19 16 2 1 - - 1
Fall River, Mass. 37 34 2 1 - - 1
Hartford, Conn. 56 39 10 4 - 3 3
Lowell, Mass. 28 21 7 - - - 3
Lynn, Mass. 18 15 3 - - - 1
New Bedford, Mass. 27 20 7 - - - -
New Haven, Conn. 44 27 6 6 3 2 3
Providence, R.I. 56 43 6 5 1 1 4
Somerville, Mass. 3 3 - - - - 1
Springfield, Mass. 39 25 7 5 1 1 5
Waterbury, Conn. 28 22 4 1 1 - 3
Worcester, Mass. 58 47 8 3 - - 5
MID. ATLANTIC 2,414 1,622 447 266 42 37 117
Albany, N.Y. 52 39 13 - - - 5
Allentown, Pa. 22 20 2 - - - 1
Buffalo, N.Y. U U U U U U U
Camden, N.J. 38 23 9 3 - 3 2
Elizabeth, N.J. 34 24 4 5 - 1 -
Erie, Pa.*** 39 31 7 1 - - 1
Jersey City, N.J. 62 40 12 8 1 1 -
New York City, N.Y. 1,346 890 236 174 25 21 61
Newark, N.J. 74 28 25 18 2 1 8
Paterson, N.J. 19 13 3 3 - - 2
Philadelphia, Pa. 300 190 69 32 7 2 9
Pittsburgh, Pa.*** 87 64 14 4 2 3 7
Reading, Pa. 24 20 3 - - 1 2
Rochester, N.Y. 107 78 21 6 1 1 10
Schenectady, N.Y. 28 24 3 1 - - 1
Scranton, Pa.*** 33 30 - 3 - - 2
Syracuse, N.Y. 103 75 15 7 4 2 6
Trenton, N.J. 27 20 6 - - 1 -
Utica, N.Y. 19 13 5 1 - - -
Yonkers, N.Y. U U U U U U U
E.N. CENTRAL 2,181 1,482 399 188 59 53 170
Akron, Ohio 56 42 9 2 1 2 -
Canton, Ohio 50 43 6 1 - - 7
Chicago, Ill. 448 275 89 56 16 12 44
Cincinnati, Ohio 104 70 23 6 3 2 6
Cleveland, Ohio 118 84 20 12 - 2 2
Columbus, Ohio 182 127 24 14 6 11 16
Dayton, Ohio 124 83 23 13 4 1 13
Detroit, Mich. 205 119 49 26 5 6 13
Evansville, Ind. 51 36 10 2 - 3 1
Fort Wayne, Ind. 64 44 16 2 - 2 6
Gary, Ind. U U U U U U U
Grand Rapids, Mich. 52 35 10 4 1 2 9
Indianapolis, Ind. 220 140 38 27 10 5 8
Madison, Wis. U U U U U U U
Milwaukee, Wis. 175 131 28 8 7 1 12
Peoria, Ill. 40 32 5 2 - 1 3
Rockford, Ill. 53 43 9 1 - - 8
South Bend, Ind. 46 37 7 1 1 - 7
Toledo, Ohio 107 78 19 5 2 3 8
Youngstown, Ohio 86 63 14 6 3 - 7
W.N. CENTRAL 668 464 122 44 19 14 48
Des Moines, Iowa 56 40 12 2 1 1 3
Duluth, Minn. 15 11 3 - - 1 -
Kansas City, Kans. 19 14 3 2 - - 1
Kansas City, Mo. 123 70 30 10 6 2 3
Lincoln, Nebr. 35 22 9 3 - 1 1
Minneapolis, Minn. 180 139 22 15 3 1 23
Omaha, Nebr. 109 76 18 7 3 5 5
St. Louis, Mo. 109 78 19 4 5 3 12
St. Paul, Minn. U U U U U U U
Wichita, Kans. 22 14 6 1 1 - -
S. ATLANTIC 1,199 776 233 131 43 15 64
Atlanta, Ga. 202 132 23 34 12 1 4
Baltimore, Md. 115 63 30 15 6 1 14
Charlotte, N.C. 134 95 26 10 1 2 9
Jacksonville, Fla. 156 104 26 17 6 3 5
Miami, Fla. 119 68 32 14 4 1 1
Norfolk, Va. 54 32 14 7 1 - 4
Richmond, Va. 98 60 21 9 4 3 5
Savannah, Ga. 59 37 11 9 1 1 1
St. Petersburg, Fla. 55 43 9 3 - - 3
Tampa, Fla. 197 137 36 13 8 3 18
Washington, D.C. U U U U U U U
Wilmington, Del. 10 5 5 - - - -
E.S. CENTRAL 938 611 194 73 32 26 73
Birmingham, Ala. 167 108 27 16 5 9 4
Chattanooga, Tenn. 112 83 21 4 2 2 4
Knoxville, Tenn. 73 50 19 2 2 - 12
Lexington, Ky. 70 49 13 5 2 1 7
Memphis, Tenn. 212 125 57 19 7 4 21
Mobile, Ala. 65 44 10 3 6 2 4
Montgomery, Ala. 72 45 12 7 3 5 2
Nashville, Tenn. 167 107 35 17 5 3 19
W.S. CENTRAL 1,187 797 224 102 35 27 74
Austin, Tex. 91 59 23 7 1 1 2
Baton Rouge, La. 56 35 11 8 - 2 -
Corpus Christi, Tex. 47 32 7 1 1 6 4
Dallas, Tex. 275 172 54 36 8 5 11
El Paso, Tex. 66 38 14 7 5 - 8
Ft. Worth, Tex. 108 72 18 9 7 2 -
Houston, Tex. U U U U U U U
Little Rock, Ark. 62 38 15 4 3 2 6
New Orleans, La. 135 94 24 9 5 3 -
San Antonio, Tex. 205 149 38 13 2 3 26
Shreveport, La. 33 22 6 3 1 1 4
Tulsa, Okla. 109 86 14 5 2 2 13
MOUNTAIN 767 526 142 67 16 16 67
Albuquerque, N.M. 114 83 19 9 3 - 2
Colo. Springs, Colo. 38 23 9 4 - 2 2
Denver, Colo. 108 64 26 13 1 4 13
Las Vegas, Nev. 161 103 40 14 1 3 12
Ogden, Utah 24 19 4 1 - - -
Phoenix, Ariz. U U U U U U U
Pueblo, Colo. 28 20 6 2 - - 3
Salt Lake City, Utah 111 75 19 7 5 5 11
Tucson, Ariz. 183 139 19 17 6 2 24
PACIFIC 1,631 1,128 266 162 39 32 131
Berkeley, Calif. 23 15 3 4 - 1 2
Fresno, Calif. U U U U U U U
Glendale, Calif. 31 21 5 2 3 - 2
Honolulu, Hawaii 75 60 9 4 1 1 7
Long Beach, Calif. 68 50 7 7 3 1 11
Los Angeles, Calif. 485 323 83 54 17 8 23
Pasadena, Calif. 26 24 - 2 - - 3
Portland, Oreg. 131 96 18 14 2 1 12
Sacramento, Calif. U U U U U U U
San Diego, Calif. 158 105 32 10 1 6 20
San Francisco, Calif. 157 99 33 23 1 1 13
San Jose, Calif. 140 103 25 7 2 3 16
Santa Cruz, Calif. 39 28 4 4 2 1 5
Seattle, Wash. 158 100 26 21 7 4 5
Spokane, Wash. 67 49 9 7 - 2 5
Tacoma, Wash. 73 55 12 3 - 3 7
TOTAL 11,578**** 7,844 2,113 1,075 296 236 778
---------------------------------------------------------------------------------------------------------------
* Mortality data in this table are voluntarily reported from 121 cities in the United States, most of which have populations
of 100,000 or more. A death is reported by the place of its occurrence and by the week that the death certificate was
filed. Fetal deaths are not included.
** Pneumonia and influenza.
*** Because of changes in reporting methods in these 3 Pennsylvania cities, these numbers are partial counts for the current
week. Complete counts will be available in 4 to 6 weeks.
**** Total includes unknown ages.
U: Unavailable -: no reported cases
===================================================================================================================================
Return to top. Disclaimer All MMWR HTML versions of articles are electronic conversions from ASCII text into HTML. This conversion may have resulted in character translation or format errors in the HTML version. Users should not rely on this HTML document, but are referred to the electronic PDF version and/or the original MMWR paper copy for the official text, figures, and tables. An original paper copy of this issue can be obtained from the Superintendent of Documents, U.S. Government Printing Office (GPO), Washington, DC 20402-9371; telephone: (202) 512-1800. Contact GPO for current prices. **Questions or messages regarding errors in formatting should be addressed to mmwrq@cdc.gov.Page converted: 09/19/98 |
|||||||||
This page last reviewed 5/2/01
|