 |
|
|
|
|
|
|
| ||||||||||
|
|
|
|
|
|
|
||||
| ||||||||||
|
|
|
|
|
Persons using assistive technology might not be able to fully access information in this file. For assistance, please send e-mail to: mmwrq@cdc.gov. Type 508 Accommodation and the title of the report in the subject line of e-mail. Suicide Among Older Persons -- United States, 1980-1992Age-specific rates of suicide in the United States consistently have been highest among older persons. However, the overall suicide rate for persons aged greater than or equal to 65 years had been declining from the 1940s (the first full decade when the entire continental United States entered the death registration area) until the 1980s (1), before increasing during 1980-1992. In 1992, persons aged greater than or equal to 65 years accounted for 13% of the population but almost one fifth of all suicides. From 1980 through 1992, overall suicide rates increased for persons in only two age groups: 5-19 years and greater than or equal to 65 years (2). This report summarizes trends in suicide among persons aged greater than or equal to 65 years from 1980 through 1992 (the most recent year for which final data are available) and indicates that the risk for suicide among older persons has started to steadily increase after years of decline. Suicides among older persons were identified using CDC's underlying cause mortality files for each year (3). Suicide deaths and methods of fatal injury were classified using the International Classification of Diseases, Ninth Revision, on death certificates by the attending physician, medical examiner, or coroner. Suicide rates were calculated using population data from the 1980 and 1990 census enumerations and intercensal and postcensal year estimates compiled by the U. S. Bureau of the Census. During 1980-1992, of the 384,262 suicides in the United States, 74,675 (19%) occurred among persons aged greater than or equal to 65 years. From 1980 to 1992, the number of suicides among persons in this age group increased 36%, from 4537 to 6160; in comparison, rates for this group increased 9%, from 17.6 to 19.1 per 100,000 population aged greater than or equal to 65 years. Suicide rates decreased for persons aged 65-69 years and 70-74 years but increased substantially in older groups (75-79 years {11%}, 80-84 years {35%}, and greater than or equal to 85 years {15%}). Men accounted for 81% of suicides among persons aged greater than or equal to 65 years; the rate for men increased 10%, from 34.8 to 38.4. For women, the rate decreased 0.7%, from 6.04 to 6.00 (Table_1). From 1980 to 1992, the largest relative increases in suicide rates occurred in the 80-84-year age group (35%, from 18.2 to 24.6) and in men (10%, from 34.8 to 38.4) (Table_1). For both men and women, the highest increase occurred among persons aged 80-84 years: the rate for men increased 35% (from 43.5 to 58.6), and the rate for women increased 36% (from 4.7 to 6.4). In addition, the highest suicide rate (24.6) occurred in 1992 among persons aged 80-84 years. Firearms were the most common method of suicide used by both men (74%) and women (31%) aged greater than or equal to 65 years (Figure_1). During 1980-1992, firearm-related suicides increased from 60% to 69%, and the firearm-related suicide rate increased by 24%, from 10.6 to 13.1. Among men, the percentage of suicides completed with a firearm increased from 69% to 77%; among women, the percentage increased from 24% to 35%. For persons aged greater than or equal to 65 years, sex- and marital status-specific suicide rates were highest for divorced/widowed men. During 1980-1992, the suicide rate for married persons aged greater than or equal to 65 years increased 4% (from 17.3 to 18.0); rates increased 3% for never-married persons (from 24.8 to 25.5) and 9% for divorced/widowed persons (from 20.5 to 22.4). In 1992, the rate for divorced/widowed men aged greater than or equal to 65 years (76.4) was 2.7 times that for married men, 1.4 times that for never-married men, and greater than 17 times that for married women. In addition, the rate for divorced/widowed women (8.0) was 1.8 times that for married women and 1.4 times that for never-married women. Reported by: Div of Violence Prevention, National Center for Injury Prevention and Control, CDC. Editorial NoteEditorial Note: In 1992, suicide was the third leading cause of injury-related deaths among older U.S. residents, following deaths from unintentional falls and unintentional motor-vehicle crashes (CDC, unpublished data, 1992). The findings in this report document an increase in suicide among older persons following decades of decline and indicate that a substantial proportion of this increase was associated with an increase in firearm-related suicide. Because older persons constitute the fastest growing age group in the United States (4), the number of suicides in this age group probably will continue to increase. In addition, recent studies of cohorts indicate that suicide rates have, in general, been greater among younger adults than among their grandparents at a similar age (5). As these younger adults age, their suicide rates may increase above those of currently older U.S. residents (5). In some birth cohorts, suicide rates may be higher because of the relative size of the group: larger cohorts may be subject to increased "stressors" from increased competition for resources and a disparity between expectations and the means to satisfy those expectations (5). Risk factors for suicide among older persons differ from those among younger persons and include a higher prevalence of alcohol abuse and depression, greater use of highly lethal methods, and social isolation (6). In addition, older persons make fewer attempts per completed suicide, have a higher male-to-female ratio than other age groups, have often visited a health-care provider shortly before their suicide, and have more physical illnesses and affective disorders (7). The findings in this report underscore the need for suicide-prevention activities directed at older persons -- particularly because suicide rates among older persons are higher than among other age groups, and because health professionals and others have not fully recognized suicide as a preventable health problem among older persons (8). In particular, one of the national health objectives for the year 2000 is to reduce the suicide rate for white men aged greater than or equal to 65 years by 15% (objective 7.2c) (9). Strategies for reducing suicide rates among older persons include senior peer counseling programs; efforts that target high-risk persons; improving mental health services through suicide-prevention centers; and programs that increase awareness of risk factors among those who have frequent contact with seniors (8). A free copy of "Suicide in the United States, 1980-1992" can be obtained from CDC Suicide Surveillance, 4770 Buford Highway, N.E., Mailstop K-60, Atlanta, GA 30341-3724. References
Table_1 Note: To print large tables and graphs users may have to change their printer settings to landscape and use a small font size.
TABLE 1. Rate * of suicide for persons aged >=65 years and percentage change from 1980 to 1992,
by age group and race -- United States
==================================================================================================
                   Men                       Women                      Total
Age group  -----------------------    ----------------------   -------------------------
  (yrs)     1980   1992   % Change    1980   1992   % Change    1980   1992   % Change
--------------------------------------------------------------------------------------------------
65-69      28.0   27.4     - 2.1      6.6    6.0     - 9.1     16.1   15.6    - 3.1
70-74      33.3   33.0     - 0.9      6.4    5.8     - 9.4     17.7   17.5    - 1.1
75-79      41.1   45.2     +10.0      5.9    6.1     + 3.4     19.5   21.6    +10.8
80-84      43.5   58.6     +34.7      4.7    6.4     +36.2     18.2   24.6    +35.2
 >=85      50.1   62.6     +25.0      5.4    6.0     +11.1     19.0   21.9    +15.3

Total      34.8   38.4     +10.3      6.0    6.0     - 0.7     17.6   19.1    + 8.5
--------------------------------------------------------------------------------------------------
* Per 100,000 pouplation, rounded to tenths.
==================================================================================================
Return to top. Figure_1 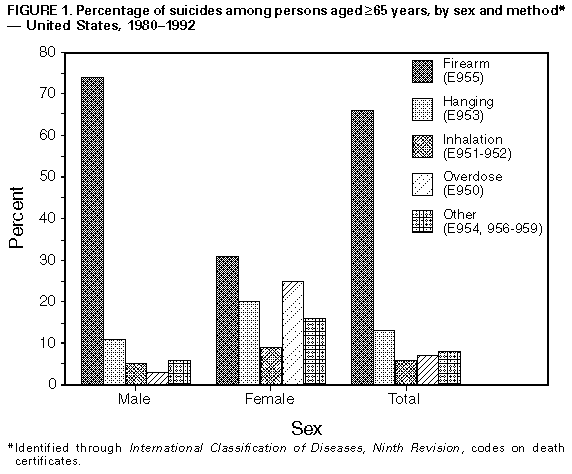 Return to top. Disclaimer All MMWR HTML versions of articles are electronic conversions from ASCII text into HTML. This conversion may have resulted in character translation or format errors in the HTML version. Users should not rely on this HTML document, but are referred to the electronic PDF version and/or the original MMWR paper copy for the official text, figures, and tables. An original paper copy of this issue can be obtained from the Superintendent of Documents, U.S. Government Printing Office (GPO), Washington, DC 20402-9371; telephone: (202) 512-1800. Contact GPO for current prices. **Questions or messages regarding errors in formatting should be addressed to mmwrq@cdc.gov.Page converted: 09/19/98 |
|||||||||
This page last reviewed 5/2/01
|