 |
|
|
|
|
|
|
| ||||||||||
|
|
|
|
|
|
|
||||
| ||||||||||
|
|
|
|
|
Persons using assistive technology might not be able to fully access information in this file. For assistance, please send e-mail to: mmwrq@cdc.gov. Type 508 Accommodation and the title of the report in the subject line of e-mail. MMWR Summary of Notifiable Diseases, United States, 1993The following CDC staff members prepared this report: Denise T. Koo, M.D., M.P.H. Andrew G. Dean, M.D., M.P.H. Ruth W. Slade Carol M. Knowles Deborah A. Adams Wanda K. Fortune Patsy A. Hall Robert F. Fagan Barbara Panter-Connah Harry R. Holden Gerald F. Jones Clarence Lee Maddox Division of Surveillance and Epidemiology Epidemiology Program Office Consultant Willie J. Anderson Office of the Vice President for Health Affairs Emory University Foreword MMWR Summary of Notifiable Diseases, United States, 1993 This publication contains summary tables of the official statistics for the occurrence of nationally notifiable diseases in the United States for calendar year 1993. This information is collected and compiled from reports to the National Notifiable Diseases Surveillance System (NNDSS). Part 1 contains information on morbidity for each of the 49 currently notifiable conditions. In all tables, leprosy is listed as Hansen disease, typhus fever (flea-borne) as murine typhus fever, and typhus fever (tick- borne) as Rocky Mountain spotted fever (RMSF). The tables show the number of cases of notifiable diseases reported to CDC for 1993, as well as the distri- bution of cases by month and geographic location, and by patient's age, race, and ethnicity. Part 2 contains graphs and maps depicting summary data for many of the notifiable conditions described in tabular form in Part I. Part 3 includes tables showing the number of cases of notifiable diseases reported to CDC and to the National Office of Vital Statistics since 1944. It also includes a table on deaths associated with specified notifiable diseases reported to the National Center for Health Statistics, CDC, for the period 1982-1991. Background As of January 1, 1994, 49 infectious diseases were designated as noti- fiable at the national level. A notifiable disease is one for which regular, frequent, and timely information on individual cases is considered necessary for the prevention and control of the disease. This section briefly sum- marizes the history of national notifiable disease reporting in the United States. In 1878, Congress authorized the U.S. Public Health Service (PHS) to collect morbidity reports on cholera, smallpox, plague, and yellow fever from U.S. consuls overseas; this information was to be used for instituting quar- antine measures to prevent the introduction and spread of these diseases into the United States. In 1879, a specific Congressional appropriation was made for the collection and publication of reports of these notifiable diseases. The authority for weekly reporting and publication was expanded by Congress in 1893 to include data from states and municipal authorities. To increase the uniformity of the data, Congress enacted a law in 1902 directing the Surgeon General to provide forms for the collection and compilation of data and for the publication of reports at the national level. In 1912, state and territorial health authorities -- in conjunction with PHS -- recommended weekly telegraphic reporting of five infectious diseases and monthly report- ing by letter of 10 additional diseases. The first annual summary of The Notifiable Diseases in 1912 included reports of 10 diseases from 19 states, the District of Columbia, and Hawaii. By 1928, all states, the District of Columbia, Hawaii, and Puerto Rico were participating in national reporting of nearly 30 specified conditions. At their meeting in 1950, the State and Territorial Health Officers authorized a conference of state epidemiologists whose purpose was to determine which diseases should be reported to PHS. CDC assumed responsibility for the collection and publication of data on nation- ally notifiable diseases in 1961. Public health officials at state health departments and CDC continue to collaborate in determining which diseases should be nationally notifiable; the Council of State and Territorial Epidemiologists (CSTE) makes recommenda- tions annually for additions and deletions to the national notifiable disease list on the basis of CDC suggestions. However, reporting of nationally noti- fiable diseases to CDC by the states is voluntary. Reporting is currently mandated only at the state level. The list of diseases that are considered notifiable, therefore, varies slightly by state. All states generally report the internationally quarantinable diseases (i.e., cholera, plague, and yellow fever) in compliance with the World Health Organization's International Health Regulations. The list of nationally notifiable diseases is revised periodically. Diseases are added to the list as new pathogens emerge; diseases are deleted as their incidence declines. During 1993, 49 infectious diseases were con- sidered notifiable at the national level and were reported to CDC; 41 were reported on a weekly basis, and eight were reported monthly. CSTE will review the principles of notifiable disease reporting in late fall 1994. Data Sources Provisional data on the reported occurrence of notifiable diseases are published routinely in MMWR; these data are compiled in final form in this summary. Notifiable disease reports published in the annual MMWR Summary of Notifiable Diseases are the authoritative and archival counts of cases. Data from surveillance records for selected diseases, which are useful for de- tailed epidemiologic analyses, are published on a periodic basis. Data ap- pearing in those surveillance reports may not agree exactly with reports published in MMWR due to differences in the timing of reports or the source of the data or due to refinements in case definitions. Data in this summary are primarily derived from electronic reports trans- mitted to the Epidemiology Program Office, CDC, by state and territorial health departments through the National Electronic Telecommunications System for Surveillance (NETSS). Final data for other diseases are from surveillance program records of the CDC programs listed below. Requests for further infor- mation regarding these data should be directed to the appropriate source. National Center for Health Statistics Office of Vital and Health Statistics Systems (deaths from selected notifiable diseases) National Center for Infectious Diseases Division of Bacterial and Mycotic Diseases (cholera and toxic- shock syndrome) Division of HIV/AIDS (human immunodeficiency virus/acquired immunodeficiency syndrome) Division of Vector-Borne Infectious Diseases (arboviral infec tions of the central nervous system and plague) Division of Viral and Rickettsial Diseases (animal rabies) National Center for Prevention Services Division of Sexually Transmitted Diseases and HIV Prevention (gonorrhea, syphilis, chancroid, granuloma inguinale, and lymphogranuloma venereum) Division of Tuberculosis Elimination (tuberculosis) National Immunization Program Epidemiology and Surveillance Division (poliomyelitis) Disease totals for the United States, unless otherwise stated, do not include data for American Samoa, Guam, Puerto Rico, the Virgin Islands, and the Commonwealth of the Northern Mariana Islands (CNMI). Data on notifiable diseases before 1960 are obtained from publications of the National Office of Vital Statistics. Population estimates for states are based on the July 1, 1993, post- censal estimates made by the U.S. Department of Commerce, Bureau of the Census, Population Division, Population Estimates Branch, Press Release CB93-219. Population estimates for territories are from the 1990 census, U.S. Department of Commerce, Bureau of the Census, Press Releases CB91-142, 242, 243, 263, and 276. Rates in the 1993 Summary of Notifiable Diseases were based on data for the U.S. total resident population. However, population data from states in which diseases were not notifiable or not available were excluded from rate calculations. Interpreting Data Although the data reported in this summary are important for analyzing disease trends and determining relative disease burdens, these data must be interpreted with caution. Some diseases, such as plague and rabies, that cause severe clinical illness and are associated with serious consequences probably are diagnosed and reported accurately. However, diseases that are clinically mild and infrequently associated with serious consequences (e.g., salmonellosis and mumps) are less likely to be reported. Additionally, sub- clinical cases are seldom detected except in the course of special studies. The degree of completeness of reporting also is influenced by the diagnostic facilities available, the control measures in effect, and the interests and priorities of state and local officials responsible for disease control and surveillance. Finally, factors such as the introduction of new diagnostic tests and the discovery of new disease entities may cause changes in disease reporting that are independent of the true incidence of disease. Public health surveillance data are published for selected racial and ethnic population groups because these variables may be risk markers for certain notifiable diseases. Risk markers can identify potential risk factors for investigation in future studies. Data on race and ethnicity also can be useful for identifying groups to target for prevention efforts. Year 2000 Objectives for racial and ethnic groups have been established for several of the notifiable diseases. EXPLANATION OF SYMBOLS USED IN TABLES, GRAPHS, AND MAPS Data not available ............................................. NA No reported cases .............................................. - Report of disease not required by state health department (not notifiable) ............................................. NN 1993 HIGHLIGHTS FOR SELECTED DISEASES This section highlights important developments in the reported occur- rences of certain notifiable and non-notifiable infectious diseases. Those diseases that currently are not nationally notifiable are highlighted under the subheading "Emerging Infections." AIDS In 1993, the number of AIDS cases reported to CDC increased 127% from the number reported in 1992. The large increase in the number of cases was largely due to changes in the 1993 AIDS surveillance case definition. As of January 1, 1993, HIV-infected persons with additional clinical conditions, as well as those with markers of severe immunosuppression, were defined as having AIDS. Botulism In 1993, two restaurant-associated outbreaks of botulism occurred in which unusual vehicles of transmission were implicated. In one of the out- breaks, which occurred in Georgia, the toxin was transmitted by a canned cheese sauce; in the other outbreak in Texas, toxin was transmitted by a dip containing baked potatoes. Cholera Epidemics of cholera caused by a new pathogen, Vibrio cholerae O139, occurred in late 1992 and early 1993 in southern Asia; in the United States, the first recognized case of infection caused by Vibrio cholerae 0139 occurred during 1993 in a California resident who had visited India in January 1993. Diphtheria Outbreaks of diphtheria were reported from the Newly Independent States of the former Soviet Union (especially Russia and Ukraine) and Ecuador. No cases were reported last year among U.S. travelers to these countries. Haemophilus influenzae The rate of Haemophilus influenzae disease as reported through the National Notifiable Diseases Surveillance System (NNDSS) has continued to decline. Rates decreased 95% between 1987 and 1993. Data collected by active surveillance from selected sites indicate that the decline is primarily in Haemophilus influenzae type b (Hib) disease among children <5 years of age. This decline is associated with the use of the newly licensed Hib conjugate vaccines. Hepatitis B The reported incidence of hepatitis B decreased 59% from 1985 through 1993. This decline was caused by decreases in the number of cases reported among homosexual men between 1985 and 1989 (61%) and in the number reported among injecting-drug users from 1989 through 1992 (51%). These decreases are thought to result from an increase in AIDS awareness, which has resulted in behavioral changes (e.g., safer sex and needle-using practices). Hepatitis, Non-A, Non-B The steady increase in the number of cases of non-A, non-B hepatitis reported to NNDSS since 1990 is not thought to be caused by an increase in incidence, but rather caused by the screening of blood for the presence of antibody to the hepatitis C virus (anti-HCV, available beginning in May, 1990). Persons testing positive for anti-HCV, regardless of the presence of illness, have been reported as having non-A, non-B hepatitis. Surveillance at sentinel sites has actually shown a steady decrease in the incidence of non- A, non-B hepatitis, with a decline of >50% from 1988 through 1993. This decline is primarily attributable to a 58% decrease in the number of reported cases among injecting-drug users. Legionnaires' Disease Although only 1,280 cases of Legionnaires' disease were reported through NNDSS in 1993, data from recent prospective pneumonia studies suggest that between 10,000 and 15,000 cases occur each year. Lyme Disease In 1993, the number of cases of Lyme disease reported to CDC nationwide decreased by 15% from 1992. Hunterdon, New Jersey meanwhile experienced an increase in reported cases of Lyme disease from 75 cases in 1992 to 206 cases in 1993; upon investigation, the increase in reported cases was found to be due to both increased reporting by physicians and an increase in disease incidence. Malaria In August 1993, three persons without recent bloodborne exposure and who had not recently traveled were diagnosed with Plasmodium falciparum malaria infection in New York City. The results of the epidemiologic investigation suggest local acquisition through mosquito-borne transmission. Measles The total number of measles cases reported to CDC in 1993 -- 312 -- was the lowest number ever recorded in the United States. This reduction in reported measles cases may reflect cyclical changes in measles incidence as well as increases in measles vaccination coverage among preschool-aged children, increased use of a second dose of measles vaccine among school- and college-aged persons, and increased efforts to control measles throughout the Western Hemisphere. Meningococcal disease Several clusters of group C disease were recognized in 1993, resulting in mass vaccinations with meningococcal vaccine. Because approximately one half of severe meningococcal disease in this country is caused by serogroup B and because the vaccine is only effective for disease caused by serogroups A, C, Y, and W, the clusters illustrate the importance of serogroup determination and reporting for all cases of invasive Neisseria meningitidis. Mumps The total number of mumps cases reported in 1993 -- 1,692 -- was the lowest number ever reported in the United States. Pertussis The 6,503 pertussis cases reported in the United States in 1993 represent the highest annual total since 1967. Of 1,347 cases of pertussis among children 7 months to 4 years of age with known vaccination status, 630 (46.8%) had received fewer than three doses of DTP vaccine -- the minimum number of doses necessary for clinical protection. Rubella The total number of rubella cases reported to the CDC remained low in 1993 (N=192), although the number increased by 19% over the record low number of cases reported in 1992. Sexually Transmitted Diseases Nationally, the rates for gonorrhea and primary and secondary syphilis have declined since 1990, reaching low points in 1993 that were below or approaching the Year 2000 Objectives (1) (greater than or equal to 225 cases gonorrhea and greater than or equal to 10 cases primary and secondary syphilis per 100,000 persons). However, rates for both diseases remained higher than the Year 2000 Objectives for certain population subgroups: adolescents and young adults, minorities (especially blacks), and persons living in the southern United States. Shigella The number of cases of Shigella reported through NNDSS increased 35% from 1992 to 1993, with increases of 27%-405% reported from nine states. This increase was also reported through the national Shigella surveillance system, which receives reports of laboratory isolates of Shigella through the Public Health Laboratory Information System (PHLIS); 91% of Shigella isolates reported through PHLIS in 1993 were Shigella sonnei. Tuberculosis Between 1992 and 1993, the number of reported tuberculosis (TB) cases in the United States decreased from 26,673 to 25,313. This decrease may be associated with the effectiveness of prevention and control measures imple- mented during the period 1989-1993. However, two other factors also may be responsible for the decrease, including a) delayed reporting caused by use of the new TB surveillance reporting form and the change from paper records to a computerized system and b) underreporting because of modification of the AIDS surveillance case definition in January 1993. EMERGING INFECTIONS NOTE: The term "emerging infectious diseases" refers to those "infectious diseases whose incidence in humans has increased within the past two decades or threatens to increase in the near future" (2). These can be new or previously unrecognized infectious diseases, reemerging diseases, or infec- tious diseases that have developed resistance to previously effective anti- microbial drugs. Coccidioidomycosis The outbreak of coccidioidomycosis in California that began in 1991 continued in 1993. From an annual average number of 428 cases reported per year in California during the period 1981-1990, 1,200 cases were reported in 1991, 4,516 in 1992, and4,137 in 1993, 70% of which were reported from Kern County in central California. Key factors that may be associated with the ongoing outbreak include weather conditions that are conducive to the growth and spread of Coccidioides immitis (e.g., protracted drought followed by heavy rains), activities that disturb the soil and facilitate airborne spread of the organism, and an increasing population of persons who are susceptible to the organism because of migration from areas where coccidoidomycosis is not endemic. Cryptosporidiosis In spring 1993, a municipal water supply in Milwaukee, Wisconsin, contaminated with Cryptosporidium caused the largest recognized outbreak of waterborne illness in the history of the United States. More than 400,000 persons became ill, 4,400 of whom required hospitalization. Escherichia coli O157:H7 In 1993, an outbreak of E. coli O157:H7 affected more than 500 people in four western states, resulting in 56 cases of hemolytic uremic syndrome and four deaths. Because of this outbreak, many clinical laboratories began screening stool samples for E. coli O157:H7, which resulted in the identifi- cation of many more cases and outbreaks. In May 1993, the Council of State and Territorial Epidemiologists (CSTE) passed a resolution recommending that E. coli O157:H7 infection be made reportable by all states and territories. Group A Streptococcal Disease During 1993, CDC surveillance for invasive group A streptococcal infec- tions consisted of a passive nationwide surveillance system. This system operated through the collection of isolates from normally sterile sites and the collection of case reports. Although current data on incidence and trends for invasive disease, streptococcal toxic shock syndrome, and necrotizing fasciitis are not available, population-based active surveillance for these infections has begun in several geographic areas and will be expanded in 1994 as part of surveillance for emerging infectious diseases. Hantavirus Pulmonary Syndrome Hantavirus Pulmonary Syndrome (HPS), a newly recognized illness charac- terized by an influenza-like prodrome followed by the acute onset of respira- tory failure, was first identified in the southwestern United States in June 1993 during the investigation of a cluster of unexplained deaths. A new hantavirus (Sin Nombre virus) and a rodent reservoir for the virus (the deer mouse {Peromyscus maniculatus}) were identified. As of August 31, 1994, national surveillance for HPS, initiated by CDC in coordination with CSTE, has identified 91 confirmed cases of HPS (with 48 deaths) in 20 states (case fatality rate: 53%). Drug-Resistant Pneumococcus The increasing incidence of drug-resistant Streptococcus pneumoniae (DRSP) strains in the United States has created an emerging public health challenge. CDC surveillance data from 1992 indicated that the prevalence of pneumococcal strains that are highly resistant to penicillin increased 60- fold (from 0.02% to 1.3%) when compared with the prevalence of isolates collected from 1979 through 1987. CDC, CSTE, and the infectious diseases and microbiology communities are developingrecommendations for the surveillance of DRSP infections. This surveillance data will be used to determine optimal empiric treatment regimens for pneumococcal infections. Vancomycin-Resistant Enterococci (VRE) From 1989 through 1993, the percentage of nosocomial enterococci resis- tant to vancomycin reported from hospitals participating in the National Nosocomial Infections Surveillance System increased from 0.3% to 7.9%. During this period, numerous VRE outbreaks (occurring primarily among immunocom- promised patients) were reported. Because of the public health importance of the emergence of VRE, CDC has published draft Guidelines for Preventing the Spread of Vancomycin Resistance and is conducting studies to assess the effectiveness of these guidelines in preventing disease transmission. References
Bibliography General Benenson AS. Control of communicable diseases in man. 15th ed. Washington, DC: American Public Health Association, 1990. CDC. Case definitions for public health surveillance. MMWR 1990;39(No. RR-13). CDC. Mandatory reporting of infectious diseases by clinicians, and mandatory reporting of occupational diseases by clinicians. MMWR 1990;39(No. RR-9). CDC. National electronic telecommunications system for surveillance -- United States, 1990-1991. MMWR 1991;40:502. CDC. Update: graphic method for presentation of notifiable disease data -- United States, 1991. MMWR 1991;40:124-5. CDC. Use of race and ethnicity in public health surveillance. MMWR 1993;42 (No. RR-10). CDC. Update: changes in notifiable disease surveillance data -- United States, 1992-1993. MMWR 42(42):824-6. CDC. Sexually transmitted disease surveillance, 1993. Atlanta: US Department of Health and Human Services, Public Health Service, 1994. Stroup DF, Wharton M, Kafadar K, Dean AG. An evaluation of a method for detecting aberrations in public health surveillance data. Am J Epidemiol 1993;137(3):373-80. Teutsch SM, Churchill RE, eds. Principles and practice of public health surveillance. New York: Oxford University Press, 1994. Thacker SB, Choi K, Brachman PS. The surveillance of infectious diseases. JAMA 1983;249:1181-5. AIDS CDC. 1993 revised classification for HIV infection and expanded surveillance case definition for AIDS among adolescents and adults. MMWR 1992;41(No. RR-17):1-19. CDC. Heterosexually acquired AIDS -- United States, 1993. MMWR 1994;43(9): 155-60. CDC. Update: impact of the expanded AIDS case definition for adolescents and adults on case reporting -- United States, 1993. MMWR 1993;43(9):160-70. CDC. Recommendations of the U.S. Public Health Service Task Force on the use of zidovudine to reduce perinatal transmission of human immunodeficiency virus. MMWR 1994;43(No. RR-11):1-20. Amebiasis Katzenstein DA. Drug treatment of amebiasis. In: Peterson PK, Verhoef J, eds. Antimicrobial agents annual 2. New York: Elsevier Science Publishers, 1987:247-52. McAuley JB, Herwaldt BL, Stokes SL, et al. Diloxanide furoate for treating asymptomatic Entamoeba histolytica cyst passers: 14 years' experience in the United States. Clin Infect Dis 1992;15:464-8. Ravdin JI (ed.). Amebiasis: human infection by Entamoeba histolytica. New York: John Wiley and Sons, Inc., 1988. Anthrax Brachman PS. Anthrax. In: Hoeprich PD, Jordan MC, Roland AR, eds. Infectious diseases. 5th ed. Philadelphia: JB Lippincott Co., 1994;1003-8. Arboviral Infections (St. Louis encephalitis, Eastern equine encephalitis, Western equine encepha- litis, and California serogroup viruses) CDC. Arbovirus diseases -- United States, 1993. MMWR 1994;43(21):385-7. CDC. Arboviral surveillance -- United States, 1990. MMWR 1990;39(35):593-8. Tsai TF. Arboviral infections in the United States. Infect Dis Clin North Am 1991;5:73-102. Aseptic Meningitis CDC. Aseptic meningitis -- New York State and United States, weeks 1-36, 1991. MMWR 1991;40(45):773-5. Moore M. Enteroviral disease in the United States, 1970-1979. J Infect Dis 1982;146:103-8. Morens DM, Zweighaft RM, Bryan JA. Nonpolio enterovirus disease in the United States, 1971-1975. Int J Epidemiol 1979;8:49-54. Wilfert CM, Lehrman SN, Katz SL. Enteroviruses and meningitis. Pediatr Infect Dis J 1983;2:333-41. Botulism St. Louis ME. Botulism. In: Evans AS, Brachman PS, eds. Bacterial infections of humans: epidemiology and control. 2nd ed. New York and London: Plenum Medical Book Co., 1991;115-31. St. Louis ME, Peck SHS, Bowering D, et al. Botulism from chopped garlic: delayed recognition of a major outbreak. Ann Intern Med 1988;108:363-8. Woodruff BA, Griffin PM, McCroskey LM, et al. Clinical and laboratory compar- ison of botulism from toxin types A, B, and E in the United States 1975-1988. J Infect Dis 1992;166:1281-6. Brucellosis Kaufmann AF, Fox MD, Boyce JM, et al. Airborne spread of brucellosis. Ann NY Acad Sci 1980;353:105-14. Staskiewicz J, Lewis CM, Colville J, Zervos M, Band J. Outbreak of Brucella melitensis among microbiology laboratory workers in a community hospital. J Clin Microbiol 1991;29:287-90. Young EJ. Human brucellosis. Rev Infect Dis 1983;5:821-42. Chancroid CDC. Chancroid in the United States, 1981-1990: evidence for underreporting of cases. MMWR 1992;41(No. SS-3):57-61. Schmid GP. Chancroid. In: Evans AS, Brachman PS, eds. Bacterial infections of humans: epidemiology and control. 2nd ed. New York: Plenum Medical Book Company, 1991;173-8. Schmid GP. Chancroid and granuloma inguinale. In: Kelley WB, ed. Textbook of internal medicine. 2nd ed. Philadelphia: JB Lippincott Co, 1991:1412-4. Cholera Blake PA. Epidemiology of cholera in the Americas. Gastroenterol clin North Am 1993;22:639-60. Swerdlow DL, Ries AA. Vibrio cholerae non-01 -- the eighth pandemic? Lancet 1993;342:382-3. Wachsmuth IK, Blake PA, Olsvik O, eds. Vibrio cholerae and cholera: molecular to global perspectives. Washington, DC: American Society for Microbiol- ogy, 1994. World Health Organization. Guidelines for cholera control. Geneva: World Health Organization, 1993. Congenital Syphilis CDC. Surveillance for geographic and secular trends in congenital syphilis -- United States, 1983-1991. MMWR 1993;42(No. SS-6):59-71. Zenker PN. Syphilis. In: Schdlower M, Shafer M-A, eds. Adolescent medicine: state of the art reviews. Philadelphia: Hanley and Belfus, Inc., 1990;1: 511-29. Zenker P. Congenital syphilis reporting (from the CDC). Sex Transm Dis 1991;18:44-54. Zenker PN, Berman SM. Congenital syphilis: trends and recommendations for evaluation and management. Pediatr Infect Dis J 1991;10(7):516-22. Diphtheria CDC. Diphtheria outbreak -- Russian Federation, 1990-1993. MMWR 1993;42: 840-1,847. Chen RT, Broome CV, Weinstein RA, Weaver R, Tsai TF. Diphtheria in the United States, 1971-81. Am J Public Health 1985;75:1393-7. Farizo KM, Strebel PM, Chen RT, Kimbler A, Cleary TJ, Cochi SL. Fatal respi- ratory disease due to Corynebacterium diphtheriae: case report and review of guidelines for management, investigation, and control. Clin Infect Dis 1993;16:59-68. Gonorrhea CDC. Plasmid-mediated antimicrobial resistance in Neisseria gonorrhoeae -- U.S. 1988 and 1989. MMWR 1990;39(17):284-7,293. CDC. Special focus: surveillance for sexually transmitted diseases. MMWR 1993;42(No. SS-3): 1-11,29-39. Gershman KA, Rolfs RT. Diverging gonorrhea and syphilis trends in the 1980s: are they real? Am J Public Health 1991;81(10):1263-7. Granuloma Inguinale Schmid GP. Chancroid and granuloma inguinale. In: Kelley WB, ed. Textbook of internal medicine. 2nd ed. Philadelphia: JB Lippincott Co, 1989:1555-6. Haemophilus influenzae Adams WG, Deaver KA, Cochi SL, et al. Decline of childhood Haemophilus influenzae type b (Hib) disease in the Hib vaccine era. JAMA 1993;269: 221-6. CDC. Recommendations for use of Haemophilus b conjugage vaccines and a combined diphtheria, tetanus, pertussis, and Haemophilus b vaccine: recommendations of the Advisory Committee on Immunization Practices (ACIP). MMWR 1993;42(No. RR-13). CDC. Progress toward elimination of Haemophilus influenzae type b disease among infants and children -- United States, 1987-1993. MMWR 1994;43(8): 144-8. Hansen Disease (Leprosy) Meyer WM. Leprosy. In: Strickland GT. Hunter's tropical medicine. WB Saunders, 1991:483-94. Neill MA, Hightower AW, Broome CV. Leprosy in the United States 1971-1981. J Infect Dis 1985;152:1064-9. Noordeen SK, Bravo LL, Sundaresan TK. Estimated number of leprosy cases in the world. Bull World Health Organ 1992;70(1):7-10. Hepatitis Alter MJ, Mares A, Hadler SC, Maynard JE. The effect of underreporting on the apparent incidence and epidemiology of acute viral hepatitis. Am J Epidemiol 1987;125:133-9. CDC. Hepatitis surveillance report no. 55. Atlanta: US Department of Health and Human Services, Public Health Service, 1994. Hepatitis A Shapiro CN, Coleman PJ, McQuillan GM, et al. Epidemiology of Hepatitis A: seroepidemiology and risk groups in the U.S.A. Vaccine 1992;10(suppl 1):S59-62. Hepatitis B Margolis HS, Alter MJ, Hadler SC. Hepatitis B: evolving epidemiology and implications for control. Semin Liver Dis 1991;11:84-92. Hepatitis Non-A, Non-B Alter MJ, Hadler SC, Judson FN, et al. Risk factors for acute non-A, non-B hepatitis in the United States and association with hepatitis C virus infection. JAMA 1990;264:2231-5. Alter MJ, Margolis HS, Krawczynski K, et al. The natural history of communi- ty-acquired hepatitis C in the United States. New Engl J Med 1992;327: 1899-1905. Legionellosis CDC. Legionnaires' disease associated with cooling towers -- Massachusetts, Michigan, and Rhode Island, 1993. MMWR 1994;43(27):491-9. Edelstein PH. Legionnaires' disease. Clin Infect Dis 1993;16:741-9. Hoge CW, Breiman RF. Advances in the epidemiology and control of Legionella infections. Epidemiol Rev 1991;13:329-40. World Health Organization. Epidemiology, prevention and control of legionel- losis: memorandum from a WHO meeting. Bull World Health Organ 1990;68: 155-64. Leptospirosis Anderson DC, Folland DS, Fox MD, Patton CM, Kaufmann AF. Leptospirosis: a common-source outbreak due to leptospires of the Grippotyphosa serogroup. Am J Epidemiol 1978;107:538-44. Faine S. Guidelines for the control of leptospirosis. Geneva, Switzerland: World Health Organization, 1982. Takafuji ET, Kirkpatrick JW, Miller RN, et al. An efficacy trial of doxycy- cline chemoprophylaxis against leptospirosis. N Engl J Med 1984;310: 497-500. Lyme Disease CDC. Lyme disease surveillance -- United States, 1993. MMWR 1994;43(31): 564-5,571-2. Kalish R. Lyme disease. Rheum Dis Clin North Am 1993;19:399-426. Steere AC. Lyme disease. N Engl J Med 1989;321:586-96. Lymphogranuloma venereum Perine PL, Osoba AO. Lymphogranuloma venereum. In: Holmes KK, Mardh PA, Sparling PF, et al. eds. Sexually transmitted disease. New York: McGraw- Hill, 1990:195-204. Malaria CDC. Health information for international travel 1994. Atlanta: CDC, 1994: HHS publication no. (CDC) 94-8280. Lobel HO, Miani M, Eng T, Bernard KW, Hightower AW, Campbell CC. Long-term malaria prophylaxis with weekly mefloquine. Lancet 1993;341:848-51. Zucker JR, Campbell CC. Malaria: principles of prevention and treatment. Infect Dis Clin North Am 1993;7:547-67. Measles CDC. Measles prevention: recommendations of the Immunization Practices Advisory Committee. MMWR 1989;38(No. SS-9):1-18. CDC. Measles -- United States, first 26 weeks, 1993. MMWR 1993;42:813-6. CDC. Absence of reported measles -- United States, November 1993. MMWR 1993;42:925-6. Meningococcal Disease CDC. Meningococcal vaccines. MMWR 1985;34(18):255-9. CDC. Laboratory-based surveillance for meningococcal disease in selected areas -- United States, 1989-1991. MMWR 1993;42(No. SS-2):21-30. Schwartz B, Moore PS, Broome CV. Global epidemiology of meningococcal dis- ease. Clin Microbiol Rev 1989;2(suppl):S118-24. Wenger JD, Jackson LA, Raj P, Tonelli MJ. Issues in the control of outbreaks of group C meningococcal disease in the U.S. Infect Dis Clin Prac 1994; 3:136-40. Mumps Briss PA, Fehrs LJ, Parker RA, et al. Sustained transmission of mumps in a highly vaccinated population: assessment of primary vaccine failure and waning vaccine-induced immunity. J Infect Dis 1994;169:77-82. CDC. Mumps prevention. MMWR 1989;38(22):388-92,397-400. CDC. Mumps -- United States, 1985-1988. MMWR 1989;38(7):101-5. Hersch BS, Fine PEM, Kent WK, et al. Mumps outbreak in a highly vaccinated population. J Pediatr 1991;119:187-93. Murine Typhus Fever Benenson AS. Control of communicable diseases in man. 15th ed. Washington, DC: American Public Health Association, 1990. McDade JE, Fishbein DB. Rickettsiaceae: the rickettsiae. In: Laboratory diagnosis of infectious diseases: principles and practice. Vol II. Viral, rickettsial, and chlamydial diseases. New York: Springer-Verlag, 1988: 864-89. Woodward TE. Murine typhus fever: its clinical and biologic similarity of epidemic typhus. In: Biology of rickettsial disease. Vol II. Boca Raton, Florida: CRC Press, 1988:79-92. Pertussis CDC. Pertussis surveillance -- United States, 1989-1991. MMWR 1992;41(No. SS-8):11-9. Cherry JD, Brunell PA, Golden GS, et al. Report of the Task Force on Pertus- sis and Pertussis Immunization, 1988. Pediatrics 1988;81(suppl):S939-84. Strebel PM, Cochi SL, Farizo KM, et al. Pertussis in Missouri: evaluation of nasopharyngeal culture, direct fluorescent antibody testing and clinical case definitions in the diagnosis of pertussis. Clin Infect Dis 1993;16: 276-85. Plague Craven RB, Barnes AM. Plague and tularemia. Infect Dis Clin North Am 1991;5: 165-75. Poland JD. Plague. In: Hoeprich PD, ed. Infectious Diseases. 2nd ed. New York: Harper and Row, 1989:151;1296-1306. Poliomyelitis CDC. Poliomyelitis -- United States, 1975-1984. MMWR 1986;35(11):180-2. Prevots DR, Suter RW, Strebel PM, Weibel RE, Cochi SL. Completeness of reporting for paralytic poliomyelitis, United States, 1980 through 1991. Archives of Pediatrics and Adolescent Medicine 1994;148:479-85. Strebel PM, Sutter RW, Cochi SL, et al. Epidemiology of poliomyelitis in the United States: one decade after the last reported case of indigenous wild virus-associated disease. Clin Infect Dis 1992;14:568-79. Psittacosis Anonymous. Compendium of chlamydiosis (psitticosis) control, 1994. National Association of State Public Health Veterinarians, Inc. J Am Vet Med Assoc 1993;203:1673-80. Barnes RC. Laboratory diagnosis of human chlamydial infections. Clin Micro- biol Rev 1989;2:119-36. Kuritsky JN, Schmid GP, Potter ME, Anderson DC, Kaufmann AF. Psittacosis: a diagnostic challenge. J Occup Med 1984;26:731-3. Rabies Baer G. Natural history of rabies. 2nd ed. Boca Raton, Florida: CRC press, 1991. CDC. Compendium of animal rabies control, 1994. MMWR 1994;43(No. RR-10). CDC. Rabies prevention -- United States, 1991: recommendations of the Immuni- zation Practices Advisory Committee (ACIP). MMWR 1991;40(No. RR-3). Krebs JW, Strine TW, Childs JE. Rabies surveillance in the United States during 1992. J Am Vet Med Assoc 1993;203:1718-31. Rheumatic Fever Dajani AS. Prevention of rheumatic fever: a statement for health profession- als by the Committee on Rheumatic Fever, Endocarditis, and Kawasaki Disease of the Council on Cardiovascular Disease in the Young, the American Heart Association. Pediatr Infect Dis J 1989;8:263-6. Kaplan EL, Johnson DR, Cleary PP. Group A streptococcal serotypes isolated from patients and sibling contacts during the resurgence of rheumatic fever in the United States in the mid-1980's. J Infect Dis 1989;1259: 101-3. Veasy GL, Wiedmeier SE, Orsmond GS, et al. Resurgence of acute rheumatic fever in the intermountain area in the United States. N Engl J Med 1987;316:421-8. Rocky Mountain Spotted Fever (RMSF) Burgdorfer W, Anacker FL, eds. Rickettsiae and Rickettsial Diseases. New York: Academic Press, 1981. McDade JE, Fishbein DB. Rickettsiaceae: the rickettsiae. In: Laboratory diagnosis of infectious diseases: principles and practice. Vol II. Viral, rickettsial, and chlamydial diseases. New York: Springer-Verlag, 1988: 864-89. Rubella CDC. Increase in rubella and congenital rubella syndrome -- United States, 1988-1990. MMWR 1991;40(6):93-9. CDC. Rubella and congenital rubella syndrome -- United States, January 1, 1991-May 7, 1994. MMWR 1994;43(21):391,397-401. CDC. Outbreaks of rubella among the Amish -- United States, 1991. MMWR 1991;40(16):264. CDC. Congenital rubella syndrome among the Amish -- Pennsylvania, 1991-1992. MMWR 1992;41(26):468-9,475-6. CDC. Rubella prevention: recommendations of the Immunization Practices Advisory Committee (ACIP). MMWR 1990;39(No. RR-15). Lindegren ML, Fehrs LJ, Hadler SC, Hinman AR. Update: rubella and congenital rubella syndrome, 1980-1990. Epidemiol Rev 1991;13:341-8. Salmonellosis Lee LA, Puhr ND, Maloney EK, Bean NH, Tauxe RV. Increase in antimicrobial- resistant Salmonella infections in the United States, 1989-1990. J Infect Dis 1994;170:128-34. Mishu B, Griffin PM, Tauxe RV, Cameron DN, Hutcheson RH, Schaffner W. Salmo- nella enteritidis gastroenteritis transmitted by intact chicken eggs. Ann Intern Med 1991;115:190-4. St. Louis ME, Morse DL, Potter ME, et al. The emergence of grade A eggs as a major source of Salmonella enteritidis infections: new implications for the control of salmonellosis. JAMA 1988;259:2103-7. Tauxe RV. Salmonella : a postmodern pathogen. Journal of Food Protection 1991;54:563-8. Shigellosis Lee LA, Shapiro CN, Hargrett-Bean N, Tauxe RV. Hyperendemic shigellosis in the United States: a review of surveillance data for 1967-1988. J Infect Dis 1991;164:894-900. Parsonnet J, Greene KD, Gerber AR, et al. Shigella dysenteriae type 1 infec- tions in U.S. travellers to Mexico. Lancet 1989:543-5. Ries AA, Wells JG, Olivola D, et al. Epidemic Shigella dysenteriae type 1 in Burundi: panresistance and implications for prevention. J Infect Dis 1994;169:1035-41. Syphilis Aral SO, Wasserheit JN, Green SB, Judson FN, Sparling FP. The NIAID/NIH working group on integrated behavioral research for prevention and control of STDs. Part III: Issues in evaluating behavioral interventions. Sex Transm Dis 1990;17:208-10. CDC. Primary and secondary syphilis -- United States, 1981-1990. MMWR 1991; 40(19):314-5,321-3. CDC. Regional and temporal trends in the surveillance of syphilis, United States, 1986-1990. MMWR 1991;40(No. SS-3):29-33. CDC. Special focus: surveillance for sexually transmitted diseases. MMWR 1993;42(No. SS-3):13-9. Tetanus CDC. Surveillance of tetanus -- United States, 1989-1990. MMWR 1992;41(No. SS-8):1-9. Sutter RW, Cochi SL, Brink EW, Sirotkin BI. Assessment of vital statistics and surveillance data for monitoring tetanus mortality, United States, 1979-1984. Am J Epidemiol 1990;131:132-42. Toxic Shock Syndrome CDC. Reduced incidence of menstrual toxic shock syndrome -- United States, 1980-1990. MMWR 1990;39(25):421-3. Gaventa S, Reingold AL, Hightower AW, et al. Active surveillance for toxic shock syndrome in the United States, 1986. Rev Infect Dis 1989;(suppl): S28-34. Schuchat A, Broome CV. Toxic shock syndrome and tampons. Epidemiol Rev 1991;13:99-112. Trichinosis Bailey TM, Schantz PM. Trends in the incidence and transmission patterns of human trichinosis in the United States, 1982-1986. Rev Infect Dis 1990; 12:5-11. Campbell WC (ed.). Trichinella and trichinosis. New York: Plenum Press, 1983. CDC. Trichinosis surveillance -- United States, 1987-1990. MMWR 1991;40(No. SS-3):35-42. McAuley JB, Michelson MK, Hightower AW, Engeran S, Wintermeyer LA, Schantz PM. A trichinosis outbreak among Southeast Asian refugees. Am J Epidemiol 1992;135:1404-10. Tuberculosis American Thoracic Society/CDC. Treatment of tuberculosis and tuberculosis infection in adults and children. Am J Respir Crit Care Med 1994;149: 1359-74. CDC. Recommendations for counting reported tuberculosis cases. Atlanta: US Department of Health and Human Services, Public Health Service, 1977. CDC. Expanded tuberculosis surveillance and tuberculosis morbidity -- United States, 1993. MMWR 1994;43(20):361-6. Tularemia Evans ME, Gregory DW, Schaffner W, McGee ZA. Tularemia: a 30 year experience with 88 cases. Medicine 1985;64:251-69. Taylor JP, Istre GR, McChesny TC, Satalowich FT, Parker RE, McFarland LM. Epidemiologic characteristics of human tularemia in the southwest-central states, 1981-1987. Am J Epidemiol 1991;133:1032-8. Typhoid Fever CDC. Typhoid immunization: recommendations of the Immunization Practices Advisory Committee. MMWR 1990;39(No. RR-10). Ryan CA, Hargrett-Bean NT, Blake PA. Salmonella typhi infections in the United States, 1975-1984: increasing role of foreign travel. Rev Infect Dis 1989;II:1-7. Woodruff BA, Pavia AT, Blake PA. A new look at typhoid vaccination: informa- tion for the practicing physician. JAMA 1991;265(6):756-9. Varicella CDC. Varicella outbreak in a women's prison -- Kentucky. MMWR 1989;38(37): 635-6,641-2. Gershon AA, LaRussa P, Hardy I, Steinberg S, Silverstein S. Varicella vac- cine: the American experience. J Infect Dis 1992;166(suppl 1):S63-8. Lieu TA, Cochi SL, Black SB, et al. Cost-effectiveness of a routine varicella vaccination program for U.S. children. JAMA 1994;271:375-81. PART 1: Summaries of Notifiable Diseases in the United States Table_N1 NOTIFIABLE DISEASES -- summary of reported cases, by month, United States, 1993 Table_N2 NOTIFIABLE DISEASES -- reported cases, by geographic division and area, United States, 1993 Table_N3 NOTIFIABLE DISEASES -- summary of reported cases, by age group, United States, 1993 Table_N4 NOTIFIABLE DISEASES -- summary of reported cases, by race, United States, 1993 Table_N5 NOTIFIABLE DISEASES -- summary of reported cases, by ethnici- ty, United States, 1993 PART 2: Graphs and Maps for Selected Notifiable Diseases in the United States Figure_1 ACQUIRED IMMUNODEFICIENCY SYNDROME (AIDS) -- reported cases and known deaths, by year, United States, 1981-1993 Figure_2 ACQUIRED IMMUNODEFICIENCY SYNDROME (AIDS) -- annual rates, by selected age group and sex for reported cases, United States, 1993 Figure_3 ACQUIRED IMMUNODEFICIENCY SYNDROME (AIDS) -- reported pediat- ric cases, United States and Puerto Rico, 1993 Figure_4 ACQUIRED IMMUNODEFICIENCY SYNDROME (AIDS) -- reported cases, per 100,000 population, United States and Puerto Rico, 1993 Figure_5 ACQUIRED IMMUNODEFICIENCY SYNDROME (AIDS) -- reported adult/ adolescent cases among men, by exposure category, United States, 1993 Figure_6 ACQUIRED IMMUNODEFICIENCY SYNDROME (AIDS) -- reported adult/ adolescent cases among women, by exposure category, United States, 1993 Figure_7 ARBOVIRAL INFECTIONS (of the central nervous system) -- cases due to St. Louis encephalitis virus, by month, United States, 1975-1993 Figure_8 ARBOVIRAL INFECTIONS (of the central nervous system) -- cases due to California serogroup viruses, by month, United States, 1975-1993 Figure_9 ARBOVIRAL INFECTIONS (of the central nervous system) -- cases due to Western equine encephalitis virus, by month, United States, 1975-1993 Figure_10 ARBOVIRAL INFECTIONS (of the central nervous system) -- cases due to Eastern equine encephalitis virus, by month, United States, 1975-1993 Figure_11 ASEPTIC MENINGITIS -- by month, United States, 1986-1993 Year Figure_12 AMEBIASIS -- by year, United States, 1955-1993 Figure_13 ASEPTIC MENINGITIS -- reported cases, per 100,000 population, United States and territories, 1993 Figure_14 BOTULISM (infant) -- by year, United States, 1975-1993 Figure_15 BOTULISM (foodborne) -- by year, United States, 1975-1993 Figure_16 BRUCELLOSIS -- by year, United States, 1945-1993 Figure_17 CHOLERA -- reported cases, United States and territories, 1993 Figure_18 DIPHTHERIA -- by year, United States, 1955-1993 Figure_19 ENCEPHALITIS (post-infectious) -- by year, United States, 1984-1993 Figure_20 GONORRHEA -- by sex, United States, 1960-1993 Figure_21 GONORRHEA -- by race and ethnicity, United States, 1981-1993 Figure_22 GONORRHEA -- reported cases, per 100,000 population, United States, 1993 Figure_23 HAEMOPHILUS INFLUENZAE -- reported cases, per 100,000 popula- tion, United States and territories, 1993 Figure_24 HAEMOPHILUS INFLUENZAE -- by age group, United States, 1993 Figure_25 HANSEN DISEASE (leprosy) -- by year, United States, 1955-1993 Figure_26 HEPATITIS -- by year, United States, 1965-1993 Figure_27 HEPATITIS A -- reported cases, per 100,000 population, United States and territories, 1993 Figure_28 HEPATITIS B -- reported cases, per 100,000 population, United States and territories, 1993 Figure_29 LEGIONELLOSIS -- reported cases, per 100,000 population, United States and territories, 1993 Figure_30 LEPTOSPIROSIS -- by year, United States, 1955-1993 Figure_31 LYME DISEASE -- reported cases, per 100,000 population, United States and territories, 1993 Figure_32 MALARIA -- by year, United States, 1930-1993 Figure_33 MEASLES (rubeola) -- by year, United States, 1950-1993 Figure_34 MEASLES (rubeola) -- counties reporting cases, United States, 1993 Figure_35 MENINGOCOCCAL INFECTION -- counties reporting cases, United States, 1993 Figure_36 MENINGOCOCCAL INFECTION -- by year, United States, 1935-1993 Figure_37 MUMPS -- by year, United States, 1968-1993 Figure_38 MURINE TYPHUS FEVER -- by year, United States, 1955-1993 Figure_39 PERTUSSIS (whooping cough) -- by year, United States, 1957- 1993 Figure_40 PERTUSSIS (whooping cough) -- by age group, United States, 1993 Figure_41 PERTUSSIS (whooping cough) -- reported cases, per 100,000 population, United States and territories, 1993 Figure_42 PLAGUE -- among humans, by year, United States, 1955-1993 Figure_43 POLIOMYELITIS (paralytic) -- by year, United States, 1951- 1993 Figure_44 PSITTACOSIS -- by year, United States, 1955-1993 Figure_45 RABIES -- wild and domestic animals, by year, United States and Puerto Rico, 1955-1993 Figure_46 RHEUMATIC FEVER -- reported cases, United States and territo- ries, 1993 Figure_47 ROCKY MOUNTAIN SPOTTED FEVER -- counties reporting cases, United States, 1993 Figure_48 ROCKY MOUNTAIN SPOTTED FEVER -- by year, United States, 1955-1993 Figure_49 RUBELLA (German measles) -- by year, United States, 1966-1993 Figure_50 SALMONELLOSIS (excluding typhoid fever) -- by year, United States, 1955-1993 Figure_51 SHIGELLOSIS -- by year, United States, 1955-1993 Figure_52 SYPHILIS -- by year, United States, 1941-1993 Figure_53 SYPHILIS (primary and secondary) -- reported cases, per 100,000 population, United States, 1993 Figure_54 SYPHILIS (primary and secondary) -- counties with rates above and below the Year 2000 Objective, United States, 1993 Figure_55 SYPHILIS (primary and secondary) -- by race and ethnicity, United States, 1981-1993 Figure_56 SYPHILIS (primary and secondary) -- by sex, United States, 1956-1993 Figure_57 CONGENITAL SYPHILIS -- reported cases in infants <1 year of age and rate of primary and secondary syphilis among women -- United States, 1970-1993 Figure_58 TETANUS -- by year, United States, 1955-1993 Figure_59 TETANUS -- by age group, United States, 1993 Figure_60 TOXIC SHOCK SYNDROME -- by quarter, United States, 1979-1993 Figure_61 TRICHINOSIS -- by year, United States, 1950-1993 Figure_62 TUBERCULOSIS -- rates by state, United States, 1993 Figure_63 TUBERCULOSIS -- percentage of cases, by race and ethnicity, United States, 1993 Figure_64 TUBERCULOSIS - by year, United States, 1975-1993 Figure_65 TUBERCULOSIS -- frequency distribution of cases by age, race, and ethnicity, United States, 1993 Figure_66 TUBERCULOSIS -- cases, among foreign-born persons and persons born in the United Sates, 1993 Figure_67 TULAREMIA -- by year, United States, 1955-1993 Figure_68 TULAREMIA -- counties reporting cases, United States, 1993 Figure_69 TYPHOID FEVER -- by year, United States, 1955-1993 Figure_70 VARICELLA (chickenpox) -- by month, United States, 1986-1993 PART 3: Historical Summary Tables TABLE_1 NOTIFIABLE DISEASES -- summary of reported cases, United States, 1984-1993 TABLE_2 NOTIFIABLE DISEASES -- summary of reported cases, per 100,000 population, United States, 1984-1993 TABLE_3 NOTIFIABLE DISEASES -- summary of reported cases, United States, 1974-1983 TABLE_4 NOTIFIABLE DISEASES -- summary of reported cases, United States, 1964-1973 TABLE_5 NOTIFIABLE DISEASES -- summary of reported cases, United States, 1954-1963 TABLE_6 NOTIFIABLE DISEASES -- summary of reported cases, United States, 1944-1953 TABLE_7 NOTIFIABLE DISEASES -- deaths from specified notifiable diseases, United States, 1982-1991
NOTIFIABLE DISEASES -- summary of reported cases, by month, United States, 1993
===========================================================================================================================================================================================
Disease Total Jan. Feb. Mar. Apr. May June July Aug. Sept. Oct. Nov. Dec. Unk.
-------------------------------------------------------------------------------------------------------------------------------------------------------------------------------
AIDS * 103,691 7,153 7,222 21,244 6,725 10,081 8,254 7,597 8,524 9,176 5,072 5,797 6,846 -
Amebiasis 2,970 144 198 202 211 218 228 284 313 272 310 245 345 -
Anthrax - - - - - - - - - - - - - -
Aseptic meningitis 12,848 519 532 502 478 698 739 1,569 1,891 1,797 1,909 1,005 1,209 -
Botulism, total 97 6 5 4 5 6 6 11 11 8 16 10 9 -
Brucellosis 120 4 6 6 7 8 6 12 8 3 11 7 42 -
Chancroid + 1,399 ..............401.......... ..............469.......... ..............229.......... ..............300.......... -
Cholera 18 5 3 1 3 2 - 2 - 1 1 - - -
Diphtheria - - - - - - - - - - - - - -
Encephalitis, primary infections 919 43 49 45 33 53 45 84 93 158 152 72 92 -
Post-infectious 170 7 20 16 14 17 17 13 15 9 10 14 18 -
Gonorrhea + 439,673 ..........103,178.......... ..........102,890.......... ..........120,498.......... ..........113,107.......... -
Granuloma inguinale + 19 ...............15.......... ................4.......... ................-.......... ................-.......... -
Haemophilus influenzae 1,419 99 104 149 97 141 100 105 68 78 126 155 197 -
Hansen disease (leprosy) 187 11 9 20 17 27 10 8 18 14 30 11 12 -
Hepatitis A 24,238 1,739 1,718 1,985 1,739 2,104 1,678 2,132 1,661 1,838 2,535 1,916 3,193 -
Hepatitis B 13,361 772 918 1,000 1,038 1,311 999 1,191 994 1,003 1,207 1,036 1,892 -
Hepatitis, non-A , non-B & 4,786 272 354 337 293 383 301 347 340 364 496 384 915 -
Hepatitis, unspecified 627 44 47 52 43 77 34 61 40 55 49 39 86 -
Legionellosis 1,280 110 81 88 77 112 86 104 107 104 155 88 168 -
Leptospirosis 51 1 8 1 1 3 2 4 7 5 3 8 8 -
Lyme disease 8,257 175 310 323 234 433 524 1,474 1,156 845 840 738 1,205 -
Lymphogranuloma venereum + 285 ...............69.......... ...............73.......... ...............71 ......... ...............72.......... -
Malaria 1,411 51 69 74 118 77 98 144 154 124 200 110 192 -
Measles (rubeola) 312 17 41 27 11 28 72 28 24 17 26 9 12 -
Meningococcal infections 2,637 155 211 311 251 273 180 204 109 121 202 160 460 -
Mumps 1,692 101 132 169 144 186 191 120 80 97 138 126 208 -
Murine typhus fever 25 - - 1 - 3 - 5 - 4 4 4 4 -
Pertussis (whooping cough) 6,586 214 236 202 239 298 329 777 876 988 1,061 469 897 -
Plague 10 - - 1 - 2 - 1 4 - 2 - - -
Poliomyelitis, paralytic @ 3 - - - - - - 1 1 - - - 1
Psittacosis 60 3 7 4 3 8 6 5 7 4 1 7 5 -
Rabies, animal 9,377 408 512 649 801 994 724 876 930 899 1,001 713 870 -
Rabies, human 3 - - - - - - - 1 - - - 2 -
Rheumatic fever, acute 112 5 16 12 4 10 28 13 7 1 3 4 9 -
Rocky Mountain spotted fever 456 9 3 3 3 16 38 90 95 69 74 24 32 -
Rubella (German measles) 192 10 8 25 15 30 20 30 19 7 5 6 17 -
Rubella, congenital syndrome 5 1 1 - 2 - - 1 - - - - - -
Salmonellosis 41,641 1,909 2,099 2,196 2,188 3,131 3,256 4,819 5,119 4,367 4,980 3,164 4,413 -
Shigellosis 32,198 1,224 1,554 1,507 1,572 2,511 2,799 3,494 3,665 3,060 4,005 2,725 4,082 -
Syphilis, total all stages + 101,259 ...........25,621.......... ...........26,942.......... ...........24,692.......... ...........24,004.......... -
Primary and secondary + 26,498 ............6,952.......... ............6,684.......... ............6,621.......... ............6,241.......... -
Congenital <1 year + 3,211 ..............678.......... ..............834.......... ..............864.......... ..............835.......... -
Tetanus 48 1 1 1 3 5 5 4 7 5 4 3 9 -
Toxic-shock syndrome 212 7 21 26 23 16 15 19 25 23 15 6 16 -
Trichinosis 16 1 3 3 - - 1 - 2 - 2 1 3 -
Tuberculosis 25,313 778 1,322 1,881 2,105 1,979 2,371 2,003 2,009 1,938 2,028 1,769 5,130 -
Tularemia 132 3 5 4 3 13 20 24 21 12 12 2 13 -
Typhoid fever 440 26 24 26 25 40 26 46 38 46 62 30 51 -
Varicella (chickenpox) 134,722 12,815 15,322 18,553 17,373 23,933 13,866 5,129 3,093 2,534 4,038 6,536 11,530
-------------------------------------------------------------------------------------------------------------------------------------------------------------------------------
* AIDS total updated through December 31, 1993. & The number of reported cases of non-A, non-B hepatitis is misleading because in some states, reported cases
+ Cases updated through Feburary 28, 1994. included persons positive for antibody to hepatitis C virus (anti-HCV) identified in routine screening programs but
who did not have acute hepatitis.
@ Subject to change due to retrospective case evaluations or late reports.
===========================================================================================================================================================================================
Return to top. Table_N2 Note: To print large tables and graphs users may have to change their printer settings to landscape and use a small font size.
NOTIFIABLE DISEASES -- reported cases, by geographic division and area, United States,
1993 (Page 1)
----------------------------------------------------------------------------------------------------------------------
Total resident Botulism
population Aseptic -------------------------- Brucel-
Area (in thousands) AIDS Amebiasis Anthrax meningitis Foodborne Infant Other losis
----------------------------------------------------------------------------------------------------------------------
United States 257,908 103,691 * 2,970 - 12,848 27 65 5 + 120
New England 13,230 5,156 112 - 425 - - - 1
Maine 1,239 149 11 - 41 - - - -
N.H. 1,125 124 5 - 55 - - - -
Vt. 576 74 7 - 45 - - - -
Mass. 6,012 2,703 87 - 177 - - - 1
R.I. 1,000 348 2 - 107 - - - -
Conn. 3,277 1,758 NN - NN - - - -
Mid. Atlantic 38,125 26,115 619 - 1,133 - 8 1 3
N.Y. (excl. NYC) 10,921 3,565 116 - 575 - - - 1
N.Y.C. 7,276 13,902 457 - 257 - 2 1 -
N.J. 7,879 5,434 16 - NN - 3 - 1
Pa. 12,048 3,214 30 - 301 - 3 - 1
E.N. Central 43,017 8,069 208 - 2,234 - 6 1 10
Ohio 11,091 1,585 18 - 720 - 5 1 1
Ind. 5,713 954 25 - 244 - 1 - -
Ill. 11,697 2,959 50 - 562 - - - 6
Mich. 9,478 1,840 48 - 643 - - - 1
Wis. 5,038 731 67 - 65 - - - 2
W.N. Central 18,054 3,181 173 - 817 - - - 3
Minn. 4,517 659 58 - 118 - - - -
Iowa 2,814 202 31 - 159 - - - 2
Mo. 5,234 1,745 54 - 275 - - - -
N. Dak. 635 11 3 - 20 - - - -
S. Dak. 715 29 1 - 22 - - - 1
Nebr. 1,607 179 4 - 21 - - - -
Kans. 2,531 356 22 - 202 - - - -
S. Atlantic 45,738 22,783 198 - 2,645 6 2 - 36
Del. 700 375 2 - 70 - 1 - -
Md. 4,965 2,528 9 - 220 - - - -
D.C. 578 1,585 - - 37 - - - -
Va. 6,491 1,625 34 - 343 - - - -
W. Va. 1,820 106 2 - 56 - - - -
N.C. 6,945 1,368 11 - 273 - - - 27
S.C. 3,643 1,476 NN - 35 - - - -
Ga. 6,917 2,789 90 - 173 5 1 - 5
Fla. 13,679 10,931 50 - 1,438 1 - - 4
E.S. Central 15,717 2,720 7 - 774 2 4 - 1
Ky. 3,789 323 1 - 335 1 1 - -
Tenn. 5,099 1,203 NN - 166 1 - - -
Ala. 4,187 733 1 - 192 - - - 1
Miss. 2,643 461 5 - 81 - 3 - -
W.S. Central 27,983 10,136 102 - 1,500 - 3 - 40
Ark. 2,424 404 4 - 79 - 1 - 3
La. 4,295 1,464 5 - 91 - - - 2
Okla. 3,231 725 7 - 1 - - - 1
Tex. 18,031 7,543 86 - 1,329 - 2 - 34
Mountain 14,776 3,913 177 - 732 3 4 - 6
Mont. 839 32 - - 1 - - - -
Idaho 1,099 77 7 - 11 - 2 - -
Wyo. 470 46 3 - 8 1 - - -
Colo. 3,566 1,324 66 - 240 1 - - 3
N. Mex. 1,616 294 21 - 115 - - - 1
Ariz. 3,936 1,238 70 - 202 - 1 - 2
Utah 1,860 264 4 - 74 1 1 - -
Nev. 1,389 638 6 - 81 - - - -
Pacific 41,269 21,460 1,374 - 2,588 16 38 3 20
Wash. 5,255 1,564 49 - NN 4 5 - -
Oreg. 3,032 778 95 - NN - 2 - -
Calif. 31,211 18,689 1,193 - 2,428 3 29 3 19
Alaska 599 70 6 - 23 9 - - -
Hawaii 1,172 359 31 - 137 - 2 - 1
----------------------------------------------------------------------------------------------------------------------
Guam 133 2 - - 7 - - - -
P.R. 3,522 3,199 - - 72 - - - -
V.I. 102 57 - - - - - - -
C.N.M.I. 43 - - - 2 - - - -
American Samoa 47 - - - - - - - -
----------------------------------------------------------------------------------------------------------------------
* Total reported through December 31, 1993. Total includes 158 cases with unknown state of residence.
+ Includes wound and unspecified botulism.
====================================================================================================================================
NOTIFIABLE DISEASES -- reported cases, by geographic division and area, United States,
1993 (Page 2)
---------------------------------------------------------------------------------------------------------------------------------
Encephalitis
----------------------- Hansen
Primary Post- Gonor- Granuloma Haemophilus disease
Area Chancroid Cholera Diphtheria infections infectious rhea inguinale influenzae (leprosy)
---------------------------------------------------------------------------------------------------------------------------------
UNITED STATES 1,399 * 18 - 919 170 439,673 * 19 * 1,419 187
New England 5 2 - 26 8 8,391 - 59 7
Maine - - - 3 - 80 - 4 -
N.H. 3 - - - 2 83 - 6 -
Vt. - - - 6 - 25 - 3 -
Mass. 2 - - 12 4 3,118 - 35 7
R.I. - 1 - 5 2 427 - 2 -
Conn. - 1 - - - 4,658 - 9 -
Mid. Atlantic 618 - - 63 11 54,796 - 135 18
N.Y. (excl. NYC) 5 - - 45 6 10,887 - 43 1
N.Y.C. 613 - - 3 - 19,240 - 34 14
N.J. - - - - - 6,444 - 27 3
Pa. - - - 15 5 18,225 - 31 -
E.N. Central 115 3 - 226 22 80,638 1 221 4
Ohio 21 1 - 72 4 22,286 1 125 1
Ind. 3 - - 20 5 8,656 - 12 -
Ill. 91 2 - 62 3 28,412 - 57 2
Mich. - - - 54 10 18,014 - 18 -
Wis. - - - 18 - 3,270 - 9 1
W.N. Central 3 - - 56 17 22,415 1 180 1
Minn. 1 - - 18 - 2,543 - 21 -
Iowa - - - 7 2 1,915 1 8 -
Mo. 1 - - 11 15 13,148 - 135 -
N. Dak. - - - 5 - 54 - - -
S. Dak. - - - 7 - 270 - 2 -
Nebr. - - - 1 - 714 - 9 1
Kans. 1 - - 7 - 3,771 - 5 -
S. Atlantic 86 2 - 231 78 124,475 13 244 13
Del. 1 - - 3 - 1,586 - - -
Md. - - - 25 - 13,548 - 52 1
D.C. 1 - - - 1 6,162 - 1 -
Va. 3 1 - 44 7 12,022 - 28 -
W. Va. 1 - - 117 - 635 - 10 -
N.C. 13 - - 31 - 24,187 1 23 1
S.C. - - - - - 10,953 - 40 -
Ga. 21 - - 2 - 31,483 12 71 -
Fla. 46 1 - 9 70 23,899 - 19 11
E.S. Central 35 - - 37 7 45,173 - 56 2
Ky. 4 - - 21 6 4,627 - 16 -
Tenn. 8 - - 10 - 14,285 - 12 -
Ala. 23 - - 3 - 15,793 - 18 2
Miss. - - - 3 1 10,468 - 10 -
W.S. CENTRAL 517 2 - 80 2 55,795 1 109 33
Ark. 170 - - 3 - 7,590 - 8 -
La. 310 - - 10 - 13,323 1 4 -
Okla. - - - 8 - 4,759 - 46 2
Tex. 37 2 - 59 2 30,123 - 51 31
Mountain 8 3 - 21 5 11,549 1 125 6
Mont. - - - - 1 81 - 5 -
Idaho - - - - - 171 - 3 1
Wyo. 1 - - - - 85 - 5 -
Colo. - 1 - 14 - 3,803 - 24 -
N. Mex. - - - 4 2 1,014 - 9 -
Ariz. 3 - - - - 4,176 1 31 3
Utah 4 2 - 1 1 350 - 12 1
Nev. - - - 2 1 1,869 - 36 1
PACIFIC 12 6 - 179 20 36,441 2 290 103
Wash. - - - 1 - 3,740 - 19 9
Oreg. - - - - - 1,189 - 11 -
Calif. 12 6 - 167 20 29,970 2 240 75
Alaska - - - 10 - 678 - 6 1
Hawaii - - - 1 - 864 - 14 18
---------------------------------------------------------------------------------------------------------------------------------
Guam - - - - - 83 - - 4
P.R. 25 - - - - 527 1 3 -
V.I. 5 - - - - 84 - - -
C.N.M.I. - - - 1 - - - 24 2
American Samoa - - - - - - - - -
---------------------------------------------------------------------------------------------------------------------------------
* Cases updated through February 28, 1994.
====================================================================================================================================
NOTIFIABLE DISEASES -- reported cases, by geographic division and area, United States,
1993 (Page 3)
-------------------------------------------------------------------------------------------------------------------------------
Hepatitis Lympho-
non-A, Hepatitis Legionel- Lepto- Lyme granuloma
Area Hepatitis A Hepatitis B non-B unsp. losis spirosis disease venereum Malaria
-------------------------------------------------------------------------------------------------------------------------------
United States 24,238 13,361 4,786 * 627 1,280 51 8,257 285 + 1,411
New England 448 356 106 13 66 - 1,815 8 97
Maine 14 11 2 - 6 - 18 - 7
N.H. 18 27 8 - 2 - 15 1 4
Vt. 9 10 6 - 3 - 12 - 3
Mass. 213 214 77 13 32 - 148 7 46
R.I. 77 19 13 - 23 - 272 - 7
Conn. 117 75 - - NN - 1,350 - 30
Mid. Atlantic 1,665 1,574 398 7 253 3 4,689 184 325
N.Y. (excl. NYC) 464 457 259 1 89 2 2,758 12 123
N.Y.C. 722 353 3 - 3 - 60 172 126
N.J. 295 407 98 - 33 1 786 - 51
Pa. 184 357 38 6 128 - 1,085 - 25
E.N. Central 2,727 1,497 595 15 327 5 505 4 93
Ohio 338 192 37 - 154 2 30 4 15
Ind. 646 249 15 1 49 - 32 - 2
Ill. 1,023 344 102 7 26 3 19 - 46
Mich. 213 393 400 7 62 - 23 - 19
Wis. 507 319 41 - 36 - 401 - 11
W.N. Central 2,372 802 79 27 95 8 319 2 45
Minn. 497 96 14 4 3 - 141 - 21
Iowa 60 36 9 4 19 3 8 - 5
Mo. 1,443 585 25 19 33 3 108 1 9
N. Dak. 80 1 3 - 2 - 2 - 1
S. Dak. 18 - - - - - - 1 2
Nebr. 195 19 11 - 30 2 6 - 4
Kans. 79 65 17 - 8 - 54 - 3
S. Atlantic 1,329 2,408 723 95 219 2 639 60 338
Del. 12 18 1 - 4 1 143 - 2
Md. 159 265 42 3 56 - 180 2 48
D.C. 11 43 3 - 15 - 2 8 11
Va. 156 157 54 43 11 - 95 7 41
W. Va. 29 44 43 - 4 - 50 - 2
N.C. 94 315 80 - 27 1 86 16 145
S.C. 18 51 5 1 19 - 9 - 7
Ga. 145 670 451 1 36 - 44 22 20
Fla. 705 845 44 47 47 - 30 5 62
E.S. Central 364 1,748 1,025 4 44 2 40 3 29
Ky. 142 99 16 - 19 - 16 1 5
Tenn. 104 1,152 994 3 17 1 20 1 12
Ala. 58 107 5 1 2 1 4 1 7
Miss. 60 390 10 - 6 - - - 5
W.S. Central 3,190 1,909 645 173 51 6 78 14 65
Ark. 74 90 5 3 6 1 8 - 4
La. 105 269 178 4 10 5 3 12 7
Okla. 213 195 50 9 13 - 19 - 6
Tex. 2,798 1,355 412 157 22 - 48 2 48
Mountain 4,164 686 366 79 81 - 20 1 40
Mont. 77 28 3 - 7 - - - 2
Idaho 298 89 - 3 1 - 2 - 1
Wyo. 17 34 119 - 7 - 9 - -
Colo. 877 81 62 44 9 - - - 25
N. Mex. 400 215 107 3 6 - 2 - 5
Ariz. 1,493 96 13 14 17 - - 1 1
Utah 828 69 42 13 16 - 2 - 2
Nev. 174 74 20 2 18 - 5 - 4
Pacific 7,979 2,381 849 214 144 25 152 9 379
Wash. 926 247 219 11 12 - 9 4 41
Oreg. 532 221 55 2 1 1 8 & 1 14
Calif. 5,677 1,876 560 198 121 - 134 4 314
Alaska 775 15 12 - - - - - 3
Hawaii 69 22 3 3 10 24 1 - 7
-------------------------------------------------------------------------------------------------------------------------------
Guam 3 6 - 11 - - - - 3
P.R. 79 412 90 2 - 11 - 1 -
V.I. 1 6 - - - - - - -
C.N.M.I. - 2 - 1 - 1 - - 2
American Samoa 20 1 - - - - - - -
-------------------------------------------------------------------------------------------------------------------------------
* The number of reported cases of non-A, non-B hepatitis is misleading because in some states, reported cases included persons
positive for antibody to hepatitis C virus (anti-HCV) identified in routine screening programs but who did not have hepatitis.
+ Cases updated through February 28, 1994.
& Voluntarily reportable for this state.
====================================================================================================================================
NOTIFIABLE DISEASES -- reported cases, by geographic division and area, United States,
1993 (Page 4)
-----------------------------------------------------------------------------------------------------------
Measles Meningo- Murine Polio-
--------------------- coccal typhus myelitis,
Area Indigenous Imported infections Mumps fever Pertussis Plague paralytic
-----------------------------------------------------------------------------------------------------------
United States 237 75 * 2,637 1,692 25 6,586 10 3 +
New England 54 9 133 15 - 834 - -
Maine 1 - 15 - - 20 - -
N.H. 2 - 6 3 - 168 - -
Vt. 30 1 7 1 - 122 - -
Mass. 11 7 72 1 - 408 - -
R.I. 1 1 - 2 - 14 - -
Conn. 9 - 33 8 - 102 - -
Mid. Atlantic 22 19 310 135 2 991 - 1
N.Y. (excl. NYC) 4 7 126 46 1 373 - -
N.Y.C. 12 7 37 2 1 116 - 1
N.J. 6 5 50 17 - 85 - -
Pa. - - 97 70 - 417 - -
E.N. Central 20 11 375 259 - 1,627 - -
Ohio 6 3 108 74 - 523 - -
Ind. 1 - 51 8 - 178 - -
Ill. 5 4 104 74 - 434 - -
Mich. 5 1 65 80 - 116 - -
Wis. 3 3 47 23 - 376 - -
W.N. Central 1 2 142 67 - 626 - -
Minn. - - 23 2 - 393 - -
Iowa - - 28 11 - 38 - -
Mo. 1 - 34 46 - 144 - -
N. Dak. - - 3 6 - 5 - -
S. Dak. - - 7 - - 8 - -
Nebr. - - 11 1 - 14 - -
Kans. - 2 36 1 - 24 - -
S. Atlantic 25 8 470 463 1 673 - 1
Del. - - 15 1 - 11 - -
Md. - 4 60 82 - 133 - 1
D.C. - - 6 1 - 14 - -
Va. - 4 52 40 1 75 - -
W. Va. - - 19 23 - 8 - -
N.C. 1 - 67 231 - 199 - -
S.C. - - 31 17 - 73 - -
Ga. - - 94 20 - 56 - -
Fla. 24 - 126 48 - 104 - -
E.S. Central 1 - 154 58 1 297 - -
Ky. - - 25 - - 38 - -
Tenn. - - 45 19 1 183 - -
Ala. 1 - 53 22 - 65 - -
Miss. - - 31 17 - 11 - -
W.S. Central 8 3 264 274 13 239 1 -
Ark. - - 27 10 1 18 - -
La. 1 - 46 20 - 14 - -
Okla. - - 34 13 - 86 - -
Tex. 7 3 157 231 12 121 1 -
Mountain 4 3 211 81 - 464 10 -
Mont. - - 13 - - 11 - -
Idaho - - 21 6 - 101 - -
Wyo. - - 5 5 - 2 - -
Colo. 3 - 41 18 - 187 2 -
N. Mex. - - 8 NN - 43 6 -
Ariz. - 3 86 19 - 70 - -
Utah - - 24 6 - 45 1 -
Nev. 1 - 13 27 - 5 - -
Pacific 102 20 578 340 8 835 - 1
Wash. - - 97 14 - 91 - 1
Oreg. - 4 110 NN - 106 - -
Calif. 89 7 346 285 8 619 - -
Alaska 2 - 15 11 - 5 - -
Hawaii 11 9 10 30 - 14 - -
-----------------------------------------------------------------------------------------------------------
Guam 22 3 1 13 - - - -
P.R. 356 - 14 3 - 11 - -
V.I. - - - 5 - - - -
C.N.M.I. 92 1 - 15 - 1 - -
American Samoa - - - 5 - 2 - -
-----------------------------------------------------------------------------------------------------------
* For measles only, imported includes both out-of-state and international importations.
+ Ten suspected cases of paralytic poliomyelitis were reported in 1993. Three cases have been confirmed as of August 12, 1994,
two of which were vaccine-associated; one was classified as imported. The number of reported cases is subject to change due
to retrospective case evaluations or late reports.
====================================================================================================================================
NOTIFIABLE DISEASES -- reported cases, by geographic division and area, United States,
1993 (Page 5)
----------------------------------------------------------------------------------------------------------------
Rubella
Rabies Rheumatic ------------------
Psitta- --------------- fever, Cong. Salmonel- Shigel-
Area cosis Animal Human acute RMSF * Rubella syndrome losis losis
----------------------------------------------------------------------------------------------------------------
United States 60 9,377 3 112 456 192 5 41,641 32,198
New England 2 1,695 - 2 4 10 - 3,882 605
Maine - - - 1 - 1 - 158 8
N.H. - 148 - NN - - - 220 17
Vt. 1 45 - - - - - 421 8
Mass. 1 720 - - 4 9 - 2,041 285
R.I. - 2 - - - - - 231 42
Conn. - 780 - 1 - - - 811 245
Mid. Atlantic 16 3,585 1 - 28 59 2 7,005 2,218
N.Y. (excl. NYC) 5 2,692 1 NN 7 17 1 2,390 790
N.Y.C. - 53 - NN 1 22 - 1,601 554
N.J. 2 458 - - 10 15 - 1,215 347
Pa. 9 382 - NN 10 5 1 1,799 527
E.N. Central 8 110 - 33 18 8 - 5,810 5,111
Ohio 4 6 - 5 8 1 - 1,214 1,411
Ind. - 12 - - 4 3 - 543 811
Ill. 1 23 - 2 4 1 - 2,232 1,722
Mich. 1 18 - 21 2 2 - 815 829
Wis. 2 51 - 5 - 1 - 1,006 338
W.N. Central 3 351 - 26 34 1 - 1,924 1,509
Minn. - 45 - 7 1 - - 551 240
Iowa 2 79 - 2 7 - - 241 69
Mo. 1 35 - - 20 1 - 529 674
N. Dak. - 57 - NN - - - 60 7
S. Dak. - 49 - 14 3 - - 99 111
Nebr. - 7 - NN 2 - - 145 200
Kans. - 79 - 3 1 - - 299 208
S. Atlantic 8 2,165 - - 215 7 - 8,502 7,049
Del. - 135 - NN - - - 185 178
Md. 2 605 - NN 14 3 - 936 384
D.C. - 18 - NN - - - 102 87
Va. 1 387 - NN 14 - - 1,055 776
W. Va. - 90 - - 6 - - 109 38
N.C. 4 107 - NN 129 - - 1,121 2,305
S.C. 1 165 - NN 11 - - 738 414
Ga. - 471 - NN 37 - - 1,316 474
Fla. - 187 - NN 4 4 - 2,940 2,393
E.S. Central 1 260 - - 63 1 - 1,879 1,849
Ky. - 20 - NN 16 1 - 302 171
Tenn. 1 124 - NN 32 - - 558 938
Ala. - 116 - NN 4 - - 554 375
Miss. - - - - 11 - - 465 365
W.S. Central 2 635 1 - 77 24 - 3,297 5,748
Ark. - 42 - - 17 - - 402 201
La. - 17 - NN 2 1 - 650 482
Okla. 1 65 - NN 51 1 - 321 484
Tex. 1 511 1 NN 7 22 - 1,924 4,581
Mountain 3 178 - 28 16 12 - 2,018 1,921
Mont. - 24 - NN 2 - - 106 56
Idaho 1 8 - NN - 2 - 173 46
Wyo. - 25 - 1 10 - - 59 22
Colo. - 29 - 5 4 3 - 550 611
N. Mex. 1 9 - 3 - - - 326 411
Ariz. - 60 - NN - 2 - 519 693
Utah 1 8 - 19 - 4 - 154 42
Nev. - 15 - NN - 1 - 131 40
Pacific 17 398 1 23 1 70 3 7,324 6,188
Wash. 4 - - - - - - 832 797
Oreg. 4 7 - NN 1 - - 349 169
Calif. 9 363 1 20 - 41 3 5,739 5,093
Alaska - 28 - 3 - 1 - 59 30
Hawaii - - - NN - 28 - 345 99
----------------------------------------------------------------------------------------------------------------
Guam - - - 2 - - - 119 35
P.R. - 43 - - - - - 734 46
V.I. - - - - - - - 5 1
C.N.M.I. - - - 10 - - - 54 73
American Samoa - - - 1 - - - 55 17
----------------------------------------------------------------------------------------------------------------
* Rocky Mountain spotted fever.
====================================================================================================================================
NOTIFIABLE DISEASES -- reported cases, by geographic division and area, United States,
1993 (Page 6)
--------------------------------------------------------------------------------------------------------------------------------
Syphilis
------------------------------- Toxic- Varicella
Primary & Cong. All shock Trich- Tuber- Typhoid (chicken-
Area secondary (<1 yr.) stages Tetanus syndrome inosis culosis Tularemia fever pox)
--------------------------------------------------------------------------------------------------------------------------------
United States 26,498 * 3,211 * 101,259 * 48 212 16 25,313 132 440 134,722
New England 330 17 1,713 2 13 - 649 - 31 12,655
Maine 7 - 19 - 3 - 27 - - 1,733
N.H. 26 - 50 - 3 - 26 - 2 1,635
Vt. 1 - 1 - 1 - 7 - - NN
Mass. 122 6 935 2 5 - 370 - 23 6,619
R.I. 16 1 146 - 1 - 64 - - 2,668
Conn. 158 10 562 - - - 155 - 6 NN
Mid. Atlantic 2,415 1,070 19,306 2 33 4 5,611 2 139 4,773
N.Y. (excl. NYC) 258 94 1,980 - 17 4 718 2 20 NA
N.Y.C. 1,132 654 10,513 - 1 - 3,235 - 95 4,773
N.J. 328 161 2,556 - - - 912 - 18 NN
Pa. 697 161 4,257 2 15 - 746 - 6 NN
E.N. Central 4,070 527 11,789 7 48 2 2,385 5 40 64,380
Ohio 1,180 70 2,889 2 12 - 315 - 7 5,472
Ind. 362 1 1,019 1 1 - 248 1 2 NN
Ill. 1,489 368 4,881 1 11 2 1,242 3 23 26,447
Mich. 543 84 1,952 3 24 - 480 1 7 32,461
Wis. 496 4 1,048 - - - 100 - 1 NA
W.N. Central 1,631 111 3,271 10 15 - 582 39 2 16,814
Minn. 66 9 261 6 3 - 141 - - NN
Iowa 64 1 175 1 7 - 59 - - 5,057
Mo. 1,354 97 2,500 1 2 - 257 17 2 9,609
N. Dak. 1 - 4 - - - 7 - - 37
S. Dak. 2 - 3 - - - 16 17 - 420
Nebr. 14 1 35 - - - 22 2 - 4
Kans. 130 3 293 2 3 - 80 3 - 1,687
S. Atlantic 6,513 586 24,237 8 24 6 4,626 4 63 8,332
Del. 94 3 274 - - - 66 - 1 3
Md. 359 30 1,865 2 1 3 406 - 8 NN
D.C. 291 74 1,652 - - - 161 - - 4
Va. 660 23 1,970 - 7 1 458 - 7 2,917
W. Va. 8 6 195 - - - 75 - - 5,288
N.C. 1,937 54 4,448 - 4 - 594 2 3 NN
S.C. 921 82 2,339 1 - - 401 - - 120
Ga. 1,052 79 4,077 - 2 - 810 - 3 NN
Fla. 1,191 235 7,417 5 10 2 1,655 2 41 NN
E.S. Central 4,117 158 10,494 3 11 - 1,727 4 7 3,981
Ky. 331 9 651 - 3 - 405 1 2 1,429
Tenn. 1,156 52 3,241 2 4 - 556 2 2 2,552
Ala. 869 27 2,333 1 2 - 487 1 3 NN
Miss. 1,761 70 4,269 - 2 - 279 - - NN
W.S. Central 5,969 409 19,079 9 2 - 3,181 58 19 14,292
Ark. 559 8 1,600 1 - - 209 36 2 NN
La. 2,598 144 6,854 - - - 367 -- 1 NN
Okla. 282 11 721 1 2 - 209 17 1 -
Tex. 2,530 246 9,904 7 - - 2,396 5 15 14,291
Mountain 256 27 1,251 1 16 1 592 12 11 7,192
Mont. 1 - 4 - - - 22 5 - 84
Idaho 2 - 15 - 2 - 12 - - NN
Wyo. 4 - 9 - - 1 7 3 - NN
Colo. 90 8 287 1 2 - 102 1 5 NN
N. Mex. 34 - 172 - 1 - 74 - 2 NN
Ariz. 95 16 557 - 2 - 231 - 3 6,811
Utah 10 - 68 - 7 - 46 2 1 297
Nev. 20 3 139 - 2 - 98 1 - NN
Pacific 1,197 306 10,119 6 50 3 5,960 8 128 2,303
Wash. 67 4 360 1 7 - 286 2 8 NN
Oreg. 39 4 179 - - - 154 3 4 NN
Calif. 1,073 298 9,488 5 42 1 5,212 3 113 NN
Alaska 11 - 51 - - - 57 - - NN
Hawaii 7 - 41 - 1 2 251 - 3 2,303
--------------------------------------------------------------------------------------------------------------------------------
Guam - - 5 - - - NA - 4 553
P.R. 470 18 2,482 2 - - 253 - - 8,228
V.I. 12 1 39 1 - - 4 - - 486
C.N.M.I. - - - - - - NA - - 178
American Samoa - - - - - - NA - 1 176
--------------------------------------------------------------------------------------------------------------------------------
* Cases updated through February 28, 1994.
Return to top. Table_N3 Note: To print large tables and graphs users may have to change their printer settings to landscape and use a small font size.
NOTIFIABLE DISEASES - summary of reported cases, by age group, United States, 1993
===========================================================================================================================================================================================
                                                                                                                                                                Age
                                                                                                                                                                not
Disease                               Total    Under 1      1-4       5-9     10-14     15-19     20-24     25-29     30-39     40-49     50-59      60+     stated
-------------------------------------------------------------------------------------------------------------------------------------------------------------------
AIDS *                              103,691       328       352       148       138       487     3,771    14,795    47,064    26,602     7,423     2,583         -
Amebiasis                             2,970        13       119       147        70        82       123       200       394       234       121        98     1,369
Anthrax                                   -         -         -         -         -         -         -         -         -         -         -         -         -
Aseptic meningitis                   12,848     2,668       917     1,297       913       803     1,091     1,276     2,068       702       267       328       518
Botulism, total                          97        63         1         -         -         -         1         1         3         5         3        11         9
Brucellosis                             120         1         1        12         1         7        11        11        27        18        13        12         6
Cholera                                  18         -         2         -         -         1         -         4         5         1         3         2         -
Diphtheria                                -         -         -         -         -         -         -         -         -         -         -         -         -
Encephalitis, primary infections        919        65        78       115        99        58        58        51       115        79        50       136        15
  Post-infectious                       170        12        25        28         9        10        11         9        20        13         9        23         1
Gonorrhea +                         440,149         -         -         -     8,249   116,974   119,739    62,217    64,110   ...........23,563..........    43,660
Haemophilus influenzae                1,419       288       147        57        32        34        23        28        93        70       100       476        71
Hansen disease (leprosy)                187         -         1         -         3         5        18        16        30        25        18        50        21
Hepatitis A                          24,238       141     1,442     3,075     2,120     1,845     2,520     2,772     4,378     1,912       904     1,237     1,892
Hepatitis B                          13,361        63        78       100       201       915     1,768     2,108     3,670     1,868       800       796       994
Hepatitis, non-A, non-B &             4,786        34        16        23        28        74       245       522     1,881     1,106       290       439       128
Hepatitis, unspecified                  627         4        28        49        33        26        54        74       147        85        49        51        27
Legionellosis                         1,280         4         5         -         7         9        20        35       136       180       188       646        50
Leptospirosis                            51         -         -         4         5         2        10         3        11         7         2         1         6
Lyme disease                          8,257        13       334       621       490       325       312       399     1,161     1,169       845     1,391     1,197
Malaria                               1,411        16        77        69        70        99       234       177       324       158        77        65        45
Measles (rubeola)                       312        34        85        52        35        27        24        14        31         5         1         -         4
Meningococcal infections              2,637       444       480       227       199       297       173        82       127       104        93       270       141
Mumps                                 1,692        14       284       497       316       186        88        50       111        44        18         8        76
Murine typhus fever                      25         -         -         -         1         2         -         1         5         7         2         7         -
Pertussis (whooping cough)            6,586     2,838     1,378       737       552       275        98        92       242       164        45        34       131
Plague                                   10         -         -         -         -         -         2         -         2         1         -         5         -
Poliomyelitis, paralytic @                3         -         1         -         -         -         -         -         2         -         -         -         -
Psittacosis                              60         -         -         -         2         4         1         2        19        16         7         6         3
Rabies, human                             3         -         -         -         1         -         -         -         -         -         -         2         -
Rheumatic fever, acute                  112         -         4        12        34         4         1         1        10         2         -         1        43
Rocky Mountain spotted fever            456         4        38        58        40        24        21        17        70        54        46        69        15
Rubella (German measles)                192        15        17        19        13         8        33        24        34        16         4         2         7
Salmonellosis                        41,641     5,162     5,747     2,344     1,457     1,584     2,337     2,283     4,099     2,796     1,752     4,169     7,911
Shigellosis                          32,198       744     8,849     5,859     1,500       863     1,501     1,690     2,457       930       455       652     6,698
Syphilis, primary and secondary +    26,546         -         -         -       174     2,940     5,469     5,176     8,040   ............4,686..........        35
Tetanus                                  48         -         -         -         -         1         3         3         3         4         8        26         -
Toxic-shock syndrome                    212         -         6         2        15        32        27        28        55        25        11         8         3
Trichinosis                              16         -         -         -         -         2         1         2         1         4         4         -         2
Tuberculosis                         25,313       220       856       355       290       580     1,263     1,965     5,255     4,302     3,021     7,162        44
Tularemia                               132         1        18        13        14         9         3         9        12        13         7        27         6
Typhoid fever                           440         4        39        58        38        38        55        56        83        29        13        18         9
Varicella (chickenpox)              134,722       775     6,896    20,068     3,682       848       330       254       227        68        35        73   101,466
-------------------------------------------------------------------------------------------------------------------------------------------------------------------
* AIDS total updated through December 31, 1993.
+ Age data are collected on aggregate forms different from those used for numbers of reported cases. Therefore, total cases reported on this table may differ slightly from other tables.
  Cases among persons <=9 years of age are not shown because some of these may not be due to sexual transmission;  however, they are included in the totals.
& The number of reported cases of non-A, non-B hepatitis is misleading because in some states, reported cases included persons positive for antibody to hepatitis C virus (anti-HCV)
  who were identified in routine screening programs but who did not have acute hepatitis.
@ Subject to change due to retrospective case evaluations or late reports.
===========================================================================================================================================================================================
Return to top. Table_N4 Note: To print large tables and graphs users may have to change their printer settings to landscape and use a small font size.
NOTIFIABLE  DISEASES -- summary of reported cases, by race, * United States, 1993
======================================================================================================================================================================================
                                              American Indian        Asian or                                     Race not
Disease                               Total   or Alaska Native   Pacific Islander     Black     White     Other    stated +
---------------------------------------------------------------------------------------------------------------------------
AIDS &                              103,691           339                765         38,514    48,222         -     15,851
Amebiasis                             2,970             7                140             88       570         3      2,162
Anthrax                                   -             -                  -              -         -         -          -
Aseptic meningitis                   12,848            42                211          1,780     7,210        36      3,569
Botulism, total                          97             9                  2              8        54         -         24
Brucellosis                             120             -                  2             25        58         -         35
Cholera                                  18             -                  1              1         6         -         10
Diphtheria                                -             -                  -              -         -         -          -
Encephalitis, primary infections        919             4                 12             88       603         2        210
  Post-infectious                       170             -                  1             21       110         2         36
Gonorrhea @                         440,149         1,708              1,340        270,829    41,346         -    124,926
Haemophilus influenzae                1,419            17                 21            211       805         1        364
Hansen disease (leprosy)                187             -                 61              7        52         2         65
Hepatitis A                          24,238         1,217                461          2,336    12,528        84      7,612
Hepatitis B                          13,361            76                708          2,953     5,435        48      4,141
Hepatitis, non-A, non-B **            4,786            46                 40            646     2,382         1      1,671
Hepatitis, unspecified                  627             4                 10             64       339         9        201
Legionellosis                         1,280             3                 13            117       865         1        281
Leptospirosis                            51             -                  8              1        25         -         17
Lyme disease                          8,257            13                 39            121     4,855         2      3,227
Malaria                               1,411             4                293            347       424        20        323
Measles (rubeola)                       312             1                 32             24       191         -         64
Meningococcal infections              2,637            15                 37            323     1,626        19        617
Mumps                                 1,692             5                 40            286       817         5        539
Murine typhus fever                      25             -                  -              3        21         -          1
Pertussis (whooping cough)            6,586            33                 38            434     2,539         7      3,535
Plague                                   10             1                  -              -         7         -          2
Poliomyelitis, paralytic ++               3             -                  -              1         2         -          -
Psittacosis                              60             -                  -              3        38         -         19
Rabies, human                             3             -                  -              -         3         -          -
Rheumatic fever, acute                  112            13                  2              -        30         1         66
Rocky Mountain spotted fever            456            24                  1             18       341         -         72
Rubella (German measles)                192             1                 31              4       115         -         41
Rubella, congenital syndrome              5             -                  -              1         2         -          2
Salmonellosis                        41,641           166                481          3,580    17,196        30     20,188
Shigellosis                          32,198           341                147          5,566    12,847        16     13,281
Syphilis, primary and secondary @    26,546            37                 84         22,330     2,230         -      1,865
Tetanus                                  48             -                  1              4        33         -         10
Toxic-shock syndrome                    212             -                  4             10       160         1         37
Trichinosis                              16             -                  1              2         9         -          4
Tuberculosis                         25,313           278              3,739          9,175    11,978         -        143
Tularemia                               132            18                  -              2        93         -         19
Typhoid fever                           440             -                117             40        78        14        191
Varicella (chickenpox)              134,722             2                 94          1,615       477         -    132,534
---------------------------------------------------------------------------------------------------------------------------
 * Some information on race/ethnicity was reported using one variable with the following categories: American Indian or Alaska Native, Asian or Pacific Islander, Black non-Hispanic,
   White non-Hispanic, and Hispanic. Race not stated includes cases originally reported as Hispanic.
 + Includes cases originally reported as Hispanic: 15,681 for AIDS; 16,150 for Gonorrhea; and 1,338 for Syphilis, primary and secondary.
 & AIDS total reported through December 31, 1993.
 @ Race data are collected on aggregate forms different from those used for numbers of reported cases. Therefore, total cases reported on this table may differ slightly from other
   tables.
** The number of reported cases of non-A, non-B hepatitis is misleading because in some states, reported cases included persons positive for antibody to hepatitis C virus (anti-HCV)
   who were identified in routine screening programs but who did not have acute hepatitis.
++ Subject to change due to retrospective case evaluations or late reports.
======================================================================================================================================================================================
Return to top. Table_N5 Note: To print large tables and graphs users may have to change their printer settings to landscape and use a small font size.
NOTIFIABLE DISEASES -- summary of reported cases, by ethnicity, * United States, 1993
=======================================================================================================================================
                                                                        Ethnicity not
Disease                               Total   Hispanic   Non-Hispanic          stated
-------------------------------------------------------------------------------------
AIDS +                              103,691     15,681         86,736           1,274
Amebiasis                             2,970        260            518           2,192
Anthrax                                   -          -              -               -
Aseptic meningitis                   12,848      1,545          6,096           5,207
Botulism, total                          97         11             55              31
Brucellosis                             120         58             15              47
Cholera                                  18         13              1               4
Diphtheria                                -          -              -               -
Encephalitis, primary infections        919         52            409             458
  Post-infectious                       170         18             94              58
Gonorrhea &                         440,149     16,150        312,175         111,824
Haemophilus influenzae                1,419         78            722             619
Hansen disease (leprosy)                187         67             90              30
Hepatitis A                          24,238      4,251         11,912           8,075
Hepatitis B                          13,361        928          6,525           5,908
Hepatitis, non-A, non-B @             4,786        364          1,962           2,460
Hepatitis, unspecified                  627        151            294             182
Legionellosis                         1,280         21            652             607
Leptospirosis                            51          -             15              36
Lyme disease                          8,257         92          2,980           5,185
Malaria                               1,411        105            897             409
Measles (rubeola)                       312         43            201              68
Meningococcal infections              2,637        219          1,403           1,015
Mumps                                 1,692        271            716             705
Murine typhus fever                      25          6             16               3
Pertussis (whooping cough)            6,586        422          1,740           4,424
Plague                                   10          2              5               3
Poliomyelitis, paralytic **               3          -              3               -
Psittacosis                              60          3             29              28
Rabies, human                             3          1              2               -
Rheumatic fever, acute                  112          5             21              86
Rocky Mountain spotted fever            456          4            246             206
Rubella (German measles)                192         36            104              52
Rubella, congenital syndrome              5          -              3               2
Salmonellosis                        41,641      2,248         13,620          25,773
Shigellosis                          32,198      3,436         11,523          17,239
Syphilis, primary and secondary &    26,546      1,338         24,560             648
Tetanus                                  48          9             19              20
Toxic-shock syndrome                    212          7            119              86
Trichinosis                              16          1              6               9
Tuberculosis                         25,313      5,197         19,876             240
Tularemia                               132          2             47              83
Typhoid fever                           440        141            191             108
Varicella (chickenpox)              134,722      1,297          2,178         131,247
-------------------------------------------------------------------------------------
 * Some information on race/ethnicity was reported using one variable with the following categories: American Indian or Alaska
   Native, Asian or Pacific Islander, Black non-Hispanic, White non-Hispanic, and Hispanic. Ethnicity not stated includes cases
   originally reported as American Indian or Alaska Native and Asian or Pacific Islander.
 + AIDS total reported through December 31, 1993.
 & Ethnicity data are collected on aggregate forms different from those used for numbers of reported cases. Therefore, total cases
   reported on this table may differ slightly from other tables.
 @ The number of reported cases of non-A, non-B hepatitis is misleading because in some states, reported cases included persons
   positive for antibody to hepatitis C virus (anti-HCV) who were identified in routine screening programs but who did not have acute
   hepatitis.
** Subject to change due to retrospective case evaluations or late reports.
=======================================================================================================================================
Return to top. Figure_1 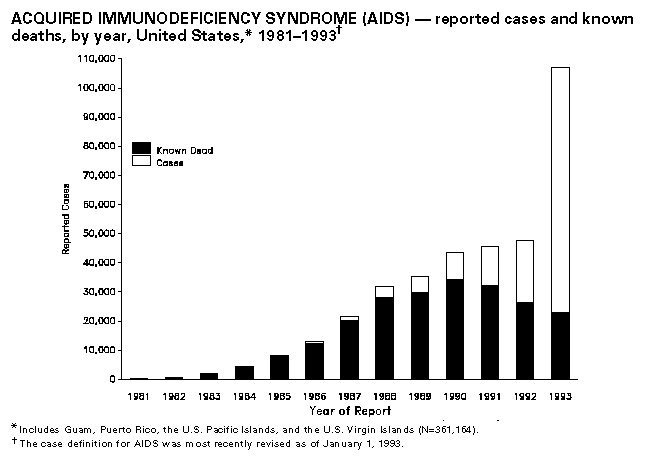 Return to top. Figure_2 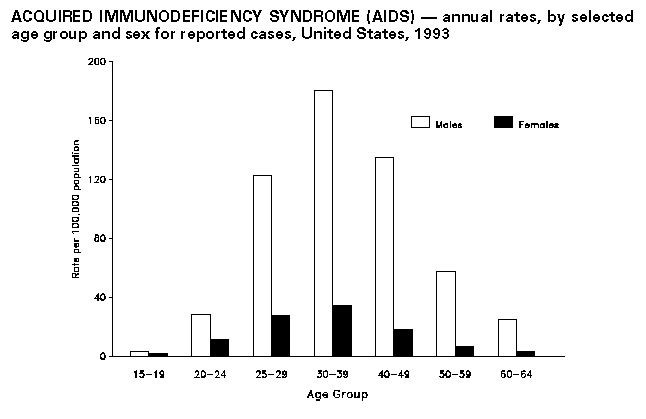 Return to top. Figure_3 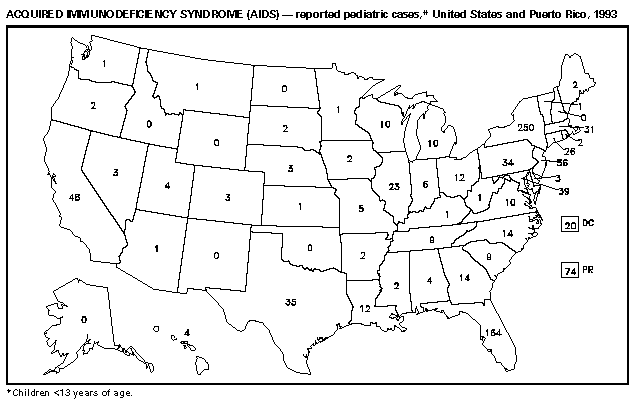 Return to top. Figure_4 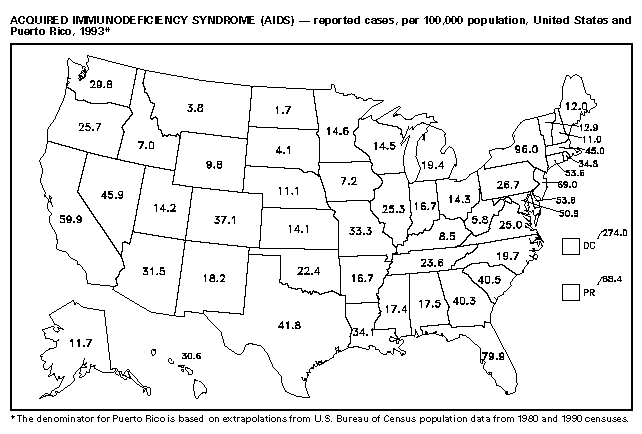 Return to top. Figure_5 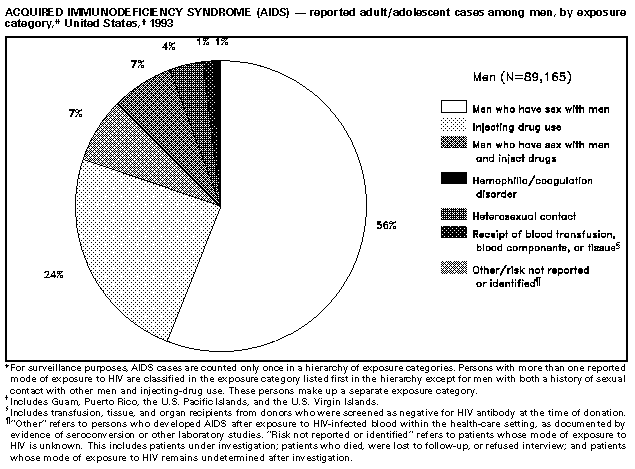 Return to top. Figure_6 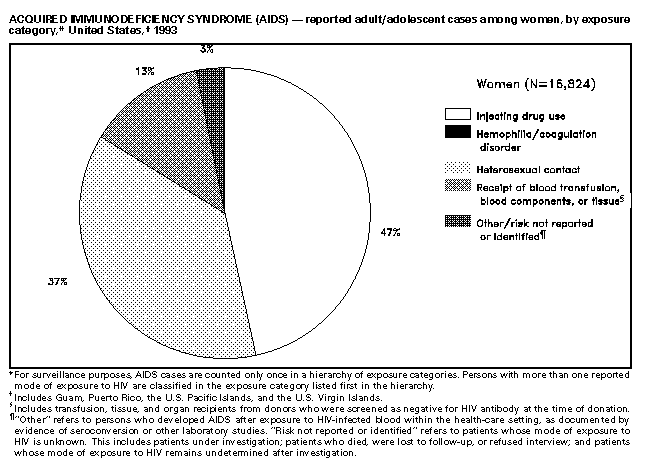 Return to top. Figure_7 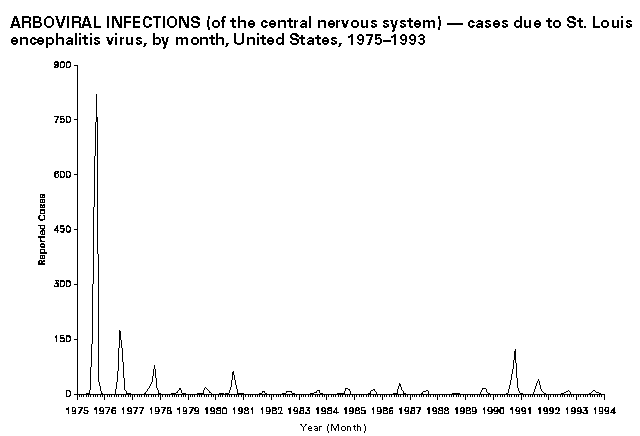 Return to top. Figure_8 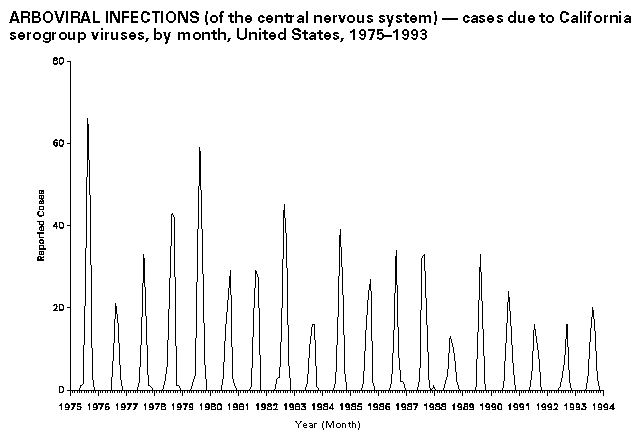 Return to top. Figure_9 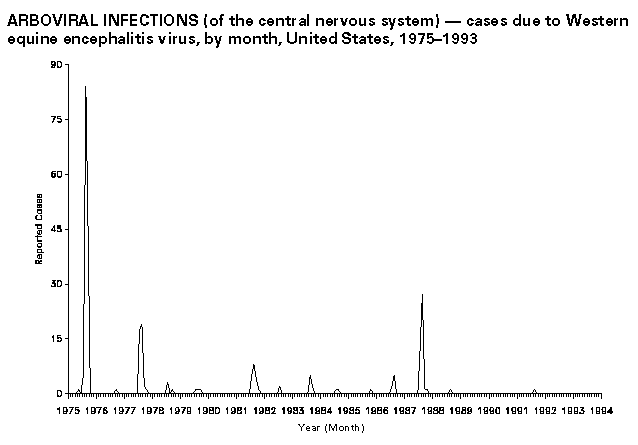 Return to top. Figure_10 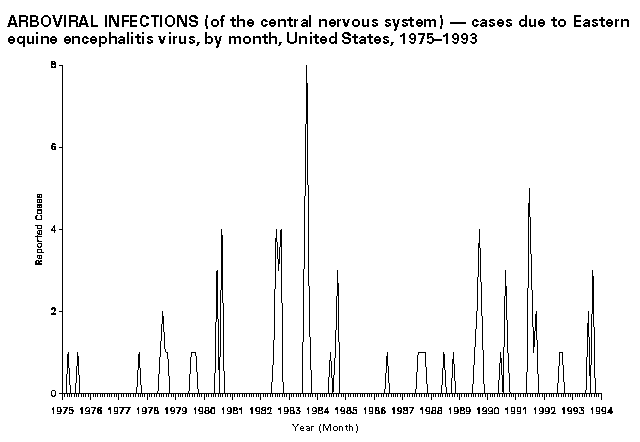 Return to top. Figure_12 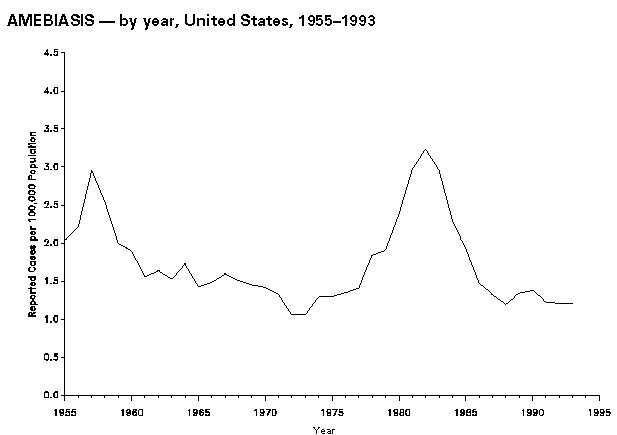 Return to top. Figure_11 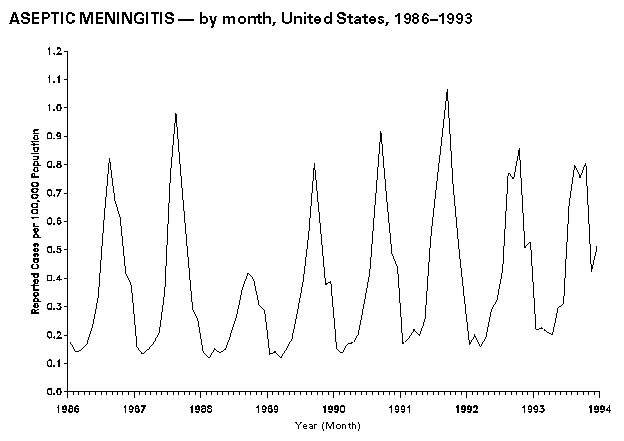 Return to top. Figure_13 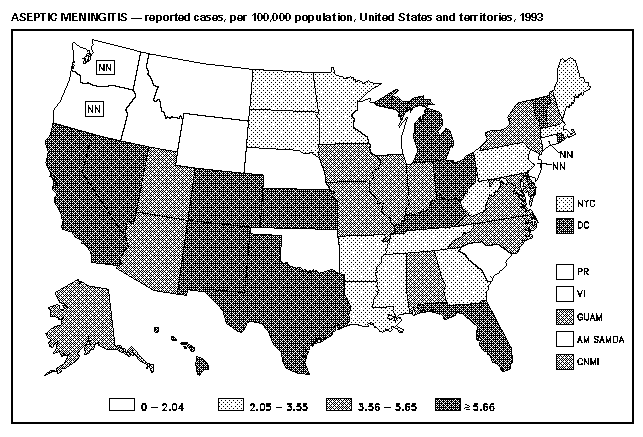 Return to top. Figure_15 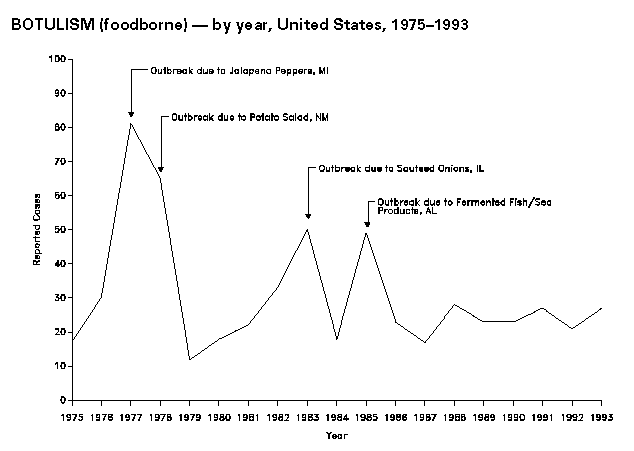 Return to top. Figure_14 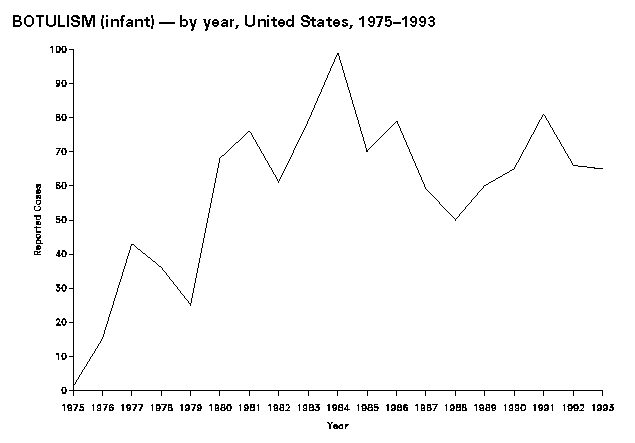 Return to top. Figure_16 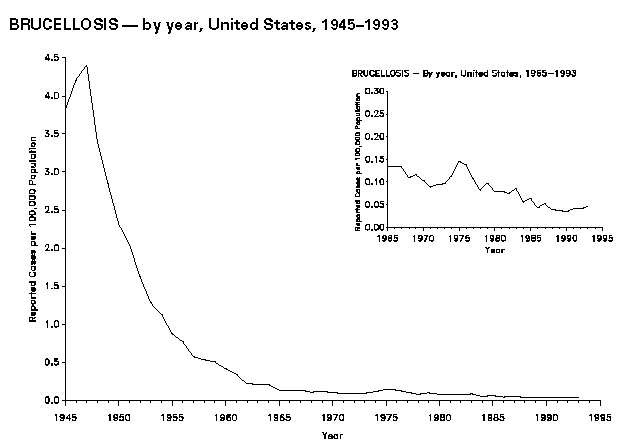 Return to top. Figure_17 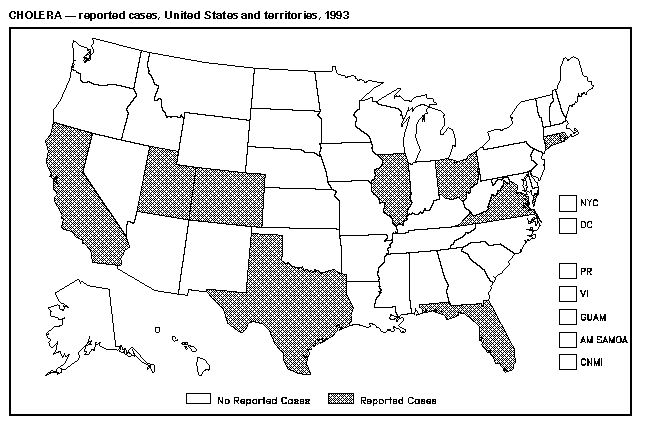 Return to top. Figure_18 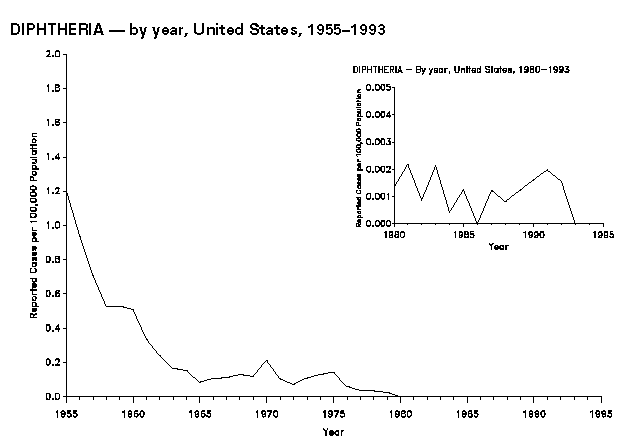 Return to top. Figure_19 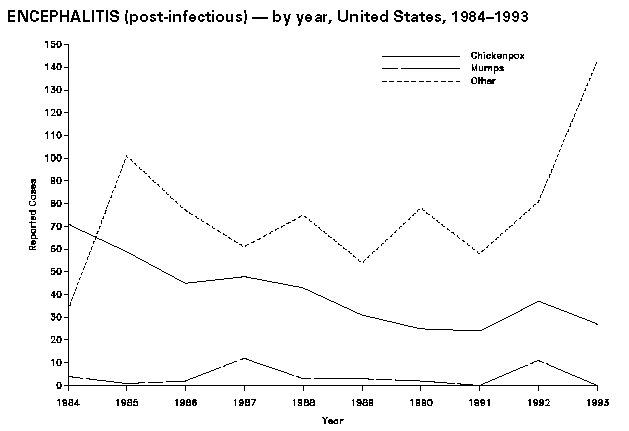 Return to top. Figure_20 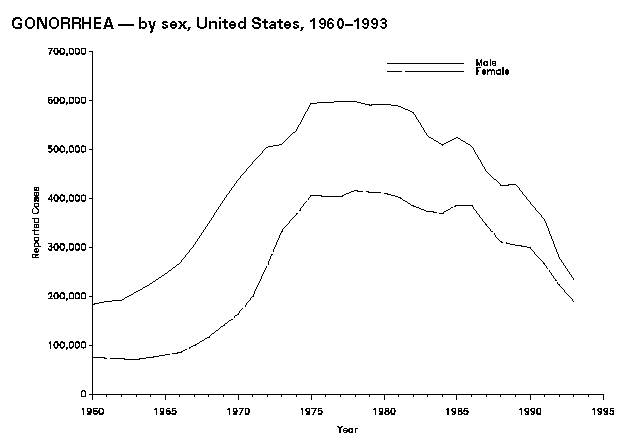 Return to top. Figure_21 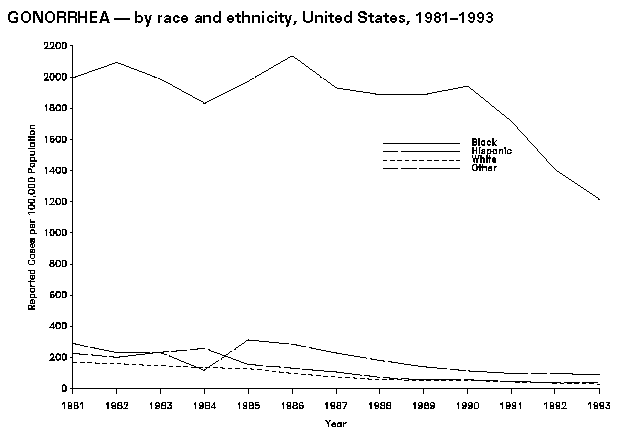 Return to top. Figure_22 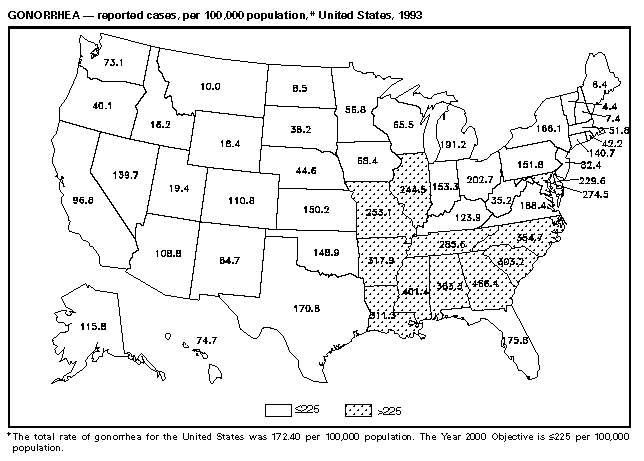 Return to top. Figure_23 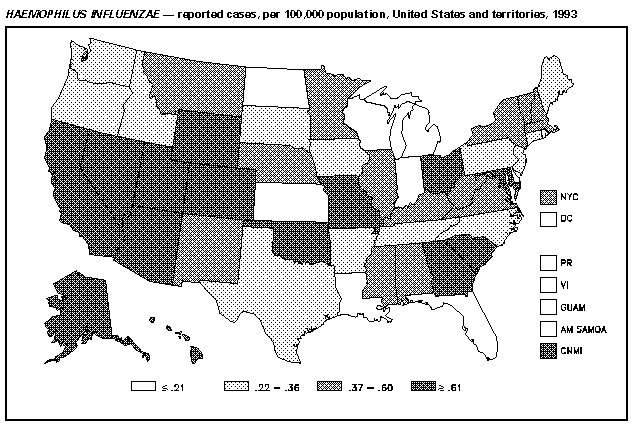 Return to top. Figure_24 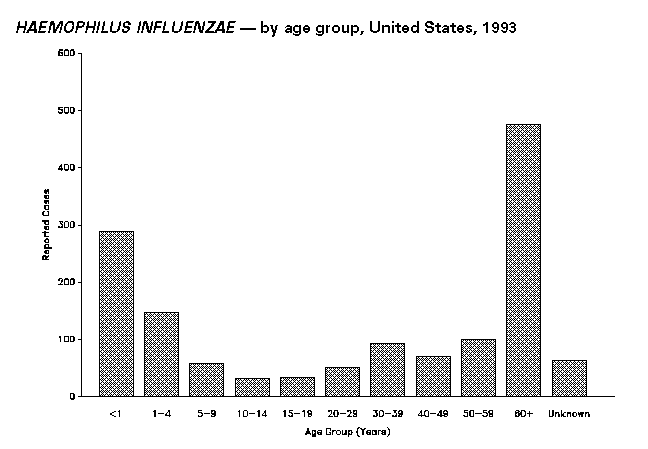 Return to top. Figure_25 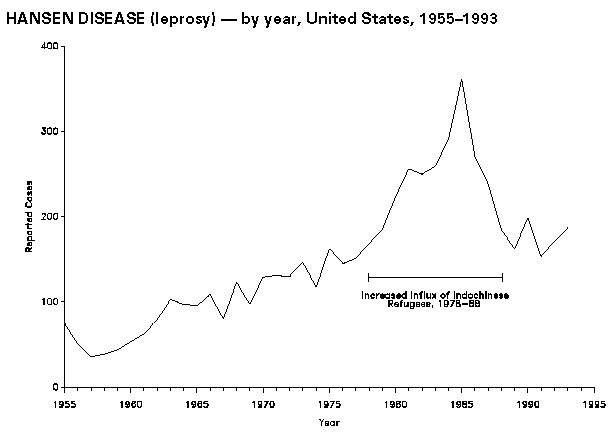 Return to top. Figure_26 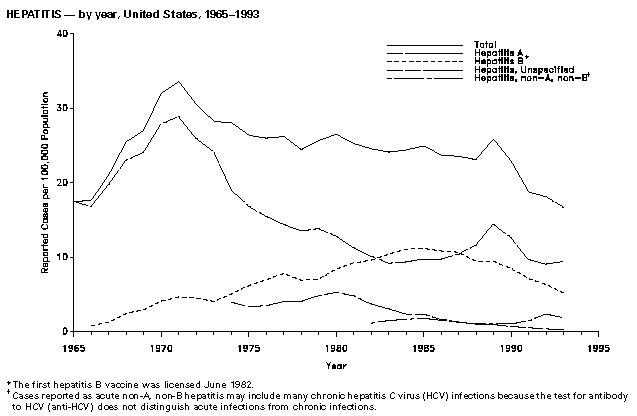 Return to top. Figure_27 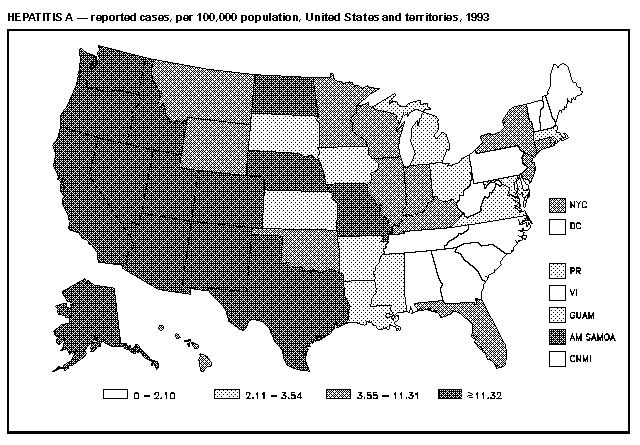 Return to top. Figure_28 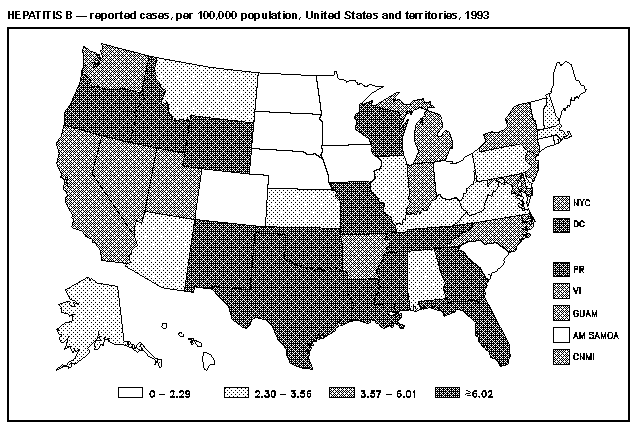 Return to top. Figure_29 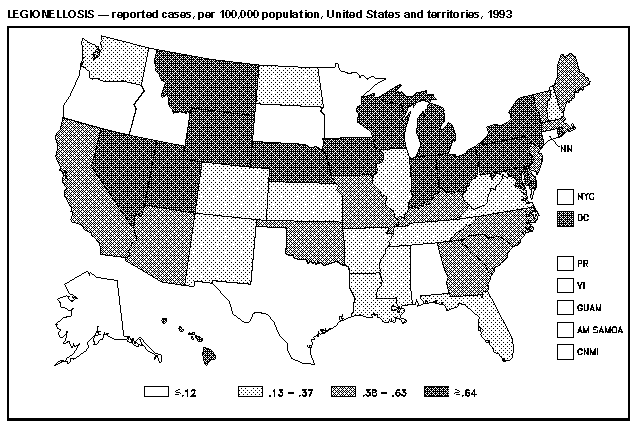 Return to top. Figure_30 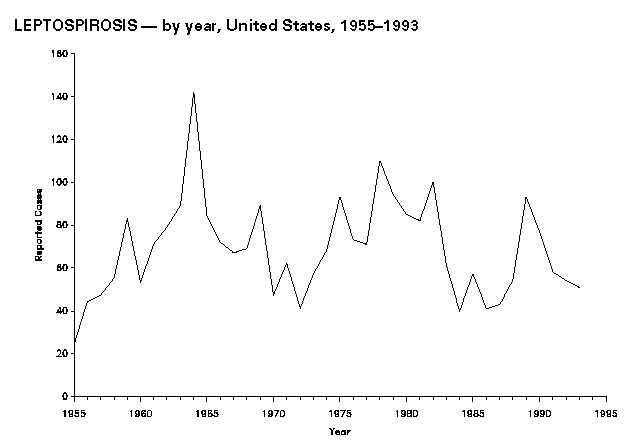 Return to top. Figure_31 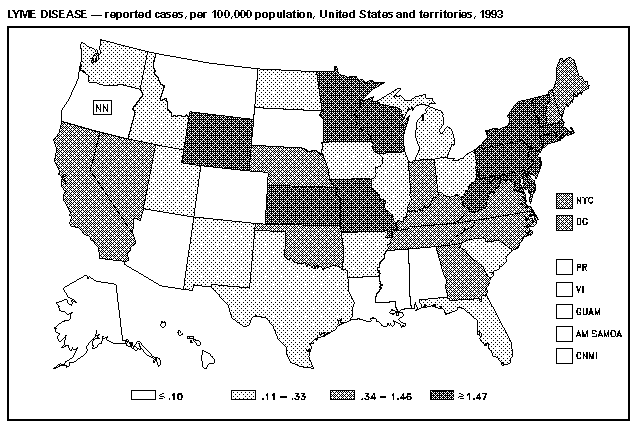 Return to top. Figure_32 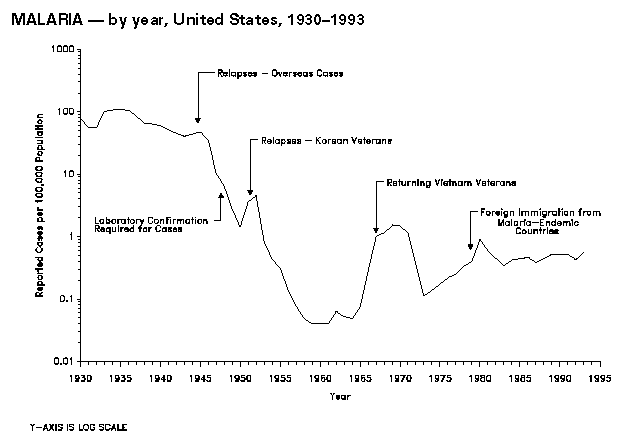 Return to top. Figure_33 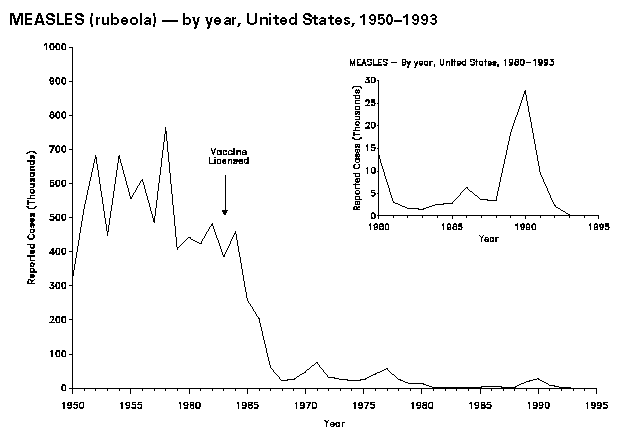 Return to top. Figure_34 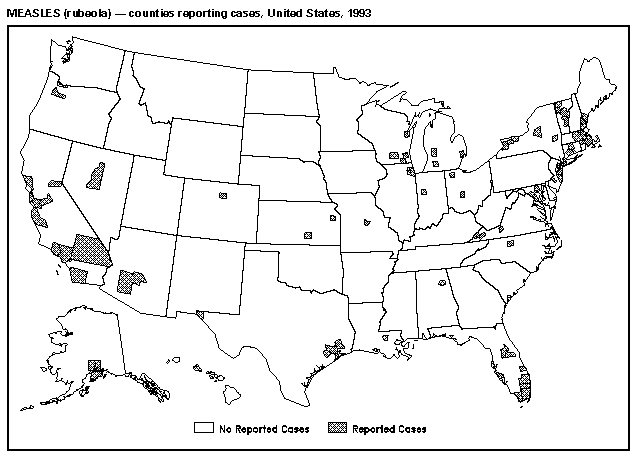 Return to top. Figure_35 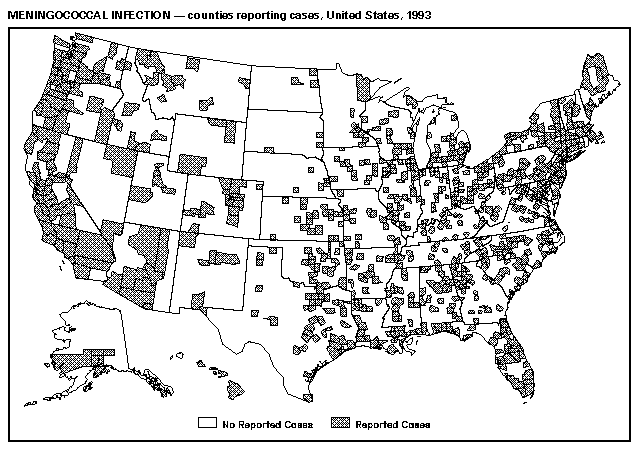 Return to top. Figure_36 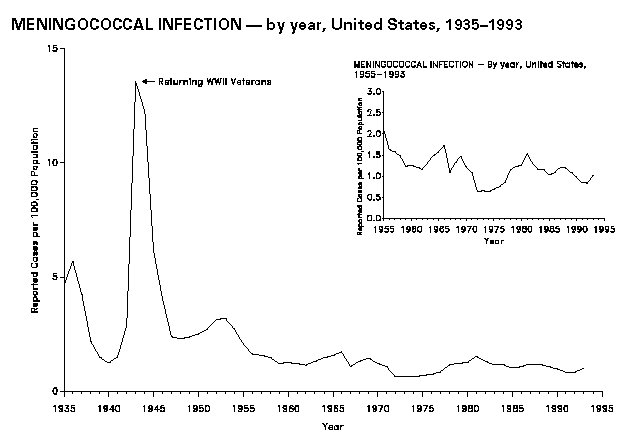 Return to top. Figure_37 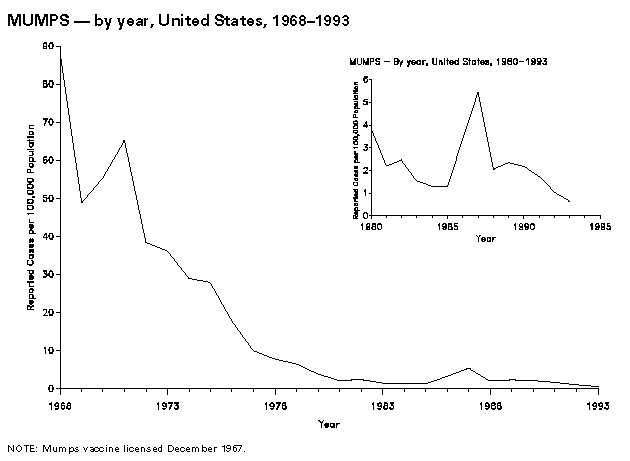 Return to top. Figure_38 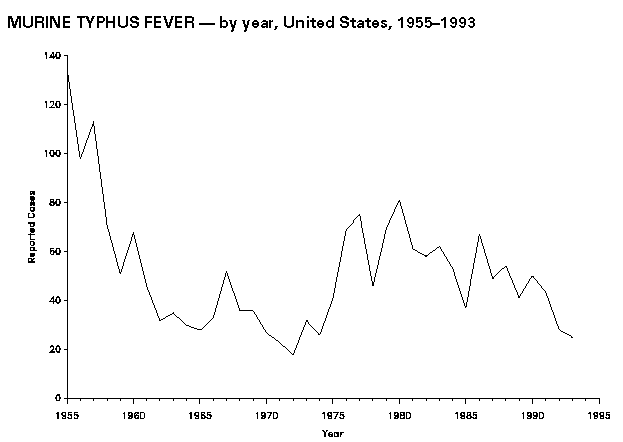 Return to top. Figure_39 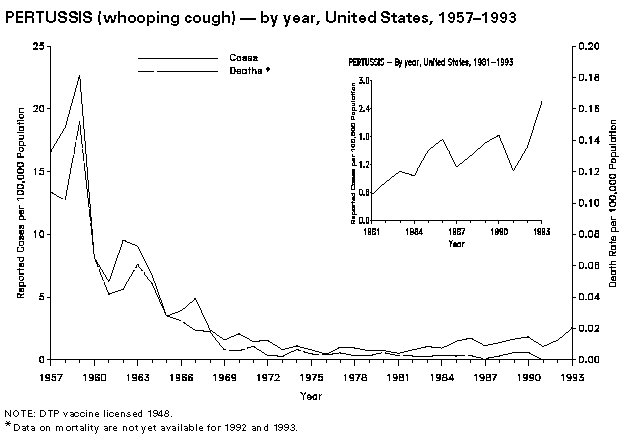 Return to top. Figure_40 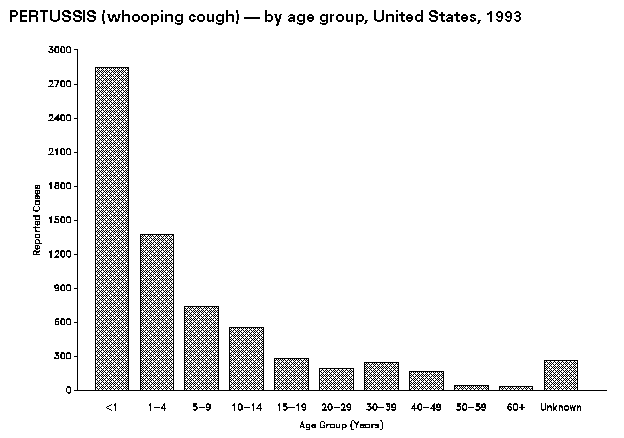 Return to top. Figure_41 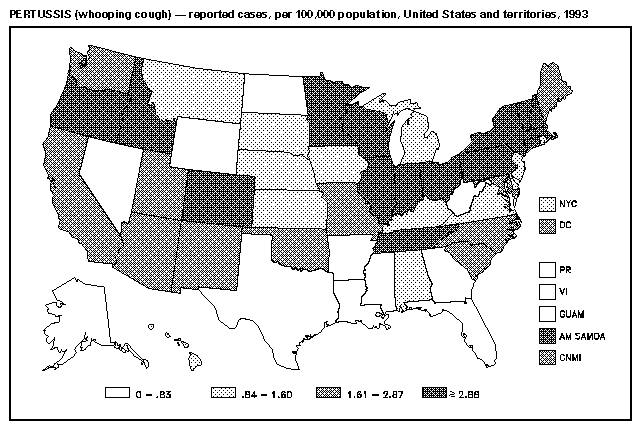 Return to top. Figure_42 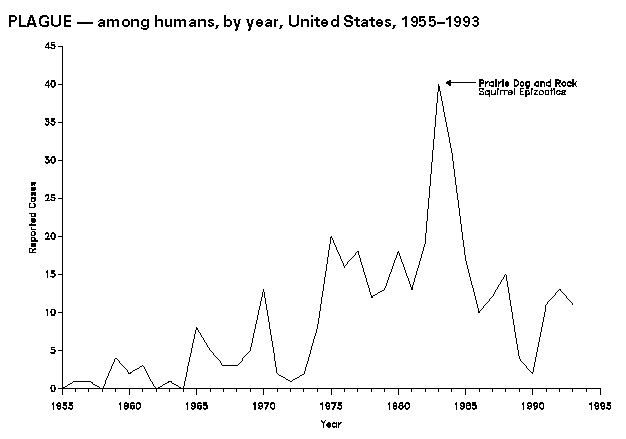 Return to top. Figure_43 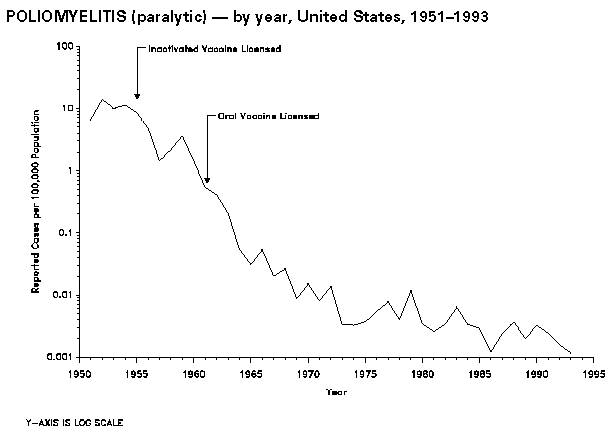 Return to top. Figure_44 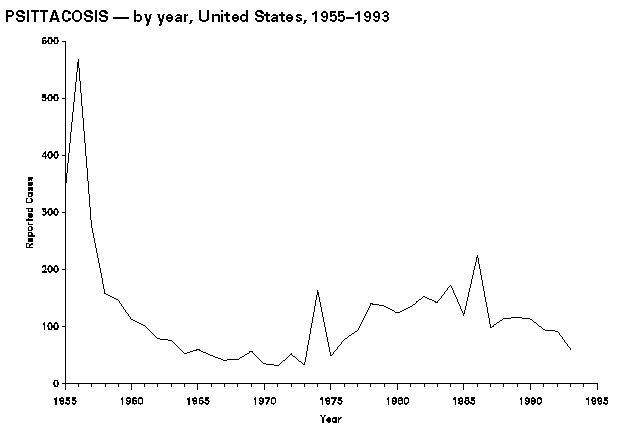 Return to top. Figure_45 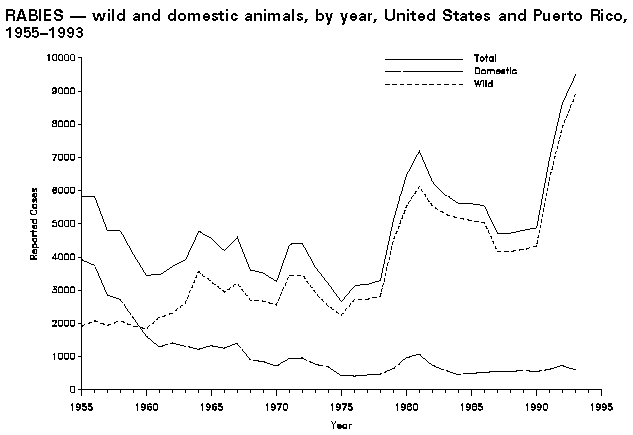 Return to top. Figure_46 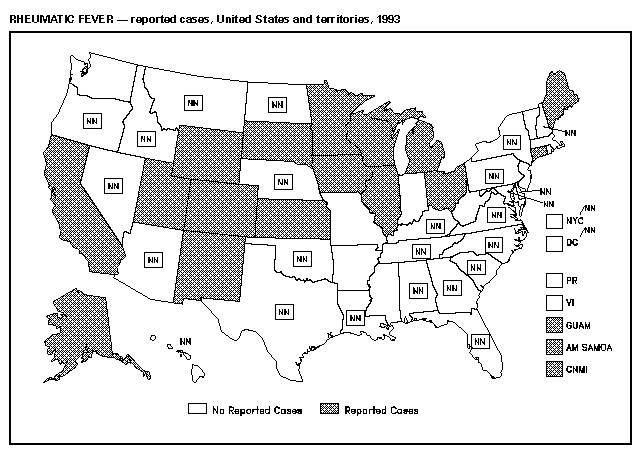 Return to top. Figure_47 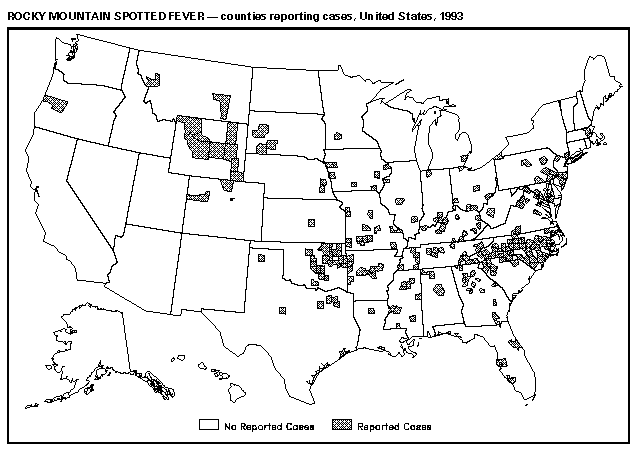 Return to top. Figure_48 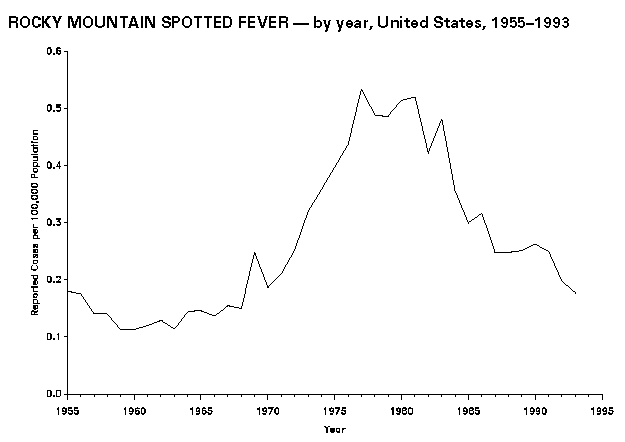 Return to top. Figure_49 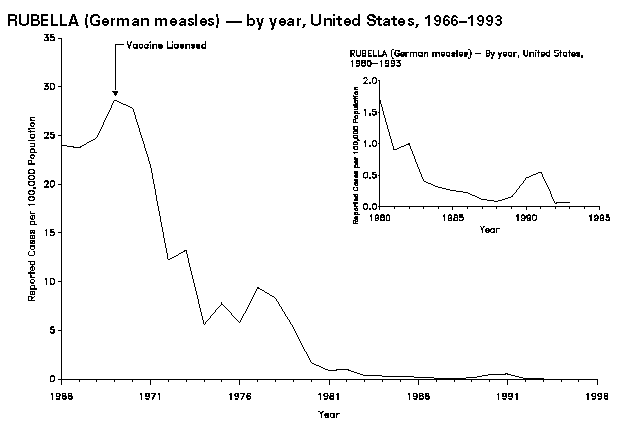 Return to top. Figure_50 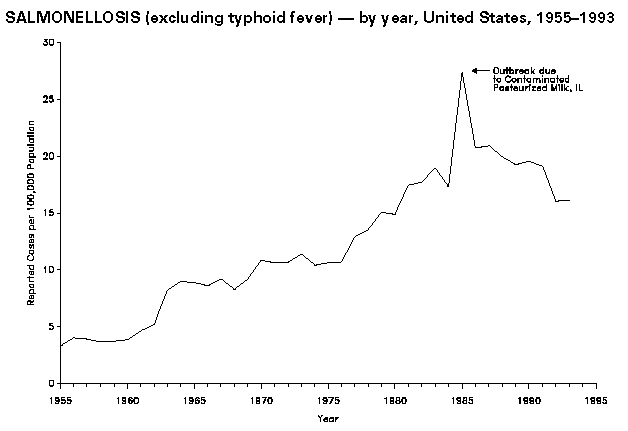 Return to top. Figure_51 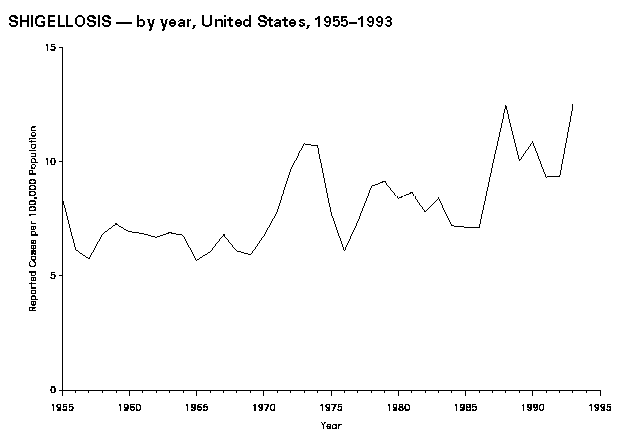 Return to top. Figure_52 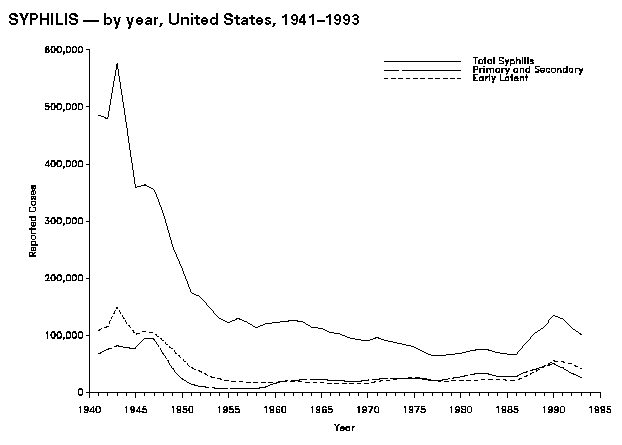 Return to top. Figure_53 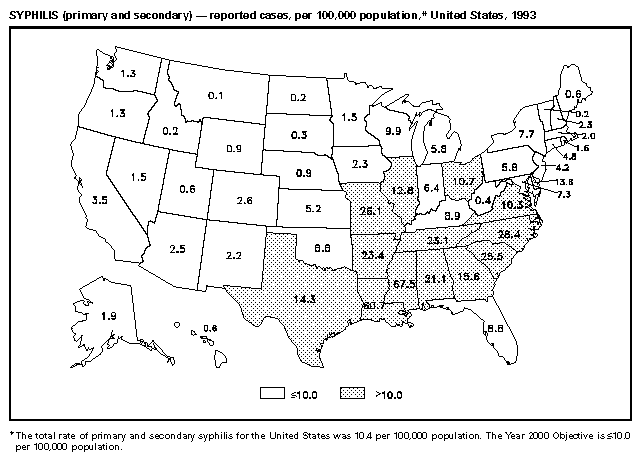 Return to top. Figure_54 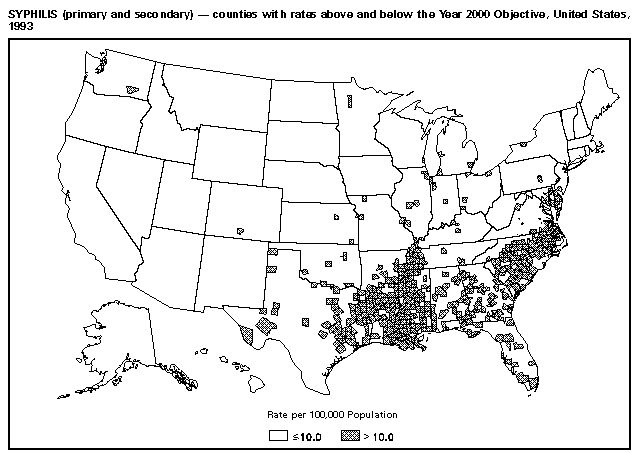 Return to top. Figure_55 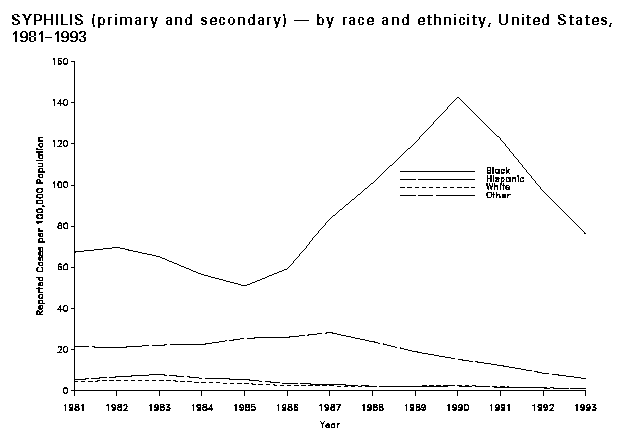 Return to top. Figure_56 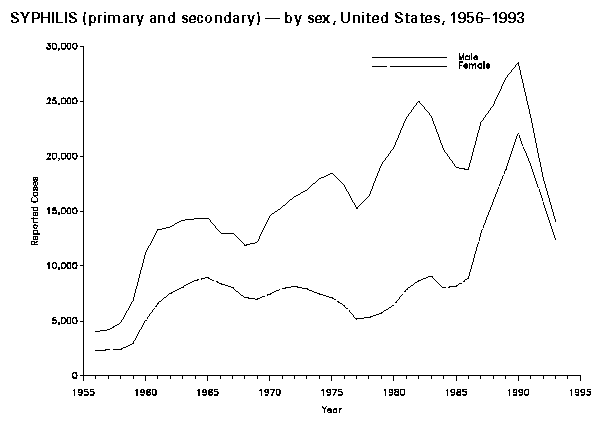 Return to top. Figure_57  Return to top. Figure_58  Return to top. Figure_59  Return to top. Figure_60  Return to top. Figure_61 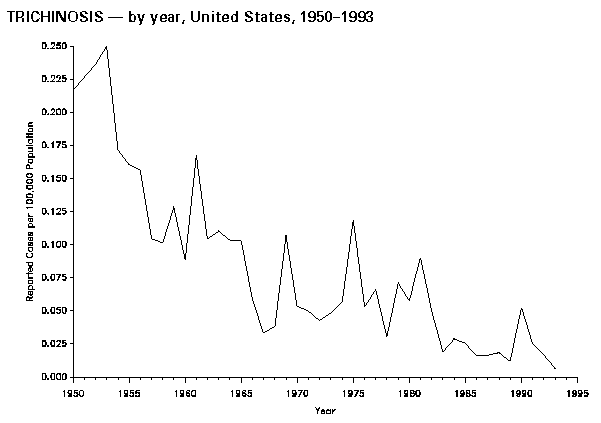 Return to top. Figure_62 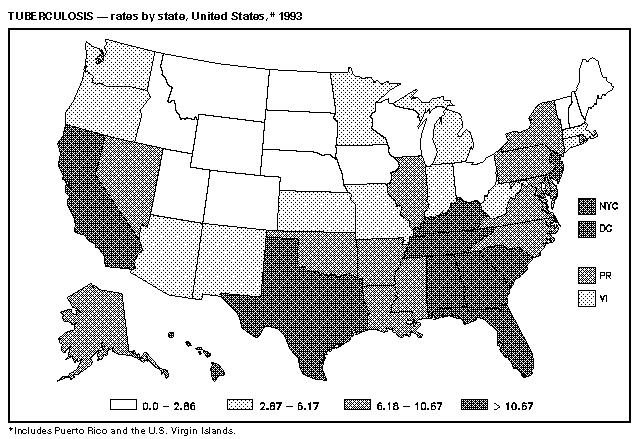 Return to top. Figure_63 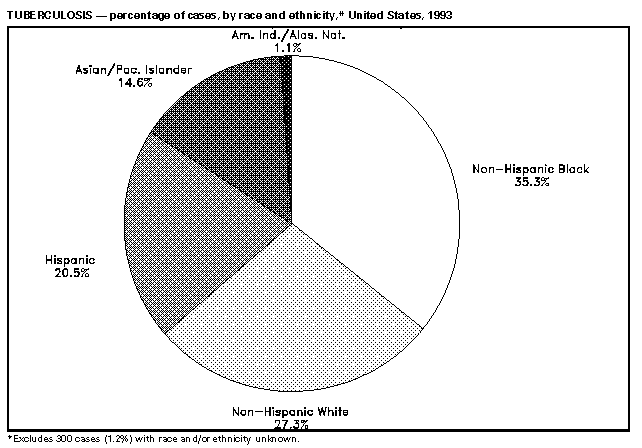 Return to top. Figure_64 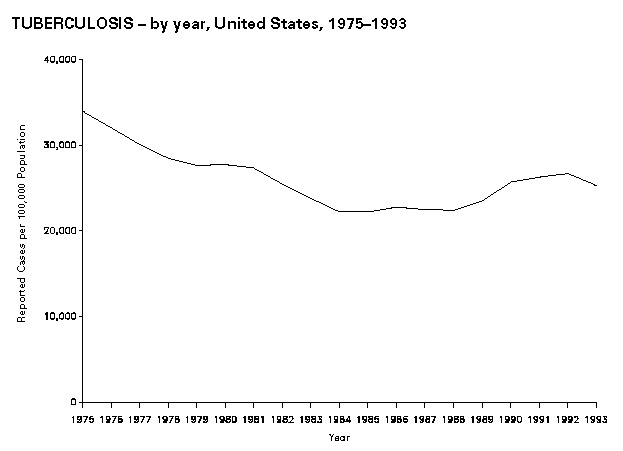 Return to top. Figure_65 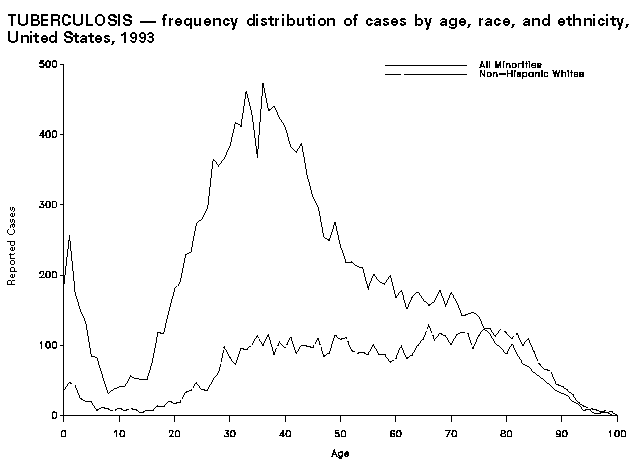 Return to top. Figure_66 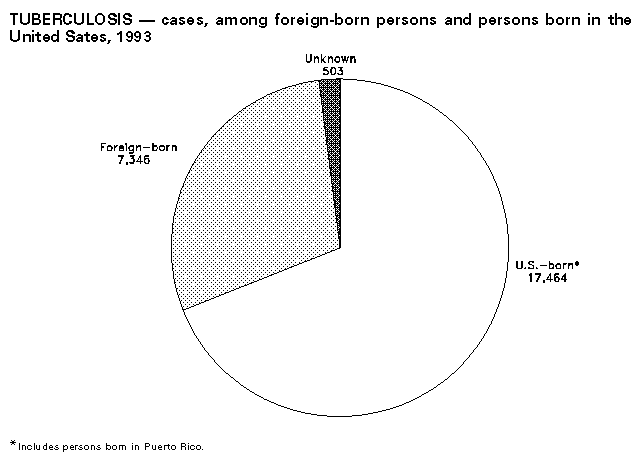 Return to top. Figure_67 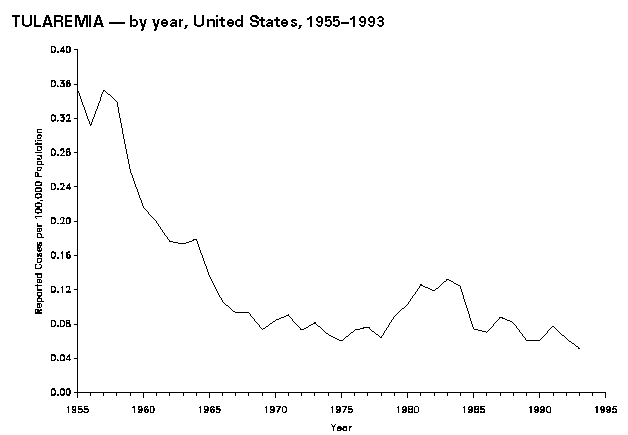 Return to top. Figure_68 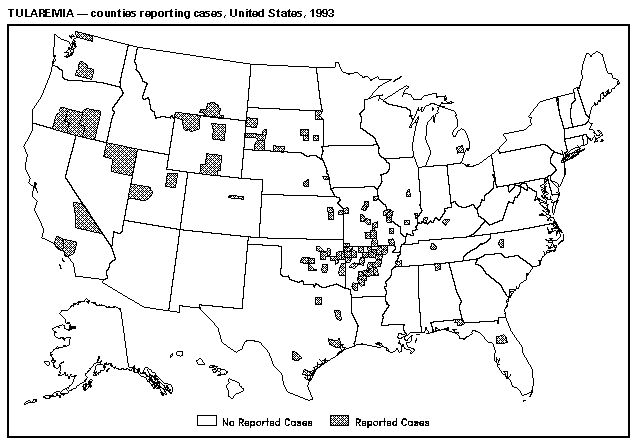 Return to top. Figure_69 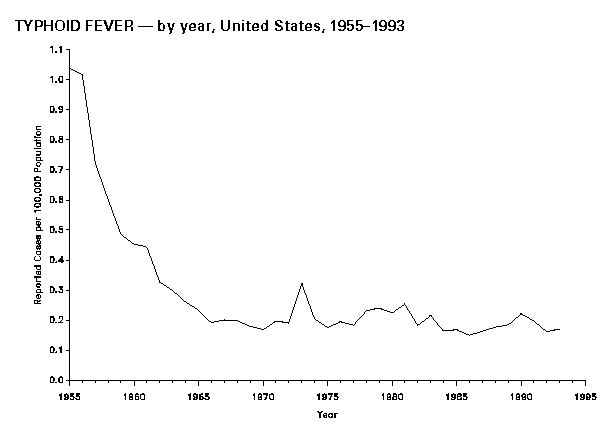 Return to top. Figure_70 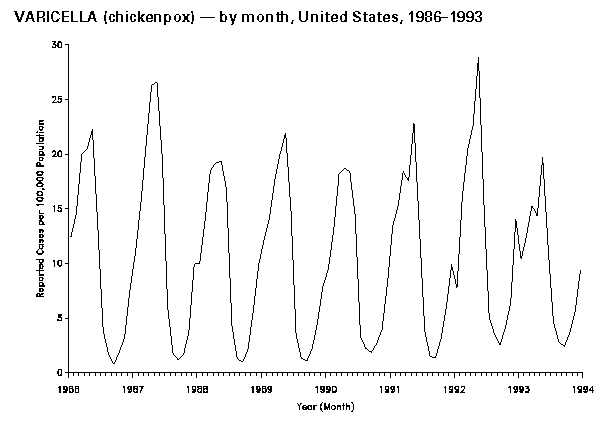 Return to top. TABLE_1 Note: To print large tables and graphs users may have to change their printer settings to landscape and use a small font size. TABLE 1. NOTIFIABLE DISEASES -- summary of reported cases, United States, 1984-1993 ================================================================================================================================================================================================= Disease 1993 1992 1991 1990 1989 1988 1987 1986 1985 1984 -------------------------------------------------------------------------------------------------------------------------------------------------- U.S. total resident population (in thousands) 1990 census; July 1 est. 1984-1989, 1991-1993. 257,908 255,082 252,177 248,710 248,239 245,807 243,400 241,078 238,740 236,158 -------------------------------------------------------------------------------------------------------------------------------------------------- AIDS 103,533 45,472 43,672 41,595 33,722 31,001 21,070 12,932 8,249 4,445 Amebiasis 2,970 2,942 2,989 3,328 3,217 2,860 3,123 3,532 4,433 5,252 Anthrax - 1 - - - 2 1 - - 1 Aseptic meningitis 12,848 12,223 14,526 11,852 10,274 7,234 11,487 11,374 10,619 8,326 Botulism, total (including wound and unsp.) 97 91 114 92 89 84 82 109 122 123 Foodborne 27 21 27 23 23 28 17 23 49 19 Infant 65 66 81 65 60 50 59 79 70 99 -------------------------------------------------------------------------------------------------------------------------------------------------- Brucellosis 120 105 104 85 95 96 129 106 153 131 Chancroid 1,399 1,886 3,476 4,212 4,692 5,001 4,998 3,756 2,067 665 Cholera 18 103 26 6 - 8 6 23 4 1 Diphtheria - 4 5 4 3 2 3 - 3 1 Encephalitis, primary * 919 774 1,021 1,341 981 882 1,418 1,302 1,376 1,257 Post-infectious * 170 129 82 105 88 121 121 124 161 108 -------------------------------------------------------------------------------------------------------------------------------------------------- Gonorrhea 439,673 501,409 620,478 690,169 733,151 719,536 780,905 900,868 911,419 878,556 Granuloma inguinale 19 6 29 97 7 11 22 61 44 30 Haemophilus influenzae 1,419 1,412 2,764 ...................................+............................... Hansen disease (leprosy) 187 172 154 198 163 184 238 270 361 290 Hepatitis A 24,238 23,112 24,378 31,441 35,821 28,507 25,280 23,430 & 23,210 22,040 Hepatitis B 13,361 16,126 18,003 21,102 23,419 23,177 25,916 26,107 & 26,611 26,115 Hepatitis, non-A, non-B @ 4,786 6,010 3,582 2,553 2,529 2,619 2,999 3,634 & 4,184 3,871 Hepatitis, unspecified 627 884 1,260 1,671 2,306 2,470 3,102 3,940 & 5,517 5,531 -------------------------------------------------------------------------------------------------------------------------------------------------- Legionellosis ** 1,280 1,339 1,317 1,370 1,190 1,085 1,038 948 830 750 Leptospirosis 51 54 58 77 93 54 43 41 57 40 Lyme disease 8,257 9,895 9,465 ...................................+............................... Lymphogranuloma venereum 285 302 471 277 189 185 303 396 226 170 Malaria 1,411 1,087 1,278 1,292 1,277 1,099 944 1,123 1,049 1,007 -------------------------------------------------------------------------------------------------------------------------------------------------- Measles (rubeola) 312 2,237 9,643 27,786 18,193 3,396 3,655 6,282 2,822 2,587 Meningococcal infections 2,637 2,134 2,130 2,451 2,727 2,964 2,930 2,594 2,479 2,746 Mumps 1,692 2,572 4,264 5,292 5,712 4,866 12,848 7,790 2,982 3,021 Murine typhus fever 25 28 43 50 41 54 49 67 37 53 Pertussis (whooping cough) 6,586 4,083 2,719 4,570 4,157 3,450 2,823 4,195 3,589 2,276 Plague 10 13 11 2 4 15 12 10 17 31 -------------------------------------------------------------------------------------------------------------------------------------------------- Poliomyelitis, paralytic ++ 3 6 9 6 9 9 9 9 7 8 Psittacosis 60 92 94 113 116 114 98 224 119 172 Rabies, animal 9,377 8,589 6,910 4,826 4,724 4,651 4,658 5,504 5,565 5,567 Rabies, human 3 1 3 1 1 - 1 - 1 3 Rheumatic fever, acute 112 75 127 108 144 158 141 147 90 117 -------------------------------------------------------------------------------------------------------------------------------------------------- Rocky Mountain spotted fever 456 502 628 651 623 609 604 760 714 838 Rubella (German measles) 192 160 1,401 1,125 396 225 306 551 630 752 Rubella, congenital syndrome 5 11 47 11 3 6 5 14 - 5 Salmonellosis, excluding typhoid fever 41,641 40,912 48,154 48,603 47,812 48,948 50,916 49,984 65,347 40,861 Shigellosis 32,198 23,931 23,548 27,077 25,010 30,617 23,860 17,138 17,057 17,371 Smallpox .............................Last documented case occurred in 1949.............................. Syphilis, primary and secondary 26,498 33,973 42,935 50,223 44,540 40,117 35,147 27,883 27,131 28,607 -------------------------------------------------------------------------------------------------------------------------------------------------- Total, all stages 101,259 112,581 128,569 134,255 110,797 103,437 86,545 68,215 67,563 69,888 Tetanus 48 45 57 64 53 53 48 64 83 74 Toxic-shock syndrome 212 244 280 322 400 390 372 412 384 482 Trichinosis 16 41 62 129 30 45 40 39 61 68 Tuberculosis 25,313 26,673 26,283 25,701 23,495 22,436 22,517 22,768 22,201 22,255 Tularemia 132 159 193 152 152 201 214 170 177 291 Typhoid fever 440 414 501 552 460 436 400 362 402 390 Varicella (chickenpox) 134,722 158,364 147,076 173,099 185,441 192,857 213,196 183,243 178,162 221,983 Yellow fever .....................Last indigenous case reported 1911; last imported, 1924..................... -------------------------------------------------------------------------------------------------------------------------------------------------- * Beginning in 1984, data reflects change in categories for tabulating encephalitis reports that were recorded by date of report to state health departments. Data for previous years are from surveillance records reported by onset date. + Not previously notifiable nationally. & Reports from New York City are not available. @ The number of reported cases of non-A, non-B hepatitis is misleading because in some states, reported cases included persons positive for antibody to hepatitis C virus (anti-HCV) identified in routine screening programs but who did not have acute hepatitis. ** Data are recorded by date of report to the state health department. Data for all years previous to 1982 are from surveillance records reported by onset date. ++ Annual case reports from state health departments; numbers may not reflect changes based on retrospective case evaluations or late reports (see MMWR 1986;35:180-2). ================================================================================================================================================================================================= Return to top. TABLE_2 Note: To print large tables and graphs users may have to change their printer settings to landscape and use a small font size. TABLE 2. NOTIFIABLE DISEASES -- summary of reported cases, per 100,000 population, United States, 1984-1993 ====================================================================================================================================================================================== Disease 1993 1992 1991 1990 1989 1988 1987 1986 1985 1984 ------------------------------------------------------------------------------------------------------------------------------------- AIDS 40.20 17.83 17.32 16.72 13.58 12.61 8.66 5.36 3.46 1.88 Amebiasis 1.21 1.21 1.23 1.38 1.34 1.20 1.33 1.47 1.92 2.30 Anthrax 0.00 0.00 0.00 0.00 0.00 0.00 0.00 0.00 0.00 0.00 Aseptic meningitis 5.39 5.18 6.26 4.77 4.14 2.94 4.72 4.72 4.50 3.57 Botulism, total (including wound and unsp.) 0.04 0.04 0.05 0.04 0.04 0.03 0.03 0.05 0.05 0.05 Foodborne 0.01 0.00 0.01 0.01 0.01 0.01 0.01 0.01 0.02 0.01 Infant 0.03 0.03 0.03 0.03 0.02 0.02 0.02 0.03 0.03 0.04 ------------------------------------------------------------------------------------------------------------------------------------- Brucellosis 0.05 0.04 0.04 0.03 0.04 0.04 0.05 0.04 0.06 0.06 Chancroid * 0.54 0.80 1.40 1.70 1.90 2.04 2.07 1.57 0.87 0.28 Cholera 0.00 0.04 0.01 0.00 0.00 0.00 0.00 0.01 0.00 0.00 Diphtheria 0.00 0.00 0.00 0.00 0.00 0.00 0.00 0.00 0.00 0.00 ------------------------------------------------------------------------------------------------------------------------------------- Encephalitis, primary 0.36 0.30 0.40 0.54 0.40 0.36 0.58 0.54 0.58 0.53 Post-infectious 0.07 0.05 0.03 0.04 0.04 0.05 0.05 0.05 0.07 0.05 Gonorrhea * 172.40 201.60 249.48 276.60 297.36 298.74 323.14 376.37 384.51 374.75 Granuloma inguinale * 0.00 0.00 0.01 0.00 0.00 0.00 0.01 0.03 0.02 0.01 ------------------------------------------------------------------------------------------------------------------------------------- Haemophilus influenzae 0.55 0.55 1.10 ...........................+.............................. Hansen disease (leprosy) 0.07 0.07 0.06 0.08 0.07 0.07 0.10 0.11 0.15 0.12 Hepatitis A 9.40 9.06 9.67 12.64 14.43 11.60 10.39 10.02 10.03 9.33 Hepatitis B 5.18 6.32 7.14 8.48 9.43 9.43 10.65 11.17 11.50 11.06 Hepatitis, non-A, non-B & 1.86 2.36 1.42 1.03 1.02 1.07 1.23 1.55 l.81 1.64 Hepatitis, unspecified 0.24 0.35 0.50 0.67 0.93 1.00 1.27 1.69 2.38 2.34 ------------------------------------------------------------------------------------------------------------------------------------- Legionellosis 0.50 0.53 0.53 0.55 0.48 0.44 0.43 0.43 0.37 0.35 Leptospirosis 0.02 0.02 0.02 0.03 0.04 0.02 0.02 0.02 0.02 0.02 Lyme disease 3.20 0.12 3.80 ...........................+.............................. Lymphogranuloma venereum * 0.10 0.10 0.19 0.10 0.08 0.07 0.13 0.16 0.10 0.07 Malaria 0.55 0.43 0.51 0.52 0.51 0.45 0.39 0.47 0.44 0.43 ------------------------------------------------------------------------------------------------------------------------------------- Measles (rubeola) 0.12 0.88 3.82 11.17 7.33 1.38 1.50 2.61 1.18 1.10 Meningococcal infections 1.02 0.84 0.84 0.99 1.10 1.21 1.20 1.08 1.04 1.16 Mumps 0.66 1.03 1.72 2.17 2.34 2.05 5.43 3.37 1.30 1.32 Murine typhus fever 0.01 0.01 0.02 0.02 0.02 0.02 0.02 0.03 0.02 0.02 Pertussis (whooping cough) 2.55 1.60 1.08 1.84 1.67 1.40 1.16 1.74 1.50 0.96 ------------------------------------------------------------------------------------------------------------------------------------- Plague 0.00 0.01 0.00 0.00 0.00 0.01 0.00 0.00 0.01 0.01 Poliomyelitis, paralytic 0.00 0.00 0.00 0.00 0.00 0.00 0.00 0.00 0.00 0.00 Psittacosis 0.02 0.04 0.04 0.05 0.05 0.05 0.04 0.09 0.05 0.07 Rabies, human 0.00 0.00 0.00 0.00 0.00 0.00 0.00 0.00 0.00 0.00 Rheumatic fever, acute 0.08 0.06 0.12 0.09 0.13 0.14 0.13 0.12 0.07 0.08 ------------------------------------------------------------------------------------------------------------------------------------- Rocky Mountain spotted fever 0.18 0.20 0.25 0.26 0.25 0.25 0.25 0.32 0.30 0.36 Rubella (German measles) 0.07 0.06 0.56 0.45 0.16 0.09 0.13 0.23 0.26 0.32 Rubella, congenital syndrome 0.00 0.00 0.01 0.00 0.00 0.00 0.00 0.00 0.00 0.00 Salmonellosis, excluding typhoid fever 16.15 16.04 19.10 19.54 19.26 19.91 20.92 20.73 27.37 17.30 Shigellosis 12.48 9.38 9.34 10.89 10.07 12.46 9.80 7.11 7.14 7.36 ------------------------------------------------------------------------------------------------------------------------------------- Smallpox .....................Last documented case occurred in 1949............................. Syphilis, primary and secondary * 10.40 13.70 17.26 20.10 18.07 16.43 14.54 11.65 11.45 12.20 Total, all stages * 39.70 45.30 51.69 53.80 44.94 42.37 35.81 28.50 28.50 29.81 Tetanus 0.02 0.02 0.02 0.03 0.02 0.02 0.02 0.03 0.03 0.03 Toxic-shock syndrome 0.08 0.10 0.11 0.13 0.16 0.16 0.15 0.19 0.18 0.24 Trichinosis 0.01 0.02 0.02 0.05 0.01 0.02 0.02 0.02 0.03 0.03 Tuberculosis 9.82 10.46 10.42 10.33 9.46 9.13 9.25 9.44 9.30 9.42 Tularemia 0.05 0.06 0.08 0.06 0.06 0.08 0.09 0.07 0.07 0.12 Typhoid fever 0.17 0.16 0.20 0.22 0.19 0.18 0.16 0.15 0.17 0.17 Varicella (chickenpox) 118.54 176.54 135.82 120.06 121.77 122.43 136.68 122.42 123.23 138.44 Yellow fever .................Last indigenous case reported 1911; last imported, 1924............... ------------------------------------------------------------------------------------------------------------------------------------- NOTE: Rates <0.01 after rounding are shown as 0.00. * Post-censal population data from 1992 were used to calculate 1993 rates. + Not previously notifiable nationally. & The number of reported cases of non-A, non-B hepatitis is misleading because in some states, reported cases included persons positive for antibody to hepatitis C virus (anti-HCV) identified in routine screening programs but who did not have acute hepatitis. @ Per 1,000 live births. ====================================================================================================================================================================================== Return to top. TABLE_3 Note: To print large tables and graphs users may have to change their printer settings to landscape and use a small font size. TABLE 3. NOTIFIABLE DISEASES -- summary of reported cases, United States, 1974-1983 ========================================================================================================================================================== Disease 1983 1982 1981 1980 1979 1978 1977 1976 1975 1974 -------------------------------------------------------------------------------------------------------------------------------------------------- U.S. total resident population (in thousands) 1980 census; July 1 est. 1974-1979, 1981-1983 233,981 231,534 229,307 226,505 220,099 218,059 216,332 214,659 213,121 211,390 -------------------------------------------------------------------------------------------------------------------------------------------------- Amebiasis 6,658 7,304 6,632 5,271 4,107 3,937 3,044 2,906 2,775 2,743 Anthrax - - - 1 - 6 - 2 2 2 Aseptic meningitis 12,696 9,680 9,547 8,028 8,754 6,573 4,789 3,510 4,475 3,197 Botulism, total (including wound and unsp.) 133 97 103 89 45 105 129 55 20 28 Brucellosis 200 173 185 183 215 179 232 296 310 240 -------------------------------------------------------------------------------------------------------------------------------------------------- Chancroid 847 1,392 850 788 840 521 455 628 700 945 Cholera 1 - 19 9 1 12 3 - - - Diphtheria 5 2 5 3 59 76 84 128 307 272 Encephalitis, primary 1,761 1,464 1,492 1,362 1,504 1,351 1,414 1,651 4,064 1,164 Post-infectious 34 36 43 40 84 78 119 175 237 218 -------------------------------------------------------------------------------------------------------------------------------------------------- Gonorrhea 900,435 960,633 990,864 1,004,029 1,004,058 1,013,436 1,002,219 1,001,994 999,937 906,121 Granuloma inguinale 24 17 66 51 76 72 75 71 60 47 Hansen disease (leprosy) 259 250 256 223 185 168 151 145 162 118 Hepatitis A 21,532 23,403 25,802 29,087 30,407 29,500 31,153 33,288 35,855 40,358 Hepatitis B 24,318 22,177 21,152 19,015 15,452 15,016 16,831 14,973 13,121 10,631 Hepatitis, non-A, non-B 3,470 ...........................................*........................................... Hepatitis, unspecified 7,149 8,564 10,975 11,894 10,534 8,776 8,639 7,488 7,158 8,351 Legionellosis + 852 654 408 475 593 761 359 235 ........*........ -------------------------------------------------------------------------------------------------------------------------------------------------- Leptospirosis 61 100 82 85 94 110 71 73 93 68 Lymphogranuloma venereum 335 235 263 199 250 284 348 365 353 394 Malaria 813 1,056 1,388 2,062 894 731 547 471 373 293 Measles (rubeola) 1,497 1,714 3,124 13,506 13,597 26,871 57,345 41,126 24,374 22,094 Meningococcal infections 2,736 3,056 3,525 2,840 2,724 2,505 1,828 1,605 1,478 1,346 -------------------------------------------------------------------------------------------------------------------------------------------------- Mumps 3,355 5,270 4,941 8,576 14,225 16,817 21,436 38,492 59,647 59,128 Murine typhus fever 62 58 61 81 69 46 75 69 41 26 Pertussis (whooping cough) 2,463 1,895 1,248 1,730 1,623 2,063 2,177 1,010 1,738 2,402 Plague 40 19 13 18 13 12 18 16 20 8 Poliomyelitis, total 15 8 6 9 34 15 18 14 8 7 Paralytic 15 8 6 8 26 9 17 12 8 7 -------------------------------------------------------------------------------------------------------------------------------------------------- Psittacosis 142 152 136 124 137 140 94 78 49 164 Rabies, animal 5,878 6,212 7,118 6,421 5,119 3,254 3,130 3,073 2,627 3,151 Rabies, human 2 - 2 - 4 4 1 2 2 - Rheumatic fever, acute 88 137 264 432 629 851 1,738 1,865 2,854 2,431 -------------------------------------------------------------------------------------------------------------------------------------------------- Rocky Mountain spotted fever 1,126 976 1,192 1,163 1,070 1,063 1,153 937 844 754 Rubella (German measles) 970 2,325 2,077 3,904 11,795 18,269 20,395 12,491 16,652 11,917 Rubella, congenital syndrome 22 7 19 50 62 30 23 30 30 45 Salmonellosis, excluding typhoid fever 44,250 40,936 39,990 33,715 33,138 29,410 27,850 22,937 22,612 21,980 Shigellosis 19,719 18,129 19,859 19,041 20,135 19,511 16,052 13,140 16,584 22,600 -------------------------------------------------------------------------------------------------------------------------------------------------- Smallpox ..............................Last documented case occurred in 1949.............................. Syphilis, primary and secondary 32,698 33,613 31,266 27,204 24,874 21,656 20,399 23,731 25,561 25,385 Total, all stages 74,637 75,579 72,799 68,832 67,049 64,875 64,621 71,761 80,356 83,771 Tetanus 91 88 72 95 81 86 87 75 102 101 Toxic-shock syndrome 502 ...........................................*........................................... Trichinosis 45 115 206 131 157 67 143 115 252 120 -------------------------------------------------------------------------------------------------------------------------------------------------- Tuberculosis & 23,846 25,520 27,373 27,749 27,669 28,521 30,145 32,105 33,989 30,122 Tularemia 310 275 288 234 196 141 165 157 129 144 Typhoid fever 507 425 584 510 528 505 398 419 375 437 Varicella (chickenpox) 177,462 167,423 200,766 190,894 199,081 154,089 188,396 183,990 154,248 141,495 Yellow fever .....................Last indigenous case reported 1911, last imported 1924...................... -------------------------------------------------------------------------------------------------------------------------------------------------- * Not previously notifiable nationally. + Data for 1982-1983 recorded by date of report to the state health department. Data for 1976-1981 are from surveillance records reported by onset date. & Case data subsequent to 1974 are not comparable to prior years due to changes in reporting criteria that became effective in 1975. ========================================================================================================================================================== Return to top. TABLE_4 Note: To print large tables and graphs users may have to change their printer settings to landscape and use a small font size. TABLE 4. NOTIFIABLE DISEASES -- summary of reported cases, United States, 1964-1973 ==================================================================================================================================================== Disease 1973 1972 1971 1970 1969 1968 1967 1966 1965 1964 -------------------------------------------------------------------------------------------------------------------------------------------------- U.S. total resident population, July 1, estimate (in thousands) 209,851 208,232 206,256 203,805 201,385 199,399 197,457 195,576 193,526 191,141 -------------------------------------------------------------------------------------------------------------------------------------------------- Amebiasis 2,235 2,199 2,752 2,888 2,915 3,005 3,157 2,921 2,768 3,304 Anthrax 2 2 5 2 4 3 2 5 7 5 Aseptic meningitis 4,846 4,634 5,176 6,480 3,672 4,494 3,082 3,058 2,329 2,177 Botulism 34 22 25 12 16 7 5 9 19 23 Brucellosis 202 196 183 213 235 218 265 262 262 411 Chancroid 1,165 1,414 1,320 1,416 1,104 845 784 838 982 1,247 -------------------------------------------------------------------------------------------------------------------------------------------------- Cholera 1 - 1 - - - - - 2 - Diphtheria 228 152 215 435 241 260 219 209 164 293 Encephalitis, primary 1,613 1,059 1,524 1,580 1,613 1,781 1,478 2,121 1,722 2,002 Post-infectious 354 243 439 370 304 502 1,060 964 981 1,585 Gonorrhea 842,621 767,215 670,268 600,072 534,872 464,543 404,836 351,738 324,925 300,666 Granuloma inguinale 62 81 89 124 154 156 154 148 155 135 Hansen disease (leprosy) 146 130 131 129 98 123 81 109 96 97 Hepatitis A 50,749 54,074 59,606 56,797 48,416 45,893 38,909 32,859 33,856 * 37,740 * Hepatitis B 8,451 9,402 9,556 8,310 5,909 4,829 2,458 1,497 Leptospirosis 57 41 62 47 89 69 67 72 84 142 -------------------------------------------------------------------------------------------------------------------------------------------------- Lymphogranuloma venereum 408 756 692 612 520 485 371 308 878 732 Malaria 237 742 2,375 3,051 3,102 2,317 2,022 565 147 93 Measles (rubeola) 26,690 32,275 75,290 47,351 25,826 22,231 62,705 204,136 261,904 458,083 Meningococcal infections 1,378 1,323 2,262 2,505 2,951 2,623 2,161 3,381 3,040 2,826 -------------------------------------------------------------------------------------------------------------------------------------------------- Mumps 69,612 74,215 124,939 104,953 90,918 152,209 ..................+.................. Murine typhus fever 32 18 23 27 36 36 52 33 28 30 Pertussis (whooping cough) 1,759 3,287 3,036 4,249 3,285 4,810 9,718 7,717 6,799 13,005 Plague 2 1 2 13 5 3 3 5 8 - Poliomyelitis, total 8 31 21 33 20 53 41 113 72 122 Paralytic 7 29 17 31 18 53 40 106 61 106 -------------------------------------------------------------------------------------------------------------------------------------------------- Psittacosis 33 52 32 35 57 43 41 50 60 53 Rabies, animal 3,640 4,369 4,310 3,224 3,490 3,591 4,481 4,178 4,574 4,780 Rabies, human 1 2 2 3 1 1 2 1 2 1 Rheumatic fever, acute 2,560 2,614 2,793 3,227 3,229 3,470 3,985 4,472 4,998 7,491 Rocky Mountain spotted fever 668 523 432 380 498 298 305 268 281 277 Rubella (German measles) 27,804 25,507 45,086 56,552 57,686 49,371 46,888 46,975 ........+........ -------------------------------------------------------------------------------------------------------------------------------------------------- Rubella, congenital syndrome 35 42 68 77 31 14 10 11 ........+........ Salmonellosis, excluding typhoid fever 23,818 22,151 21,928 22,096 18,419 16,514 18,120 16,841 17,161 17,144 Shigellosis 22,642 20,207 16,143 13,845 11,946 12,180 13,474 11,888 11,027 12,984 Smallpox ..............................Last documented case occurred in 1949.............................. Streptococcal sore throat and scarlet fever NN NN NN 433,405 450,008 435,013 453,351 427,752 395,168 402,334 -------------------------------------------------------------------------------------------------------------------------------------------------- Syphilis, primary and secondary 24,825 24,429 23,783 21,982 19,130 19,019 21,053 21,414 23,338 22,969 Total, all stages 87,469 91,149 95,997 91,382 92,162 96,271 102,581 105,159 112,842 114,325 Tetanus 101 128 116 148 192 178 263 235 300 289 Trichinosis 102 89 103 109 215 77 66 115 199 198 Tuberculosis & 30,998 32,882 35,217 37,137 39,120 42,623 45,647 47,767 49,016 50,874 Tularemia 171 152 187 172 149 186 184 208 264 342 Typhoid fever 680 398 407 346 364 395 396 378 454 501 Varicella (chickenpox) 182,927 164,114 ......................................+...................................... Yellow fever .....................Last indigenous case reported 1911; last imported, 1924..................... -------------------------------------------------------------------------------------------------------------------------------------------------- * Includes Hepatitis B. + Not previously notifiable nationally. & Includes new active cases. ==================================================================================================================================================== Return to top. TABLE_5 Note: To print large tables and graphs users may have to change their printer settings to landscape and use a small font size. TABLE 5. NOTIFIABLE DISEASES -- summary of reported cases, United States, 1954-1963 ==================================================================================================================================================== Disease 1963 1962 1961 1960 1959 1958 1957 1956 1955 1954 -------------------------------------------------------------------------------------------------------------------------------------------------- U.S. total resident population, July 1, estimate (in thousands) 188,483 185,771 182,992 179,979 176,513 173,320 170,371 167,306 164,308 161,164 -------------------------------------------------------------------------------------------------------------------------------------------------- Amebiasis 2,886 3,048 2,850 3,424 3,508 4,380 5,031 3,689 3,348 3,523 Anthrax 3 9 14 23 12 16 26 38 39 22 Aseptic meningitis 1,844 2,654 5,162 * 1,593 ............................+............................ Botulism 47 10 14 12 20 6 28 17 16 18 Brucellosis 407 409 636 751 892 924 983 1,300 1,444 1,823 -------------------------------------------------------------------------------------------------------------------------------------------------- Chancroid 1,220 1,344 1,438 1,680 1,537 1,595 1,637 2,135 2,649 3,003 Cholera - - - - - - - - - - Dengue NN NN - - - - - 2 1 6 Diphtheria 314 444 617 918 934 918 1,211 1,568 1,984 2,041 Encephalitis, acute infectious 1,993 2,094 2,248 2,341 2,347 2,587 2,135 2,624 2,166 2,606 -------------------------------------------------------------------------------------------------------------------------------------------------- Gonorrhea 278,289 263,714 264,158 258,933 240,254 232,386 214,496 224,346 236,197 242,050 Granuloma inguinale 173 207 241 296 265 314 348 357 490 618 Hansen disease (leprosy) 103 80 63 54 44 39 36 52 75 56 Hepatitis & 42,974 53,016 72,651 41,666 23,574 16,294 14,922 19,234 31,961 50,093 Leptospirosis 89 79 71 53 83 55 47 44 24 48 -------------------------------------------------------------------------------------------------------------------------------------------------- Lymphogranuloma venereum 586 590 787 835 604 434 448 500 762 875 Malaria 99 118 73 72 71 85 132 234 522 715 Measles (rubeola) 385,156 481,530 423,919 441,703 406,162 763,094 486,799 611,936 555,156 682,720 Meningococcal infections 2,470 2,150 2,232 2,259 2,180 2,581 2,691 2,735 3,455 4,436 Murine typhus fever 35 32 46 68 51 71 113 98 135 163 -------------------------------------------------------------------------------------------------------------------------------------------------- Pertussis (whooping cough) 17,135 17,749 11,468 14,809 40,005 32,148 28,295 31,732 62,786 60,886 Plague 1 - 3 2 4 - 1 1 - - Poliomyelitis, total 449 910 1,312 3,190 8,425 5,787 5,485 15,140 28,985 38,476 Paralytic 396 762 988 2,525 6,289 3,697 2,499 7,911 13,850 18,308 Psittacosis 76 79 102 113 147 158 278 568 334 563 Rabies, animal 3,929 3,732 3,599 3,567 4,177 4,787 4,542 5,681 5,799 7,297 -------------------------------------------------------------------------------------------------------------------------------------------------- Rabies, human @ 1 2 3 2 7 5 5 10 4 13 Rheumatic fever, acute 7,561 7,977 10,470 9,022 8,285 6,889 6,427 6,562 ........+........ Rocky Mountain spotted fever 216 240 219 204 199 243 240 293 295 294 Salmonellosis, excluding typhoid fever 15,390 9,680 8,542 6,929 6,606 6,363 6,693 6,704 5,447 5,375 Shigellosis 13,009 12,443 12,571 12,487 12,888 11,861 9,822 10,306 13,912 13,846 Smallpox ..............................Last documented case occurred in 1949.............................. -------------------------------------------------------------------------------------------------------------------------------------------------- Streptococcal sore throat and scarlet fever 342,161 315,809 338,410 315,173 334,715 264,097 226,973 176,392 147,502 147,785 Syphilis, primary and secondary 22,251 21,067 19,851 16,145 9,799 7,176 6,576 6,392 6,454 7,147 Total, all stages 124,137 126,245 124,658 122,538 120,824 113,884 123,758 130,201 122,392 130,697 Tetanus 325 322 379 368 445 445 447 468 462 524 Trichinosis 208 194 306 160 227 176 178 262 264 277 -------------------------------------------------------------------------------------------------------------------------------------------------- Tuberculosis ** 54,042 53,315 53,726 55,494 57,535 63,534 67,149 69,895 77,368 79,775 Tularemia 327 328 365 390 459 587 601 522 584 681 Typhoid fever 566 608 814 816 859 1,043 1,231 1,700 1,704 2,169 Yellow fever .....................Last indigenous case reported 1911; last imported, 1924..................... -------------------------------------------------------------------------------------------------------------------------------------------------- * Includes Meningitis, other, for some states. + Not previously notifiable nationally. & Data includes both hepatitis A and B. @ Registered deaths, 1954-1961. ** Includes new active cases. ==================================================================================================================================================== Return to top. TABLE_6 Note: To print large tables and graphs users may have to change their printer settings to landscape and use a small font size. TABLE 6. NOTIFIABLE DISEASES -- summary of reported cases, United States, 1944-1953 ==================================================================================================================================================== Disease 1953 1952 1951 1950 1949 1948 1947 1946 1945 1944 -------------------------------------------------------------------------------------------------------------------------------------------------- U.S. total resident population, July 1, estimate (in thousands) 158,242 155,687 153,310 151,235 148,665 146,093 143,446 140,054 132,481 132,885 -------------------------------------------------------------------------------------------------------------------------------------------------- Amebiasis 4,444 4,280 3,550 4,568 5,543 4,871 3,365 4,093 3,412 3,241 Anthrax 45 47 60 49 54 60 69 40 40 49 Botulism 18 18 33 20 24 39 44 ............NA............. Brucellosis 2,032 2,537 3,139 3,510 4,235 4,991 6,321 5,887 5,049 4,436 Chancroid * 3,338 3,738 4,233 4,977 6,707 7,661 9,515 7,091 5,515 7,878 -------------------------------------------------------------------------------------------------------------------------------------------------- Cholera - - - - - - - - - - Dengue 8 5 16 26 46 24 35 40 106 61 Diphtheria 2,355 2,960 3,983 5,796 7,969 9,493 12,262 16,354 18,675 14,150 Encephalitis, acute infectious 1,935 1,912 1,123 1,135 903 730 785 728 785 788 Gonorrhea * 238,340 244,957 254,470 286,746 317,950 345,501 380,666 368,020 287,181 300,676 -------------------------------------------------------------------------------------------------------------------------------------------------- Granuloma inguinale * 667 951 1,352 1,783 2,402 2,469 2,330 2,232 1,857 1,759 Hansen disease (leprosy) 60 57 57 44 41 63 56 43 40 37 Hepatitis, infectious + 33,700 17,428 7,349 2,820 2,027 709 1,092 ............NA............. Leptospirosis 42 62 9 30 17 18 14 ............NA............. Lymphogranuloma venereum * 983 1,200 1,300 1,427 1,925 2,429 2,526 2,603 2,631 2,858 -------------------------------------------------------------------------------------------------------------------------------------------------- Malaria 1,310 7,023 5,600 2,184 4,151 9,606 15,116 48,610 62,763 57,626 Measles (rubeola) 449,146 683,077 530,118 319,124 625,281 615,104 222,375 659,843 146,013 630,291 Meningococcal infections 5,077 4,884 4,164 3,788 3,519 3,376 3,420 5,693 8,208 16,312 Murine typhus fever 221 205 378 685 985 1,171 2,050 3,365 5,193 5,401 Pertussis (whooping cough) 37,129 45,030 68,687 120,718 69,479 74,715 156,517 109,860 133,792 109,873 -------------------------------------------------------------------------------------------------------------------------------------------------- Plague - - 1 3 3 - 1 - - 1 Poliomyelitis, total 35,592 57,879 28,386 33,300 42,033 27,726 10,827 25,698 13,624 19,029 Psittacosis 169 135 25 26 35 32 27 26 27 6 Rabies, animal & 8,903 8,445 8,008 7,901 7,587 8,495 8,920 10,850 9,928 10,487 -------------------------------------------------------------------------------------------------------------------------------------------------- Rabies, human @ 12 24 18 18 10 24 26 34 43 56 Rocky Mountain spotted fever 313 327 347 464 570 547 596 587 472 470 Salmonellosis, excluding typhoid fever 3,946 2,596 1,773 1,233 1,243 882 951 723 649 712 Shigellosis 16,533 23,197 32,215 23,367 29,080 23,753 17,048 24,286 34,943 38,230 Smallpox - - - - 49 57 176 337 346 397 Streptococcal sore throat and scarlet fever 132,935 113,677 84,151 64,494 87,220 91,295 93,595 125,511 185,570 200,539 -------------------------------------------------------------------------------------------------------------------------------------------------- Syphilis, primary and secondary * 8,637 10,449 14,485 23,939 41,942 68,174 93,545 94,957 77,007 78,443 Total, all stages * 148,573 167,762 174,924 217,558 256,463 314,313 355,592 963,647 359,114 467,755 Tetanus 506 484 506 486 579 601 560 ............NA............. Trichinosis 395 367 393 327 353 487 451 ............NA............. Tuberculosis ** 84,304 86,700 118,491 121,742 134,865 137,006 134,946 119,256 114,931 126,294 -------------------------------------------------------------------------------------------------------------------------------------------------- Tularemia 601 668 702 927 1,179 1,086 1,401 1,355 900 781 Typhoid fever 2,252 2,341 2,128 2,484 2,795 2,840 3,075 3,268 4,211 4,599 Yellow fever .....................Last indigenous case reported 1911; last imported, 1924..................... -------------------------------------------------------------------------------------------------------------------------------------------------- * Data were reported for fiscal years 1944-1946; data were reported by calendar year beginning in 1947. + Data for 1953 includes serum hepatitis. & Data for 1944-1951 from Bureau of Animal Industry, U.S. Department of Agriculture, Agricultural Research Administration. @ Registered deaths. ** Includes newly reported active and inactive cases, 1944-1951; new active cases 1952-1953. ==================================================================================================================================================== Return to top. TABLE_7 Note: To print large tables and graphs users may have to change their printer settings to landscape and use a small font size. TABLE 7. NOTIFIABLE DISEASES -- deaths from specified notifiable diseases, United States, 1982-1991 =========================================================================================================================================================================================== Cause of Death ICD * 1991 1990 1989 1988 1987 1986 1985 1984 1983 1982 ------------------------------------------------------------------------------------------------------------------------------------------------------------ AIDS + *042-*044 29,555 25,188 22,082 16,602 13,468 10,900 6,040 2,943 1,141 NA Amebiasis 006 5 5 4 7 9 8 10 10 21 7 Anthrax 022 - - - - - - - - - - Botulism, foodborne 005.1 2 4 2 1 - 1 4 4 7 4 Brucellosis 023 - - - 2 1 1 1 - - 2 Chancroid 099.0 1 - - - - - - - - - Cholera 001 2 2 - - 1 - 1 - - - Diphtheria 032 - 1 - - 1 - - - - 1 Encephalitis, acute infectious & 062-064,049 142 167 143 133 146 230 153 168 169 166 Gonococcal infections 098 3 3 4 3 7 7 2 3 4 6 Granuloma inguinale 099.2 - - - - - - - - - - Haemophilus influenzae 041.5 17 16 16 25 25 21 22 14 11 24 Hansen disease (leprosy) 030 - 3 4 - 1 1 2 6 3 3 Hepatitis, viral, infectious (Hep A) 070.0,070.1 71 76 88 70 77 65 80 77 82 83 Hepatitis, viral, serum (Hep B) 070.2,070.3 912 816 711 621 595 557 490 465 438 375 Hepatitis, viral, other and unsp. 070.4-070.9 857 686 717 599 510 384 372 327 343 356 Leptospirosis 100 1 2 - 2 1 - 4 - 5 4 Lymphogranuloma venereum 099.1 1 2 2 - - - 3 - - 1 Malaria 084 4 3 11 7 5 5 13 7 3 2 Measles (rubeola) 055 27 64 32 3 2 2 4 1 4 2 Meningococcal infections 036 198 215 273 278 258 286 257 300 299 364 Mumps 072 1 1 3 2 2 - - 1 2 2 Murine typhus fever 081.0 - - 1 - - - 1 - - - Pertussis (whooping cough) 033 - 12 12 4 1 6 4 7 5 4 Plague 020 - - - - 1 - 1 3 5 3 Poliomyelitis, total 045.0-045.9 1 - - 1 - - 3 - - - Psittacosis 073 - 2 1 1 2 - 1 - 1 - Rabies, human 071 3 1 1 - 1 - - 2 2 - Rheumatic fever, acute 390-392 89 66 70 76 42 60 56 70 87 77 Rocky Mountain spotted fever 082.0 13 20 10 20 21 19 22 34 35 40 Rubella (German measles) 056 1 8 4 1 - 1 1 1 3 4 Salmonellosis, incl. paratyphoid fever 002.1-002.9,003 53 80 99 66 105 102 117 90 82 89 Shigellosis 004 10 10 16 8 13 4 17 8 9 9 Syphilis 090-097 93 106 105 85 98 80 80 105 121 126 Tetanus 037 11 11 9 17 16 22 23 20 22 22 Trichinosis 124 - - 1 - - - 1 - - - Tuberculosis (all forms) 010-018 1,713 1,810 1,970 1,921 1,755 1,782 1,752 1,729 1,779 1,807 Tularemia 021 2 1 1 2 4 4 3 2 1 2 Typhoid fever 002.0 1 1 - - 2 2 - - 3 2 Varicella (chickenpox) 052 81 120 89 83 89 47 68 53 57 61 ------------------------------------------------------------------------------------------------------------------------------------------------------------ * Numbers in ICD column refer to the category numbers listed in the Ninth Revision of the International Classification of Diseases, 1975. (The asterisks in the ICD column pertain to the ICD code, not a footnote. They indicate that the numbers are not part of the ICD but were introduced for use in the United States.) + For 1983-1986, deaths are estimated from death certificates with mention of conditions coded to deficiency of cell-mediated immunity (ICD-9 No. 279.1). Includes other human immunodeficiency virus (HIV)-related deaths and other diseases classifiable as deficiency of cell-mediated immunity. & Arthropod-borne encephalitis and other nonarthropod-borne viral diseases of the central nervous system. Source: National Center for Health Statistics System, 1982-1991. Deaths are classified according to the Ninth Revision, ICD. =========================================================================================================================================================================================== Return to top. Disclaimer All MMWR HTML versions of articles are electronic conversions from ASCII text into HTML. This conversion may have resulted in character translation or format errors in the HTML version. Users should not rely on this HTML document, but are referred to the electronic PDF version and/or the original MMWR paper copy for the official text, figures, and tables. An original paper copy of this issue can be obtained from the Superintendent of Documents, U.S. Government Printing Office (GPO), Washington, DC 20402-9371; telephone: (202) 512-1800. Contact GPO for current prices. **Questions or messages regarding errors in formatting should be addressed to mmwrq@cdc.gov.Page converted: 09/19/98 |
|||||||||
This page last reviewed 5/2/01
|