 |
|
|
|
|
|
|
| ||||||||||
|
|
|
|
|
|
|
||||
| ||||||||||
|
|
|
|
|
Persons using assistive technology might not be able to fully access information in this file. For assistance, please send e-mail to: mmwrq@cdc.gov. Type 508 Accommodation and the title of the report in the subject line of e-mail. Surveillance for Ectopic Pregnancy -- United States, 1970-1989Tatiana E. Goldner, M.D. Herschel W. Lawson, M.D. Zhisen Xia, Ph.D. Hani K. Atrash, M.D., M.P.H. Division of Reproductive Health National Center for Chronic Disease Prevention and Health Promotion Abstract Problem/Condition: From 1970 through 1989, hospitalizations for ectopic pregnancy have increased in the United States; the number of cases has increased fivefold, from 17,800 to 88,400. Reporting Period Covered: 1970-1989. Description of System: Reported ectopic pregnancies were estimated from data collected by CDC's National Center for Health Statistics (NCHS) as part of the ongoing National Hospital Discharge Survey. Data from responding hospitals were weighted to represent national estimates. The number of deaths resulting from ectopic pregnancy was based on U.S. vital statistics collected by NCHS. Denominators for calculating ectopic pregnancy rates were the total number of reported pregnancies, which includes live births, legal induced abortions, and ectopic pregnancies. Data for live births were obtained from NCHS natality statistics and data for legal induced abortions from CDC's Division of Reproductive Health. Results: From 1970 through 1989, more than one million ectopic pregnancies were estimated to have occurred among women in the United States; the rate increased by almost fourfold, from 4.5 to 16.0 ectopic pregnancies per 1,000 reported pregnancies. Although ectopic pregnancies accounted for less than 2% of all reported pregnancies during this period, complications of this condition were associated with approximately 13% of all pregnancy- related deaths. During this period, the risk of death associated with ectopic pregnancy decreased by 90%: the case-fatality rate declined from 35.5 deaths per 10,000 ectopic pregnancies in 1970 to 3.8 in 1989. The risks of ectopic pregnancy and death from its complications were consis- tently higher for blacks and other racial/ethnic minorities than for whites throughout the period. Interpretation: Although the general trend has been for the numbers and rates of ectopic pregnancy to increase over the 20-year period, the variability of the data does not permit meaningful conclusions to be made about year-to-year changes in the estimates of ectopic pregnancies, especially for the years 1988 and 1989. Actions Taken: These findings indicate the need to characterize behaviors and risk factors that may respond to preventive interventions. Until these risks factors are better characterized, early detection and appropriate management of ectopic pregnancies will remain the most effective means of reducing the morbidity and mortality associated with this condition. INTRODUCTION From 1970 through 1989, the estimated numbers and rates of hospitalizations for ectopic pregnancy have increased in the United States. This complication of early pregnancy, which results when fertilized ova implant at sites other than the endometrial lining of the uterus, results in not only fetal loss, but also the potential for considerable maternal morbidity and the risk of maternal death (1,2). Although ectopic pregnancies accounted for only 1.6% of all reported pregnancies during 1989, complications of the condition were among the leading causes of maternal death in the United States and the leading cause of maternal death during the first trimester (2-4). CDC has previously reported data for ectopic pregnancy during the period 1970-1987 (5). This surveillance summary updates previous reports and includes data for 1988 and 1989 (6). METHODS The numbers of reported ectopic pregnancies were estimated from data collected by CDC's National Center for Health Statistics (NCHS) as part of the ongoing National Hospital Discharge Survey (NHDS). Before 1988, the NHDS, which is conducted annually, sampled approxi- mately 400 nonfederal, short-stay hospitals representing all 50 states and the District of Columbia. Demographic data, diagnoses, and surgical proce- dures were abstracted from a sample of medical records from responding hospitals and weighted to represent national estimates (7). In 1988, NCHS redesigned the NHDS to establish geographic consistency with other NCHS surveys and to improve its efficiency through the use of improved information and technologies (8). The universe of the survey was changed to include all hospitals that provide general medical, surgical, and pediatric care, regardless of length of stay; however, 98% of the hospitals were short-term. The sampling methodology was also changed to include all hospitals with greater than or equal to 1,000 beds or greater than or equal to 40,000 annual discharges; the remaining sample of hospitals is based on a stratified three-stage design. In 1988 and 1989, data were collected from about 470 participating hospitals, with approximately 250,000 discharges yearly (9). The diagnosis of ectopic pregnancy for the years 1970-1978 was based on hospital discharge records with a diagnosis code of 631, according to the International Classification of Diseases, Eighth Revision, Adapted for Use in the United States (10). For 1979-1989, ectopic pregnancies were coded as 633, according to the International Classification of Diseases, Ninth Revision, Clinical Modification (11). The number of deaths resulting from ectopic pregnancy was based on U.S. vital statistics collected by NCHS. Ectopic pregnancy rates were calculated by dividing the estimated number of ectopic pregnancies by the total number of reported pregnancies. The term "reported pregnancies" was defined as the sum of live births, legal induced abortions, and ectopic pregnancies. Data for live births were obtained from NCHS natality statistics (12) and data for legal induced abortions from CDC's Division of Reproductive Health. Ectopic pregnancy rates were reported as ectopic pregnancies per 1,000 reported pregnancies. Case-fatality rates, which were calculated by dividing the number of deaths resulting from complications of ectopic pregnancy by the estimated number of ectopic pregnancies, were reported as deaths per 10,000 ectopic pregnancies. The four geographic regions used in this report (Northeast, Midwest, South, and West) were those defined by the U.S. Department of Commerce, Bureau of the Census (13). To calculate ectopic pregnancy rates, women were grouped into three age categories: 15-24, 25-34, and 35-44 years. To analyze deaths resulting from complications of ectopic pregnancy, women were grouped into six age categories: 15-19, 20-24, 25-29, 30-34, 35-39, and 40-44 years. Race-specific rates for the categories "white" and "black and other" were used. When information on race was not included in the NHDS data base, we redistributed the ectopic pregnancies according to the distribution of cases for which race was known. Phenotypic racial markers were not related to genetic susceptibility for the underlying causes of ectopic pregnancy. However, such markers have been used as surrogates for a variety of potential risk factors (biologic, social, cultural, or environmental) that are linked to ectopic pregnancy. To assess time trends, we grouped estimates of ectopic pregnancies and deaths resulting from this condition into four 5-year periods: 1970-1974, 1975-1979, 1980-1984, and 1985-1989. Reported estimates of ectopic pregnancies were rounded to the nearest hundred. Rounding and redistribution of cases with unknown race sometimes caused the sum of the numbers to differ from the total. However, rates were calculated from the unrounded estimates. We calculated 95% confidence intervals around point estimates for the years 1970 through 1987, using standard error curves described by NCHS (8). For 1988 and 1989, we calculated standard errors with SUDAAN software (14), using a first-order Taylor approximation of the deviation of estimates from their expected values (8). We also calculated confidence intervals for estimated case-fatality rates according to those standard errors (15). RESULTS In 1988, the number and rate of ectopic pregnancies decreased from those reported in 1987 (Table_1 and Figure_1) (5); however, the change was not statistically significant. Among the estimated 80,700 ectopic pregnancies, the highest rate occurred among women ages 35-44 years (27.2/1,000 reported pregnancies). When the data were analyzed by race, the rate of ectopic pregnancies decreased 13% for whites, from 15.4 per 1,000 reported pregnancies in 1987 to 13.4 in 1988, but the rate decreased only 1% for blacks and other minorities, from 21.0 per 1,000 in 1987 to 20.8 in 1988. In 1988, the risk of ectopic pregnancy among blacks and other minorities was 1.6 times the risk among whites, a 14% increase since 1987 (5). In 1989, the number and rate of ectopic pregnancies increased to about the 1987 estimates, although the change was not statistically significant (Table_1 and Figure_1) (5). As in previous years, women ages 35-44 years had the highest rates of ectopic pregnancy (24.9/1,000 reported pregnancies) (6). Ectopic pregnancy rates for blacks and other minorities again decreased, from 20.8 per 1,000 reported pregnancies in 1988 to 17.3 in 1989, while the rate for whites increased from 13.4 in 1988 to 15.6 in 1989 -- a figure comparable with that reported in 1987 (Figure_2). The risk of ectopic pregnancy for blacks and other minorities was 1.1 times the risk for whites in 1989 -- a decrease from that reported in 1988. From 1970 through 1989, approximately 1,047,900 ectopic pregnancies were reported among women ages 15-44 years in the United States. The overall rate was 11.3 per 1,000 reported pregnancies (Table_1). Over the 20-year period, the estimated number of ectopic pregnancies increased fivefold, from 17,800 in 1970 to 88,400 in 1989. For all women combined, ectopic pregnancy rates increased almost fourfold, from 4.5 per 1,000 reported pregnancies in 1970 to 16.0 in 1989. The rates increased almost fourfold (from 4.0 in 1970 to 15.6 in 1989) for whites and more than doubled (from 7.2 in 1970 to 17.3 in 1989) for blacks and other minorities (Figure_2). The risk of ectopic pregnancy increased with age for both racial groups and was highest for women 35-44 years old (Table_2). Whites ages 35-44 were 3.1 times more likely than those ages 15-24 to have an ectopic pregnancy (rates: 19.0 vs. 6.1). Blacks and other minorities ages 35-44 were 3.7 times more likely to have an ectopic pregnancy than their counter- parts ages 15-24 (rates: 30.1 vs. 8.2). Rates of ectopic pregnancy were higher for blacks and other minorities than for whites in all age groups. Overall, for the period 1970-1989, the rates of ectopic pregnancy for the four geographic regions were similar. The highest rates occurred in the South (Table_3). However, region-specific rates varied by race. For whites, the rate was highest in the West; for blacks and other minorities, the rate was highest in the Midwest. In all four regions, the rates for blacks and other minorities were higher than those for whites (Table_3). When numbers of ectopic pregnancies were combined into four 5-year periods (1970-1974, 1975-1979, 1980-1984, and 1985-1989) and analyzed by race, the rate for whites increased 2.7-fold and the rate for blacks and other minorities increased 2.3-fold from the first to the fourth period (Figure_3). In 1988, 44 deaths (15% of all maternal deaths) resulted from compli- cations of ectopic pregnancy (16). The case-fatality rate was 5.5 per 10,000 ectopic pregnancies -- a 62% increase from the figure of 3.4 reported in 1987 (Table_4). In 1989, the number of deaths reported was 34 (13% of all maternal deaths) (17), and the case-fatality rate of 3.8 approximated that reported in 1987 (5). The risk of death associated with ectopic pregnancy complications was higher for blacks and other minorities than for whites in 1988 and 1989. The racial disparity during these 2 years increased from figures reported in 1986 and 1987 and was similar to figures reported from 1983 through 1985 (4), when fourfold higher rates were reported among blacks and other minorities (Table_4 and Figure_4). During the period 1970-1989, 860 women died from complications of ectopic pregnancy. Although small increases in numbers of deaths and case-fatality rates occurred during 1988 and 1989, overall, the risk of death associated with ectopic pregnancy decreased during the 20-year period. During this interval, the case-fatality rate decreased by 90%, from 35.5 to 3.8 deaths per 10,000 ectopic pregnancies (Figure_5). During the period 1970-1989, teenagers in both race groups had the highest mortality rates. However, the rate for black and other minority teenagers was almost five times that for white teenagers (Figure_6). In other age groups, case-fatality rates for blacks and other races were at least 2.5 times higher than the rates for whites. Overall, for the 20-year period, the risk of death due to ectopic pregnancy was 3.4 times higher for blacks and other minorities than for whites. In addition, when the data were analyzed by time periods (1970- 1974, 1975-1979, 1980-1984, and 1985-1989), case-fatality rates were consistently higher for blacks and other minorities than for whites (Figure_7). The racial gap increased 47% from the first period (1970- 1974) to the second (1975-1979) and then decreased 27% from the second period to the third (1980-1984) and 6% from the third period to the fourth (1985-1989). DISCUSSION With few exceptions, during the period 1970-1989 the numbers and rates of women hospitalized with ectopic pregnancies increased steadily; these increases affected all race groups. Possible reasons for the reported increases include a) a higher prevalence of risk factors for ectopic pregnancy or a lower prevalence of protective factors or both, b) a heightened awareness of ectopic pregnancy among health-care providers and patients, c) earlier diagnosis stemming from technologic advances, and d) a tendency for ectopic pregnancy to recur among women who have had one or more previous episodes (18-24). Although the etiology of ectopic pregnancy is not well understood, the condition has been attributed to both maternal and embryonic factors. Maternal factors include alterations in tubal motility, variations in hormonal release, and anatomic changes such as scarring due to pelvic inflammatory disease (PID) (22,25). PID is usually mediated through sexually transmitted diseases, which may themselves be risk factors for ectopic pregnancy (26-29). Several recent studies have reported a higher risk of ectopic pregnancy among women who smoke (30-32). The possible mechanisms include a) altered tubal motility mediated through nicotine exposure that may increase opportunity for tubal implantation and b) reduced humoral and cellular immunity that may affect tubal epithelial response to inflammation and increase the risk of tubal inflammation. Our data have several limitations. Although estimates of ectopic pregnancies have increased over time, some cases may not have been counted. Some ectopic pregnancies resolve spontaneously and therefore remain undiag- nosed (33). Some cases were missed because the NHDS does not fully include ambulatory medical and surgical treatment of ectopic pregnancies in its survey design (19). However, the reported rates of ectopic pregnancies may well be overestimated because data for spontaneous abortions and still- births were excluded from the denominator. Another factor that may inflate the rates is that the numbers of induced abortions reported by CDC were consistently lower than numbers reported by a private source that based its estimates on direct surveys of legal abortion providers (34). Although the general trend has been for the numbers and rates of ectopic pregnancy to increase over the 20-year period, some variations were noted. These variations may represent temporary fluctuations in the data caused by changing survey methodology. However, the variability of the data, as indicated by wide confidence intervals, does not permit meaningful conclu- sions about year-to-year changes in the estimates of ectopic pregnancies, especially for the years 1988 and 1989. Our data show that blacks and other minorities have consistently had a higher risk of ectopic pregnancy, across all age and region strata. Moreover, during 1988 and 1989 the risk of death associated with the complications of ectopic pregnancy was greater among blacks and other minorities than among whites. Several reports have suggested that blacks and other minorities tend to have less and later prenatal care than do white women (35), and, although ectopic pregnancies generally occur before the onset of regular prenatal care, such data may serve as markers for inadequate access to or use of appropriate preventive and curative health services. Until the risk factors that lead to ectopic pregnancy are more fully understood, early detection and appropriate management will be the most effective means of reducing the morbidity and mortality associated with this condition (36,37). All women of reproductive age should be made aware of the risk of ectopic pregnancy so that they can seek early prenatal care. Special education programs and early access to care should be targeted for groups of women known to be at higher risk for this serious complication of pregnancy. Emergency-room personnel and other health-care providers should consider and rule out ectopic pregnancy when treating women of reproductive age who have symptoms associated with ectopic pregnancy. ACKNOWLEDGMENT The authors thank Robert Pokras, M.A., National Center for Health Statistics, for his assistance in the preparation of this manuscript. References
Table_1 Note: To print large tables and graphs users may have to change their printer settings to landscape and use a small font size.
TABLE 1. Numbers and rates of ectopic pregnancies, by year -- United States, 1970-1989
================================================================================================
     Year          Number *             95% CI +              Rate &
--------------------------------------------------------------------
     1970           17,800          (11,200- 24,400)           4.5
     1971           19,300          (12,300- 26,300)           4.8
     1972           24,500          (16,800- 32,200)           6.3
     1973           25,600          (17,600- 33,600)           6.8
     1974           26,400          (18,600- 34,200)           6.7
     1975           30,500          (22,400- 38,600)           7.6
     1976           34,600          (26,600- 42,600)           8.3
     1977           40,700          (29,900- 51,500)           9.2
     1978           42,400          (33,600- 51,200)           9.4
     1979           49,900          (40,100- 59,700)          10.4
     1980           52,200          (42,000- 62,400)          10.5
     1981           68,000          (55,800- 80,300)          13.6
     1982           61,800          (51,900- 71,800)          12.3
     1983           69,600          (60,000- 79,300)          14.0
     1984           75,400          (66,500- 84,300)          14.9
     1985           78,400          (69,200- 87,600)          15.2
     1986           73,700          (65,000- 82,400)          14.3
     1987           88,000          (78,000- 98,000)          16.8
     1988           80,700          (67,200- 94,200)          15.1
     1989           88,400          (70,600-106,100)          16.0

     Total       1,047,900 @                                  11.3
--------------------------------------------------------------------
* Rounded to the nearest hundred.
+ Confidence interval.
& Rate per 1,000 reported pregnancies (live births, legal abortions, and ectopic pregnancies).
@ Because of rounding, the total may differ from the sum of the numbers.
================================================================================================
Return to top. Figure_1 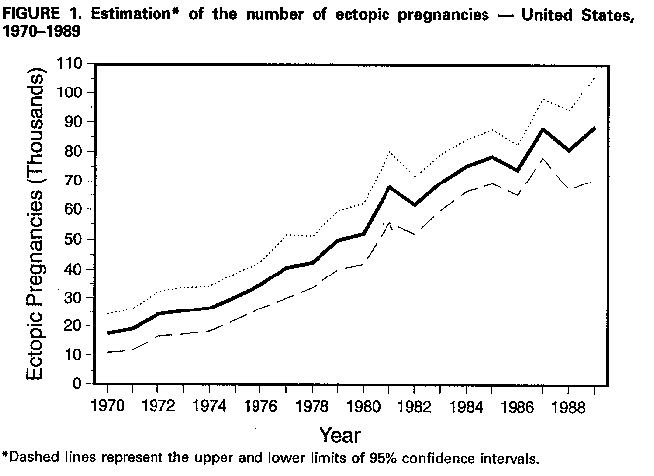 Return to top. Figure_2 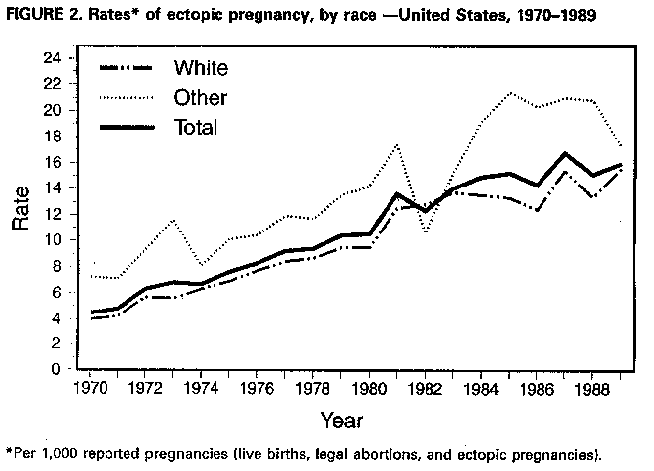 Return to top. Table_2 Note: To print large tables and graphs users may have to change their printer settings to landscape and use a small font size.
TABLE 2. Numbers and rates of ectopic pregnancies, by race * and age group -- United
States, 1970-1989
==============================================================================================
    Race                Age group (yrs)      Number +           Rate &
----------------------------------------------------------------------
    White                  15-44             742,400            10.3
                           15-24             218,200             6.1
                           25-34             443,100            13.7
                           35-44              83,200            19.0

    Black & other          15-44             304,100            14.7
                           15-24              98,300             8.2
                           25-34             167,700            22.6
                           35-44              37,900            30.1

    All races              15-44           1,046,500            11.3
                           15-24             316,500             6.6
                           25-34             610,800            15.4
                           35-44             121,100            21.5
----------------------------------------------------------------------
* Race "unknown" redistributed according to the percentage of race known. Redistribution and
  rounding sometimes cause the sum of individual cells to differ from the total.
+ Rounded to the nearest hundred.
& Per 1,000 reported pregnancies (live births, legal abortions, and ectopic pregnancies).
==============================================================================================
Return to top. Table_3 Note: To print large tables and graphs users may have to change their printer settings to landscape and use a small font size.
TABLE 3. Numbers and rates of ectopic pregnancies, by race * and geographic region
-- United States, 1970-1989
==============================================================================================
    Race                 Region           Number +        Rate &
----------------------------------------------------------------
    White                Northeast        141,100          9.3
                         Midwest          187,800         10.1
                         South            221,100         10.2
                         West             195,900         11.3

    Black & other        Northeast         65,100         14.1
                         Midwest           61,000         16.8
                         South            137,600         15.9
                         West              38,100         11.6

    All races            Northeast        206,200         10.4
                         Midwest          248,800         11.1
                         South            358,700         11.9
                         West             234,000         11.3
----------------------------------------------------------------
* Race "unknown" redistributed according to the percentage of race known. Redistribution and
  rounding sometimes cause the sum of individual cells to differ from the total.
+ Rounded to the nearest hundred.
& Per 1,000 reported pregnancies (live births, legal abortions, and ectopic pregnancies).
==============================================================================================
Return to top. Figure_3 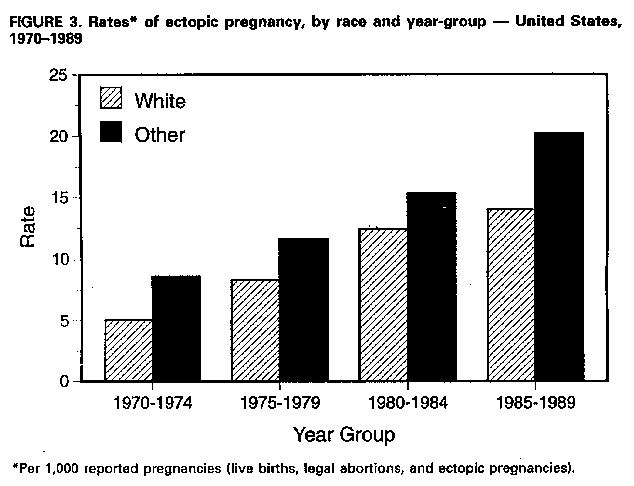 Return to top. Table_4 Note: To print large tables and graphs users may have to change their printer settings to landscape and use a small font size.
TABLE 4. Numbers of deaths due to ectopic pregnancy and case-fatality rates, by race
and year -- United States, 1970-1989
======================================================================================
                   Number                                 Rate *
         ---------------------------     ----------------------------------------
Year     White   Black/other   Total     White   Black/other   Total   (95% CI +)
----------------------------------------------------------------------------------
1970       28         35         63      21.7       72.1       35.5    (22.2-48.8)
1971       21         40         61      15.1       74.9       31.7    (20.2-43.2)
1972       28         20         48      16.2       27.7       19.6    (13.5-25.8)
1973       25         21         46      15.1       23.4       18.0    (12.3-23.7)
1974       20         31         51      10.1       47.0       19.4    (13.7-25.1)
1975       19         31         50       8.8       34.9       16.4    (12.1-20.7)
1976       11         28         39       4.4       28.7       11.3    ( 8.7-13.9)
1977       15         29         44       5.2       24.5       10.8    ( 7.9-13.7)
1978       13         24         37       4.4       18.7        8.7    ( 6.9-10.6)
1979       20         25         45       5.7       17.2        9.0    ( 7.3-10.8)
1980       22         24         46       6.0       15.4        8.8    ( 7.1-10.6)
1981       15         19         34       3.1        9.7        5.0    ( 4.1- 5.9)
1982       19         24         43       3.8       19.3        7.0    ( 5.8- 8.1)
1983       17         20         37       3.3       11.2        5.3    ( 4.6- 6.1)
1984       14         25         39       2.7       10.8        5.2    ( 4.6- 5.8)
1985       11         22         33       2.1        8.4        4.2    ( 3.7- 4.7)
1986       17         19         36       3.3        7.6        4.9    ( 4.3- 5.5)
1987       17         13         30       2.6        4.8        3.4    ( 3.0- 3.8)
1988       18         26         44       3.3       10.2        5.5    ( 4.5- 6.4)
1989       14         20         34       2.1        9.2        3.8    ( 3.1- 4.6)

Total     364        496        860       4.9       16.3        8.2
----------------------------------------------------------------------------------
* Deaths from ectopic pregnancy per 10,000 ectopic pregnancies.
+ Confidence intervals for total rates.
======================================================================================
Return to top. Figure_4 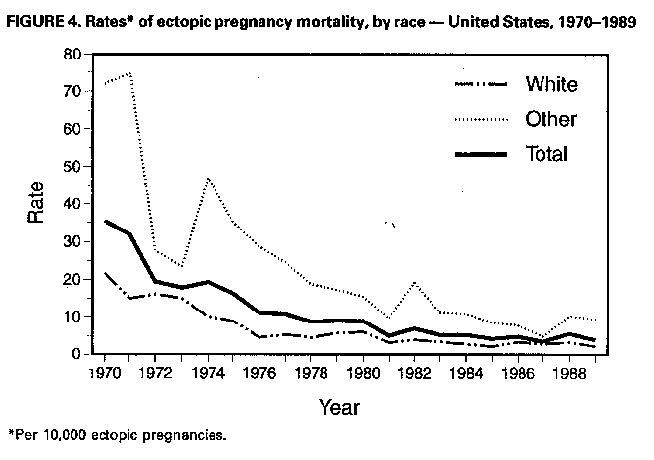 Return to top. Figure_5 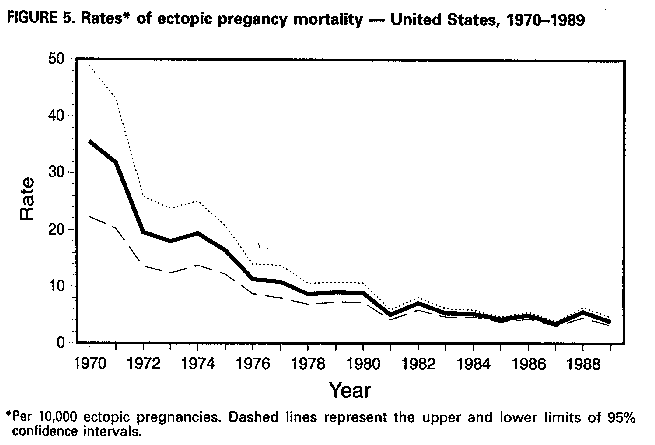 Return to top. Figure_6  Return to top. Figure_7 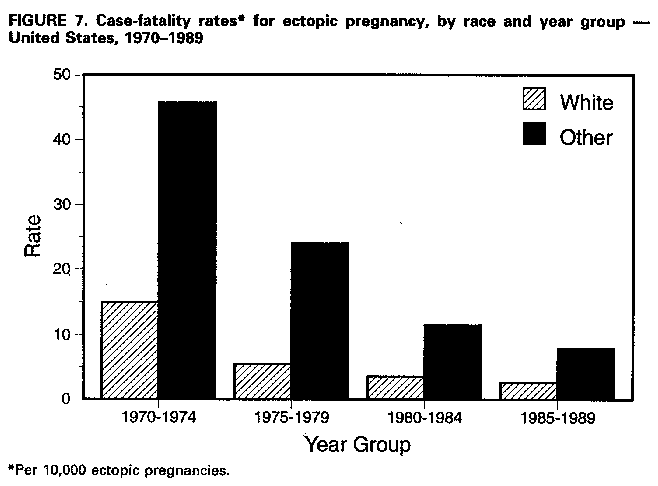 Return to top. Disclaimer All MMWR HTML versions of articles are electronic conversions from ASCII text into HTML. This conversion may have resulted in character translation or format errors in the HTML version. Users should not rely on this HTML document, but are referred to the electronic PDF version and/or the original MMWR paper copy for the official text, figures, and tables. An original paper copy of this issue can be obtained from the Superintendent of Documents, U.S. Government Printing Office (GPO), Washington, DC 20402-9371; telephone: (202) 512-1800. Contact GPO for current prices. **Questions or messages regarding errors in formatting should be addressed to mmwrq@cdc.gov.Page converted: 09/19/98 |
|||||||||
This page last reviewed 5/2/01
|