1994 Revised Guidelines for the Performance of CD4+ T-Cell
Determinations in Persons with Human Immunodeficiency Virus (HIV)
Infections
Summary
This document contains revised guidelines developed by CDC for
laboratories performing lymphocyte immunophenotyping assays in
human immunodeficiency virus-infected persons. The recommendations
in this document reflect current technology in a field that is
rapidly changing. The recommendations address laboratory safety,
specimen collection, specimen transport, maintenance of specimen
integrity, specimen processing, flow cytometer quality control,
sample analyses, data analysis, data storage, data reporting, and
quality assurance.
INTRODUCTION
Human immunodeficiency virus (HIV) is a retrovirus that
infects cells that possess the CD4 receptor (1-3). This infection
causes the depletion of CD4+ T-cells, which is a major clinical
finding in progressive infection (2-5). Depletion in these cells is
associated with increased clinical complications and is a measure
of immunodeficiency. Among persons with HIV infection, CD4+
T-lymphocyte determinations are used in clinical decisions for
prognosis and therapy (5-8) because they have been found to be
useful for predicting the onset of opportunistic diseases (4).
These determinations are also used as a surrogate for therapy
outcome (7,8). In addition, persons with CD4+ T-cell levels less
than 200 cells/ul, or 14%, are now classified as having acquired
immunodeficiency syndrome (AIDS) using CDC's revised classification
system (9).
Recently, CDC published guidelines for laboratories performing
assays to enumerate CD4+ T-cell levels (10). These guidelines
addressed issues about hematology measures as well as flow
cytometric measures, which are combined for enumerating CD4+
T-cells. As technology evolves, revisions in the guidelines may be
necessary. A number of laboratories have raised questions regarding
the 1992 guidelines and have helped resolve some of the
controversial issues in that document. In addition, new
technologies for enumerating CD4+ T-cells have been explored and
are being validated. As a result, revisions reflecting current
technology have been made to the 1992 guidelines to help guide
laboratories in proper quality assurance (QA) and quality control
(QC).
RECOMMENDATIONS
Laboratory safety
Use universal precautions with all specimens (11).
Establish the following safety practices (12-18):
Wear laboratory coats and gloves when processing and
analyzing specimens, including reading specimens on
the flow cytometer.
Never pipette by mouth. Use safety pipetting devices.
Never recap needles. Dispose of needles and syringes
in puncture-proof containers designed for this
purpose.
Handle and manipulate specimens (aliquoting, adding
reagents, vortexing, and aspirating) in a class I or
II
biological safety cabinet.
Centrifuge specimens in safety carriers.
After working with specimens, remove gloves and wash
hands with soap and water.
For stream-in-air flow cytometers, follow the
manufacturer's recommended procedures to eliminate the
operator's exposure to any aerosols or droplets of
sample
material.
Disinfect flow cytometer wastes. Add a volume of
undiluted
household bleach (5% sodium hypochlorite) to the waste
container before adding waste materials so that the
final
concentration of bleach will be 10% (0.5% sodium
hypochlorite) when the container is full (e.g., add
100 mL
undiluted bleach to an empty 1,000-mL container).
Disinfect the flow cytometer as recommended by the
manufacturer. One method is to flush the flow
cytometer
fluidics with a 10% bleach solution for 5-10 minutes
at the
end of the day, then flush with water or saline for at
least
10 minutes to remove excess bleach, which is
corrosive.
j. Disinfect spills with household bleach or an
appropriate
dilution of mycobactericidal disinfectant. Note:
Organic
matter will reduce the ability of bleach to disinfect
infectious agents. For specific procedures about how
areas
should be disinfected, see reference 18. In general,
for
use on smooth, hard surfaces, a 1% solution of bleach
is
adequate for disinfection; for porous surfaces, a 10%
solution is needed (18).
k. Assure that all samples have been properly fixed after
staining and lysing, but before analysis. Note: Some
commercial lysing/fixing reagents will reduce the
infectious
activity of cell-associated HIV by 3-5 logs (19),
however,
these reagents have not been evaluated for their
effectiveness against other agents such as hepatitis
virus.
Buffered (pH 7.0-7.4) 1%-2% paraformaldehyde or
formaldehyde
can inactivate cell-associated HIV to approximately
the same
extent (19-22). Cell-free HIV can be inactivated with
1%
paraformaldehyde within 30 minutes (23). Because the
commercial lysing/fixing reagents do not completely
inactivate cell-associated HIV, and the time frame for
complete inactivation is not firmly established, it is
good
practice to resuspend and retain stained and lysed
samples
in fresh 1%-2% paraformaldehyde or formaldehyde
through
flow cytometric analysis.
Specimen collection
Select the appropriate anticoagulant for hematologic
testing and
flow cytometric immunophenotyping.
Anticoagulant for hematologic testing:
Use tripotassium ethylenediamine tetra-acetate
(K(3)EDTA, 1.5 plus or minus 0.15 mg/mL blood)
(24,25) and perform the test within the time
frame
allowed by the manufacturer of the hematology
analyzer, not to exceed 30 hours.
Reject a specimen that cannot be processed
within
this time frame unless the hematology
instrumentation
is suitable for analyzing such specimens. Note:
Some
hematology instruments are capable of
generating
accurate results 12-30 hours after specimen
collection (26). To ensure accurate results for
specimens from HIV-infected persons,
laboratories
must validate their hematology instrument's
ability
to give the same result at time 0 and at the
maximum
time claimed by the manufacturer when using
specimens
from HIV-infected as well as HIV-uninfected
persons.
Anticoagulant for flow cytometric immunophenotyping,
depending on the delay anticipated before sample
processing:
Use K(3)EDTA, acid citrate dextrose (ACD), or
heparin
if specimens will be processed within 30 hours
after
collection.
Use either ACD or heparin, NOT K(3)EDTA, if
specimens
will be processed within 48 hours after
specimen
collection. Note: K(3)EDTA should NOT be used
for
specimens held for greater than 30 hours before
testing because the proportion of some
lymphocyte
populations changes after this period (27).
Reject a specimen that cannot be processed
within
48 hours after specimen collection and request
another.
Collect blood specimens by venipuncture (28) into evacuated
tubes
containing an appropriate anticoagulant, completely
expending the
vacuum in the tubes.
Draw pediatric specimens in pediatric tubes to avoid
underdrawing.
Mix the blood well with the anticoagulant to prevent
clotting.
Draw the appropriate number of tubes:
When hematology and flow cytometric immunophenotyping
will
be performed in the same laboratory on the same
specimen,
use one tube containing K(3)EDTA.
In all other circumstances, draw two separate tubes
(K(3)EDTA for hematologic determinations and K(3)EDTA,
ACD,
or heparin for flow cytometric immunophenotyping).
Label all specimens with a unique patient identifier, date,
and
time of collection.
Assure that patient information and test results are
accorded confidentiality.
Provide on the submission form pertinent medications
and
disease conditions that may affect the
immunophenotyping
test (Appendix).
Specimen transport
Maintain and transport specimens at room temperature (18-22
C)
(26,29-31). Avoid extremes in temperature so that specimens
do
not freeze or become too hot. Temperatures above 37 C may
cause
cellular destruction and affect both the hematology as well
as
flow cytometry measurements (26). In hot weather, it may be
necessary to pack the specimen in an insulated container
and
place this container inside another containing an ice pack
and
absorbent material. This method helps retain the specimen
at
ambient temperature. The effect of cool temperatures (4 C)
on
immunophenotyping results is not clear (26,31).
Transport specimens to the immunophenotyping laboratory as
soon
as possible.
For transport to locations outside the collection facility
but
within the state, follow state or local guidelines. One
method
for packaging such specimens is to place the tube
containing the
specimen in a leak-proof container, such as a sealed
plastic bag,
and pack this container inside a cardboard canister
containing
sufficient material to absorb all the blood should the tube
break
or leak. Cap the canister tightly. Fasten the request slip
securely to the outside of this canister with a rubber
band.
For mailing, this canister should be placed inside another
canister containing the mailing label.
For interstate shipment, follow federal guidelines (32) for
transporting diagnostic specimens. Note: Use overnight
carriers
with an established record of consistent overnight delivery
to
ensure arrival the following day. Check with these carriers
for
their specific packaging requirements as well.
Obtain specific protocols and arrange appropriate times of
collection and transport from the facility collecting the
specimen.
Specimen integrity
Inspect the tube and its contents immediately upon arrival.
Take corrective actions if the following occur:
If the specimen is hot or cold to the touch but not
obviously hemolyzed or frozen, process it but note the
temperature condition on the worksheet and report
form.
Do not rapidly warm or chill specimens to bring them
to
room temperature because this may adversely affect the
immunophenotyping results (26). Abnormalities in
light-
scattering patterns will reveal a compromised
specimen.
If blood is hemolyzed or frozen, reject the specimen
and
request another.
If clots are visible, reject the specimen and request
another.
If the specimen is greater than 48 hours old (from the
time
of draw), reject it and request another.
Specimen processing
Hematologic testing
Perform the hematologic tests within the time frame
specified
by the manufacturer of the specific hematology
instrument
used (time from blood specimen draw to hematologic
test).
(See Note under B.1.a.ii.)
Perform an automated white blood cell (WBC) count and
differential, counting 10,000 to 30,000 cells (33). If
the
specimen is rejected or "flagged" by the instrument, a
manual differential of at least 400 cells can be
performed.
If the flag is not on the lymphocyte population and
the
lymphocyte differential is reported by the instrument,
the
automated lymphocyte differential should be used.
Immunophenotyping
For optimal results, perform the test within 30 hours,
but
no later than 48 hours, after drawing the blood
specimen
(34,35).
Use a direct two- or three-color immunofluorescence
whole-
blood lysis method. Use the "stain, then lyse"
procedure.
Use a monoclonal antibody panel that contains
appropriate
monoclonal antibody combinations to enumerate CD4+ and
CD8+ T-cells and to ensure the quality of the results
(36). A recommended two-color immunophenotyping
antibody
panel is in Table_1, listed by CD nomenclature
(37)
and fluorochrome. The results from this panel provide
data
useful for defining the T-cell population and
subpopulations;
determining the recovery and purity of the lymphocytes
in
the gate; setting cursors for positivity; accounting
for all
lymphocytes in the sample; monitoring tube-to-tube
variability; and monitoring T-cell, B-cell, and
natural
killer (NK)-cell levels in sequential patient
specimens.
The following internal controls are included in the
panel:
CD3 monoclonal antibody in tubes 3-6 serves as
a
control for tube-to-tube variability and is
also
used to determine T-cell populations. Note: All
CD3 values should be within 3% of each other.
If
the CD3 value of a tube is greater than 3% of
any of
the others, that tube should be repeated (new
aliquot
of blood labeled, lysed, and fixed).
Monoclonal antibodies that label T-cells,
B-cells,
and NK-cells are used to account for all
lymphocytes
in the specimen (36). Note: An abbreviated
two-color
panel should only be used for testing specimens
from
patients for whom CD4+ T-cell levels are being
requested as part of sequential follow-up, and
then
only after consulting with the requesting
clinician.
The greatest danger in using an abbreviated
panel is
that the internal controls (noted above) are no
longer
included. For this reason, the
immunophenotyping
results should be reviewed carefully to ensure
that
T-cell levels are similar to those determined
previously with the full recommended panel.
When
discrepancies occur, the specimens must be
reprocessed
using the full recommended two-color monoclonal
antibody panel.
Three-color monoclonal antibody panels can be used if
the
quality of immunophenotyping results from the
three-color
combinations can be assured and the panel has been
validated
using specimens from both HIV-infected and
HIV-uninfected
persons. Assurance of the results includes a)
validating the
gating strategies used so that the quality of the gate
is
known (i.e., lymphocyte recovery and purity) (see
Section
I.2.) and b) a method for evaluating nonspecific
fluorescence
in the unlabeled population. Validation of a
three-color
panel includes labeling specimens with both the
two-color
panel and the proposed three-color panel then
determining
whether the differences in results for a particular
population (e.g., CD4+ T-cells) by both methods are
within
the variability expected from replicates in the
laboratory.
(See Section H.2.)
Use premixed two- or three-color monoclonal antibodies
at
concentrations recommended by the manufacturer. Note:
If,
instead, two or three single-color reagents are
combined,
each must be titered with the other(s) to determine
optimal
concentrations for use (10 uL antibody A with 5 uL
antibody
B, 5 uL antibody A with 10 uL antibody B, etc., for
two-
color; 10 uL antibody A with 5 uL antibody B and 5 uL
antibody C, 5 uL antibody A with 10 uL antibody B and
5 uL
antibody C, etc., for three-color). Note: Reagents
from
different manufacturers are likely to be different in
their
epitope specificity, fluorochrome/protein (F/P) ratio,
and
protein concentrations. Because of these differences,
combining reagents from different manufacturers is not
generally recommended. Optimal antibody concentrations
are
those in which the brightest signal is achieved with
the
least amount of noise (nonspecific binding of antibody
to
the negative population) (i.e., the best
signal-to-noise
ratio). The nonspecific binding should be no greater
than
that of an isotype control. The way to evaluate the
appropriate concentration of antibodies when combined
is to
evaluate the fluorescence histogram in a tube in which
only
one antibody is added and compare it with the
histogram
from a tube in which more than one antibody is added.
The
single-parameter histograms from both tubes should be
similar. In addition, the percent positive cells for
the
cell population by both methods should be within the
expected variability established in the laboratory.
(See
Section H.2.)
When centrifuging, maintain centrifugation forces of
no
greater than 400g for 3-5 minutes for wash steps.
Vortex sample tubes to mix the blood and reagents and
break
up cell aggregates. Vortex samples immediately before
analysis to optimally disperse cells.
Include a source of protein (e.g., fetal bovine serum
or
bovine serum albumin) in the wash buffer to reduce
cell
clumps and autofluorescence.
Incubate all tubes in the dark during the
immunophenotyping
procedure.
j. Before analysis on the flow cytometer, be sure all
samples
have been adequately fixed. Even though some of the
commercial lysing/fixing reagents can inactivate cell-
associated HIV, it is good laboratory practice to fix
all
tubes after staining and lysing with 1%-2% buffered
paraformaldehyde or formaldehyde. Note: The
characteristics
of paraformaldehyde and formaldehyde may vary from lot
to
lot. They may also lose their effectiveness over time.
Therefore, these fixatives should be made fresh weekly
from
electron microscopy-grade aqueous stock.
k. Immediately after processing the specimens, store all
stained samples in the dark and at refrigerator
temperatures
(4-10 C) until flow cytometric analysis. These
specimens
should be stored for no longer than 24 hours unless
the
laboratory can show that scatter and fluorescence
patterns
do not change for specimens stored longer.
Negative and positive controls for immunophenotyping
Negative (isotype) reagent control
Use this control with each specimen to determine
nonspecific
binding of the mouse monoclonal antibody to the cells
and
to set markers for distinguishing
fluorescence-negative and
fluorescence-positive cell populations.
Use a monoclonal antibody with no specificity for
human
blood cells but of the same isotype(s) as the test
reagents.
Note: In many cases, the isotype control may not be
optimal
for controlling nonspecific fluorescence because of
differences in F/P ratio, antibody concentration
between
the isotype control and the test reagents, and other
characteristics of the immunoglobulin in the isotype
control. Additionally, isotype control reagents from
one
manufacturer are not appropriate for use with test
reagents
from another manufacturer. At this time there is no
solution
to these problems.
Positive methodologic control
Use this control to determine whether procedures for
preparing and processing the specimens are optimal.
This
control is prepared each time patient specimens are
prepared.
Use a whole blood specimen from a control donor.
Ideally,
this control will match the population of patients
tested
in the laboratory (see Section K.4.).
If this control falls outside established normal
ranges,
determine the reason. Note: The purpose of the
methodologic
control is to detect problems in preparing and
processing
the specimens. Biologic reasons that cause only this
control
to fall outside normal ranges do not invalidate the
results
from other specimens processed at the same time. Poor
lysis
or poor labeling in all specimens, as well as the
methodologic control, invalidates the results.
Positive control for testing reagents
Use this control to test the labeling efficiency of
new
lots of reagents or when the labeling efficiency of
the
current lot is questioned. Prepare this control only
when
needed (when reagents are in question), in parallel
with
lots of reagents of known acceptable performance.
Note:
New reagents must demonstrate similar results to those
of
known acceptable performance.
Use a whole blood specimen or other human lymphocyte
preparation (cryopreserved or lyophilized
lymphocytes).
Flow cytometer quality control (38)
Align optics daily. This assures that the brightest and
tightest
peaks are produced in all parameters. Note: Some clinical
flow
cytometers can be aligned by laboratory personnel and
others
can be aligned only by qualified service personnel.
Align the flow cytometer using stable calibration
material
(such as microbeads labeled with fluorochromes) that
has
measurable forward scatter, side scatter, FITC, and PE
peaks.
Align the calibration particles optimally in the path
of
the laser beam and in relation to the collection lens,
so
the brightest and tightest peaks are obtained.
Align stream-in-air flow cytometers daily (at a
minimum)
and stream-in-cuvette flow cytometers (most clinical
flow
cytometers are this type) as recommended by the
manufacturer.
Standardize daily. This ensures that the flow cytometer is
performing optimally each day and that its performance is
the
same from day to day.
Select machine settings that are optimal for
fluorochrome-
labeled whole blood specimens.
Use microbeads or other stable standardization
material to
place the scatter and fluorescence peaks in the same
scatter
and fluorescence channels each day. Adjust the flow
cytometer
as needed.
Maintain records of all daily standardizations.
Monitor these
to identify any changes in flow cytometer performance.
Retain machine standardization settings for the
remaining
quality control procedures (sensitivity and color
compensation) as well as for reading the specimens.
Determine fluorescence resolution daily. The flow cytometer
must
differentiate between the dim peak and autofluorescence in
each
fluorescence channel.
Evaluate standardization or calibration material or
cells
that have low-level fluorescence that can be separated
from
autofluorescence (e.g., microbeads with low-level and
negative fluorescence or CD56-labeled lymphocyte
preparation).
Establish a minimal acceptable distance between peaks,
monitor this difference, and correct any daily
deviations.
Compensate for spectral overlap daily. This step corrects
the
spectral overlap of one fluorochrome into the fluorescence
spectrum of another.
Use either microbead or cellular compensation material
containing three populations for two-color
immunofluorescence
(no fluorescence, PE fluorescence only, and FITC
fluorescence
only) or four populations for three-color
immunofluorescence
(the three above plus a population that is positive
for only
the third color). Note: microbeads are generally only
available for FITC and PE and not for a third
fluorochrome.
Analyze this material and adjust the electronic
compensation
circuits on the flow cytometer to place the
fluorescent
populations in their respective fluorescence quadrants
with
no overlap into the double-positive quadrant
(Figure_1).
If three fluorochromes are used, it is important that
compensation be carried out in an appropriate
sequence:
FITC, PE, and the third color, respectively (39). Take
care
to avoid overcompensation.
If standardization or calibration particles
(microbeads)
have been used to set compensation, confirm this by
using
lymphocytes labeled with FITC- and PE-labeled
monoclonal
antibodies (and a third-color-labeled monoclonal
antibody
for three-color panels) that recognize separate cell
populations but do not overlap. These populations
should
have the brightest expected signals. Note: If a
dimmer-
than-expected signal is used to set compensation,
suboptimal
compensation for the brightest signal can result.
Reset compensation when photomultiplier tube voltages
or
optical filters are changed.
Repeat all four instrument quality control procedures
whenever
instrument problems occur or if the instrument is serviced
during
the day.
Maintain instrument quality control logs, and monitor them
continually for changes in any of the parameters. In the
logs,
record instrument settings as well as peak channels and
coefficient
of variation (CV) values for optical alignment,
standardization,
fluorescence resolution, and spectral compensation.
Reestablish
fluorescence levels for each quality control procedure when
lots
of beads are changed.
Sample analyses
For the two-color immunophenotyping panel, analyze the
sample
tubes of each patient's specimen in the following order:
The tube containing CD45 and CD14 (gating reagent):
read
this tube first so that gates can be set around the
lymphocyte cluster.
Isotype control: set cursors for differentiating
positive
and negative populations so that less than or equal to
2%
of the cells are positive.
Remaining tubes in the panel.
Count at least 2,500 gated lymphocytes in each sample. This
number
assures with 95% confidence that the result is less than or
equal
to 2% (standard deviation {SD}) of the "true" value
(binomial
sampling). Note: This model assumes that variability
determined
from preparing and analyzing replicates is less than or
equal to
2% SD. Each laboratory must determine the level of
variability by
preparing and analyzing at least eight replicates of the
last
four tubes in the recommended panel. Measure variability
when
first validating the methodology used and again when
methodologic
changes are made.
Examine light-scattering patterns on each sample tube.
Determine
whether lysis or sample preparation, which can affect light
scattering, is the same in each sample tube of a patient's
specimen. Deviation in a particular tube usually indicates
sample
preparation error, and the tube should be repeated (a new
aliquot
of blood is stained and lysed).
Data analysis
Reading from the sample tube containing CD45 and CD14, draw
lymphocyte gates using forward and side light-scattering
patterns
and fluorescence staining. Note: Other methods of drawing
lymphocyte gates may be used with three-color monoclonal
antibody
panels. These may include using CD45-bright positivity and
low
side scattering patterns or reading from a tube containing
labeled T, B, and NK cell populations to identify
lymphocytes.
If verified, these methods may be used instead of light
scatter
gating using the CD45 and CD14 tube.
When using CD45 and CD14 and light-scattering patterns
for
drawing lymphocyte gates, define populations on the
following
basis:
Lymphocytes stain brightly with CD45 and are
negative
for CD14.
Monocytes and granulocytes have greater forward
and
side light-scattering properties than
lymphocytes.
Monocytes are positive for CD14 and have
intermediate
intensity for CD45.
Granulocytes are dimly positive for CD14 and
show
less intense staining with CD45.
Debris, red cells, and platelets show lower
forward
scattering than lymphocytes and do not stain
specifically with CD45 or CD14.
Using the above characteristics, draw a
light-scattering
gate around the lymphocyte population (40). Note:
Other
methods for drawing a lymphocyte gate must accurately
identify lymphocytes and account for nonlymphocyte
contamination of the gate.
Verify the lymphocyte gate by determining the recovery of
lymphocytes within the gate and the lymphocyte purity of
the
gate.
Definitions
The lymphocyte recovery (previously referred to
as
the proportion of lymphocytes within the gate)
is the
percentage of lymphocytes in the sample that
are
within the gate.
The lymphocyte purity of the gate is the
percentage
of cells within the gate that are lymphocytes.
The
remainder may be monocytes, granulocytes, red
cells,
platelets, and debris.
The lymphocyte recovery should optimally be at least
95%.
The lymphocyte purity of the gate should optimally be
at
least 90%.
Optimal gates include as many lymphocytes and as few
contaminants as possible.
Lymphocyte recovery within the gate using CD45 and
CD14
can be determined by two different methods: light
scatter
gating and fluorescence gating (Figure_2 and
Figure_3).
Note: The number of lymphocytes identified will be
the same
whether determined by light scatter gating or by
fluorescence
gating.
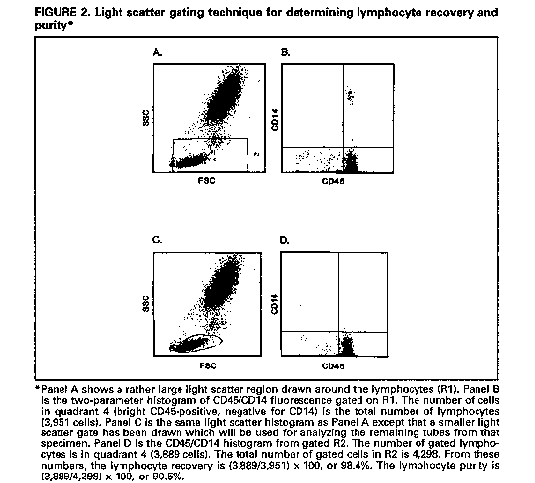
Lymphocyte recovery determined by light scatter
gating
is done as follows. First, identify the
lymphocytes
by setting a relatively large light scatter
gate
(Figure_2, Panel A), then set an analysis
region
around CD45 and CD14 lymphocyte reactivity
(bright
CD45-positive, negative for CD14)
(Figure_2,
Panel B). Determine the number of cells that
meet
both criteria (total number of lymphocytes).
Set a
smaller lymphocyte light scatter gate that will
be
used for analyzing the remaining tubes
(Figure_2,
Panel C). Determine the number of cells that
fall
within this gate as well as the CD45/CD14
analysis
region (bright CD45-positive, negative for
CD14)
(Figure_2, Panel D). This number divided by
the
total number of lymphocytes times 100 is the
lymphocyte recovery. The advantage of this
method is
that it can easily be done on most software
programs.
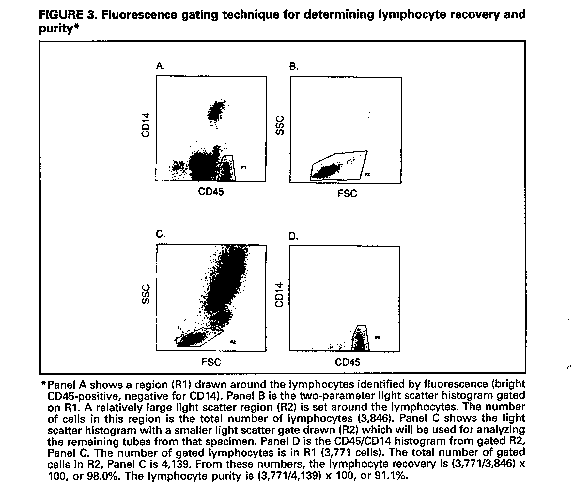
Lymphocyte recovery determined by fluorescence
gating
is done as follows. First, identify lymphocytes
by
setting a fluorescence gate around the bright
CD45-
positive, CD14-negative cells (Figure_3,
Panel A),
then set an analysis region around a large
light
scatter region that includes lymphocytes
(Figure_3,
Panel B). The number of cells that meet both
criteria
is the total number of lymphocytes. Set a
smaller
lymphocyte light scatter gate that will be used
for
analyzing the remaining tubes (Figure_3,
Panel C).
Determine the number of cells that fall within
this
gate as well as the CD45/CD14 analysis region
(bright
CD45+, negative for CD14)(Figure_3, Panel
D).
This number divided by the total number of
lymphocytes
times 100 is the lymphocyte recovery. The
advantage
of this method is that the light scatter
pattern of
lymphocytes can be easily determined. Note:
Some
instrument software packages automatically
determine
lymphocyte recovery by fluorescence gating;
others
do not.
The lymphocyte purity of the gate is determined from
the
CD45 and CD14 tube by calculating the percentage of
cells
in the light-scattering gate that are bright
CD45-positive
and negative for CD14.
If the recommended recovery and purity of lymphocytes
within
the gate cannot be achieved, redraw the gate. If
minimum
levels still cannot be obtained, reprocess the
specimen. If
this fails, request another specimen.
Set cursors using the isotype control so that less than 2%
of
cells are positive.
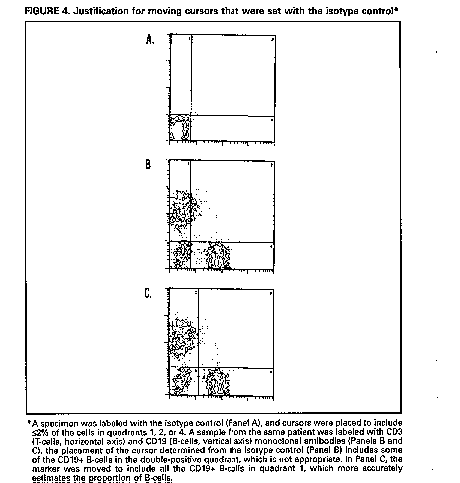
Analyze the remaining samples with the cursors set based on
the
isotype control. Note: In some instances, the isotype-set
cursors
will not accurately separate positive and negative staining
for
another sample tube from the same specimen. In such cases,
the
cursors can be moved on that sample to more accurately
separate
these populations (Figure_4). This should not be done
when
fluorescence distributions are continuous with no clear
demarcation between positively and negatively labeled
cells.
Analyze each patient specimen or normal control specimen
with
light-scattering gates and cursors for positivity set for
that
particular patient or control.
Where spectral compensation of a particular specimen
appears to
be inappropriate because FITC-labeled cells have been
dragged
into the PE-positive quadrant or vice-versa (when
compensation
on all other specimens is appropriate)(41), repeat the
sample
preparation, prewashing the specimen with
phosphate-buffered
saline (PBS), pH 7.2, to remove plasma before monoclonal
antibodies are added.
Include the following analytic reliability checks:
Optimally, at least 95% lymphocyte recovery
(proportion of
lymphocytes within the lymphocyte gate) should be
achieved.
Minimally, at least 90% lymphocyte recovery should be
achieved.
Optimally, at least 90% lymphocyte purity should be
observed
within the lymphocyte gate. Minimally, at least 85%
purity
should be observed within the gate.
Optimally, the sum of the %CD3+CD4+ and %CD3+CD8+
cells
should equal the total %CD3+ cells within plus or
minus 5%,
with a maximum variability of less than or equal to
10%.
Note: In specimens containing a considerable number of
Tg/d
cells (42,43), this reliability check may excede the
maximum
variability.
Optimally, the sum of the %CD3+ (T-cells), %CD19+
(B-cells),
and the %CD3-(CD16 and/or CD56)+ (NK-cells) should
equal the
purity of lymphocytes in the gate plus or minus 5%
(36), with
a maximum variability of less than or equal to 10%. If
the
data are corrected for lymphocyte purity (see K.2.),
the sum
should equal 95%-105% (or a minimum of 90%-110%).
Data storage
If possible, store list-mode data on all specimens
analyzed. This
allows reanalysis of the raw data, including redrawing
gates. At
a minimum, retain hard copies of the lymphocyte gate and
correlated dual histogram data of the fluorescence of each
sample.
Retain all primary files, worksheets, and report forms for
2
years or as required by state or local regulation,
whichever is
longer. Data can be stored electronically. Disposal after
the
retention period is at the discretion of the laboratory
director.
Data reporting
Report all data in terms of CD designation, with a short
description of what that designation means. Note: CD4+
T-cells are
T-helper cells. The correct cells to report for this value
are
those that are positive for both CD3 and CD4 (determined
from
tube 3 in the suggested two-color panel). Similarly, CD8+
T-cells
are T-suppressor/cytotoxic cells, and these are positive
for both
CD3 and CD8 (tube 4 in the two-color panel). It is
important not
to include other cell types (non-T-cells) in CD4 and CD8
determinations.
Report data as a percentage of the total lymphocytes and
correct
for the lymphocyte purity of the gate. For example, if the
lymphocyte purity is 94% and the CD3 value is 70%, correct
the CD3
value by dividing 0.70 by 0.94 and then multiply the result
by 100
to give a T-lymphocyte value of 74%.
Report absolute lymphocyte subset values when an automated
complete blood cell (CBC) count (WBC and differential) has
been
performed from blood drawn at the same time as that for
immunophenotyping.
Calculate the absolute values by multiplying the
lymphocyte
subset percentage (from flow cytometry data) by the
absolute
number of lymphocytes (from WBC and differential).
Note: The
hematology laboratory providing the CBC (WBC and
differential)
must perform satisfactorily in a hematology
proficiency
testing program approved by the Health Care Finance
Administration (HCFA) as meeting the requirements of
the
Clinical Laboratory Improvement Amendments of 1988
(CLIA '88).
Report both percentages and absolute counts when these
are
available.
Report data from all relevant monoclonal antibody
combinations
with corresponding reference limits of expected normal
values
(e.g., CD4+ T-cell percentage and absolute number of CD4+
T-cells).
Reference limits for immunophenotyping test results must be
determined for each laboratory. Separate reference ranges
must be
established for adults and children, and the appropriate
ranges
must be used for patient specimens. See reference 38 for
methods
for determining these limits.
Quality assurance
Assure the overall quality of the laboratory's CD4+ T-cell
testing
by monitoring and evaluating the effectiveness of the
laboratory
policies and procedures for the preanalytic, analytic, and
postanalytic testing phases. The practices and processes to
be
monitored and evaluated include:
Methods for collecting, handling, transporting,
identifying,
processing, and storing specimens.
Information provided on test request and results
report forms.
Instrument performance, quality control protocols, and
maintenance.
Reagent quality control protocols.
Process for reviewing and reporting of results.
Employee training and education, which should consist
of:
Basic training by flow cytometer manufacturers
and
additional training in hands-on workshops for
flow
cytometer operators and supervisors.
Education of laboratory directors in flow
cytometric
immunophenotyping through workshops and other
programs.
Continuing education in new developments for
all flow
cytometric immunophenotyping personnel through
attendance at meetings and workshops.
Adherence to federal and state regulations for
training
and education.
Assurance of satisfactory performance. Laboratories
must
successfully participate in a performance evaluation
program.
When proficiency testing programs are approved by HCFA
as
meeting the requirements of CLIA '88 (none are
currently
approved for CD4+ T-cell testing), laboratories must
satisfactorily participate.
Review and revision (as necessary, or at established
intervals) of the laboratory's policies and procedures
to
assure adherence to the quality assurance program. All
staff
involved in the testing should be informed of any
problems
identified during the quality assurance review and the
corrective actions taken to prevent recurrences.
Document all quality assurance activities.
DISCUSSION
Though there is no standard for immunophenotyping using flow
cytometry, laboratories now have several detailed guidelines to
follow (10,38,44,45). Proficiency testing programs have shown that
laboratory performance for CD4+ T-cell percentages has improved
over the last several years (46-48). In addition, CLIA '88 requires
that certain levels of laboratory quality control and performance
be attained to qualify the laboratory for clinical testing. This QC
and performance requirement pertains to immunophenotyping using
flow cytometry.
Absolute lymphocyte subset values are obtained from three
separate determinations: a) the WBC, b) the leukocyte differential,
and c) the percent positive cells from flow cytometry. Even though
the flow cytometry results have improved in interlaboratory
performance programs, the hematology results have been less
carefully studied. This is primarily because most recommendations
for hematology measurements state that differentials must be done
within 6 hours of blood drawing (24,25). With these time
constraints, it is not possible to evaluate performance in
proficiency testing programs because these specimens do not usually
arrive in the laboratory until the following day. Further
improvements in absolute lymphocyte subset values, including
absolute CD4+ T-cells, can be achieved through improving the
hematology determinations. Newer hematology technology may produce
accurate WBC and differential determinations on blood drawn 24
hours earlier, but time limitations for the blood must be carefully
tested to validate these instruments.
The intralaboratory analytic variability (CV) in determining
the WBC count using an automated leukocyte counter is 2.2%-7.7%,
and 9.3%-17.6% using a hemocytometer. The lymphocyte differential
varies from 1.9% to 5.3% for automated counts and from 12.5% to 27%
for manual counts (33). Therefore, the variability in the absolute
number of lymphocytes in the blood reflects the combined
variability of the WBC count and the lymphocyte differential.
Biologic variability is even greater: about 10% diurnally and 13%
week to week (49).
Estimates of interlaboratory variability (SD) in flow
cytometric immunophenotyping results have been derived from
proficiency testing and performance evaluation data (46,47; CDC,
Model Performance Evaluation Program, unpublished data). An
analysis of data from the College of American Pathologists surveys
between 1989 and 1991 of more than 200 laboratories showed that the
SD of the percentage of CD4+ T-cells was 4.7% to 8.4%, with the
lower number associated with CD4 T-cell percentages near 25% and
the higher with percentages near 50% (46). For duplicate
measurements, the SD of the percentage of CD4+ T-cells was about 3%
when the specimen contained 45% CD4+ T-cells. The results furnished
to CDC by 280 laboratories participating in the MPEP for
T-lymphocyte immunophenotyping in March 1991 indicated the same
trends. For samples of CD4+ values in the range of 1% to 16%, the
SD of the percentage of CD4+ T-cells was about 2.5%; for samples
with CD4+ values between 16% and 24%, the SD was about 3.4%. In the
National Institutes of Allergy and Infectious Diseases, Division of
AIDS quality assurance program, the SDs ranged from 2.7% for
HIV-negative specimens to 2.6% for HIV-positive specimens with
greater than 10% CD4+ T-cells and 1.9% for HIV-positive specimens
with less than or equal to 10% CD4+ T-cells (47).
Limited information is available on the degree of
interlaboratory variability in CD4+ T-cell counts. In a multicenter
proficiency testing study (48) of seven laboratories for the year
1987, interlaboratory CVs for the percentage and absolute number of
CD4+ T-cells on normal specimens were 6% and 29.4%, respectively.
This study has been ongoing and, through rigorous quality assurance
and training, CV values have been reduced each year. Subsequently,
in 13 laboratories in 1991, CVs for the percentage and absolute
number of CD4+ T-cells on normal specimens were 5.1% and 7.0%,
respectively (48).
To bypass the variability of absolute CD4+ T-cell numbers,
alternative technologies to enumerate CD4 cells are being or have
been developed by several manufacturers. These technologies will
require less technical expertise and be less expensive and
time-consuming than flow cytometry. Additionally, since these
procedures derive the absolute CD4 cell numbers from one
measurement rather than three measurements (WBC, differential, and
flow cytometry), the variability of the CD4 cell number by these
technologies should be less than that of flow cytometry and
hematology combined. All these new methodologies vary greatly in
the procedures by which the CD4 cell numbers are obtained. They
measure CD4 in different ways: on T-cells, on lymphocytes, or in
whole blood lysates. Because of these differences, quality control
for each of these procedures will differ. Careful validation of
these methodologies under a variety of conditions is needed. It is
likely that these technologies will be found in clinical
laboratories in the near future, and it is imperative that
manufacturers and clinical laboratorians work together to establish
QC guidelines and help ensure the quality of the CD4 cell results.
This document reflects current information on QA/QC procedures
for immunophenotyping to determine CD4+ T-cell levels in
HIV-infected persons. Revisions made to the 1992 guidelines (10)
are the result of additional data, new methodology, and better
understanding of variables that contribute to how specimens are
processed and analyzed. This technology continues to evolve. These
guidelines will be revised again as newer techniques and reagents
are developed and more data become available.
References
DeWolf F, Roos M, Lange JMA, et al. Decline in CD4+ cell
numbers
reflects increase in HIV-1 replication. AIDS Res Hum
Retroviruses
1988;4:433-40.
Giorgi J, Nishanian P, Schmid I, Hultin L, Cheng H, Detels R.
Selective alterations in immunoregulatory lymphocyte subsets in
early HIV (human T-lymphotropic virus type
III/lymphadenopathy-associated virus) infection. J Clin Immunol
1987;7:140-50.
Lang W, Perkins H, Anderson RE, Royce R, Jewell N, Winkelstein
W Jr. Patterns of T-lymphocyte changes with human
immunodeficiency
virus infection: from seroconversion to the development of
AIDS. J
AIDS 1989;2:63-9.
Masur H, Ognibene FP, Yarchoan R, et al. CD4 counts as
predictors of opportunistic pneumonias in human
immunodeficiency
virus (HIV) infection. Ann Intern Med 1989;111:223-31.
Fahey JL, Taylor JMG, Detels R, et al. The prognostic value of
cellular and serologic markers in infection with human
immunodeficiency virus type 1. N Engl J Med 1990;322:166-72.
Smith RD. The pathobiology of HIV infection. Arch Pathol Lab
Med
1990;114:235-9.
CDC. Recommendations for prophylaxis against Pneumocystis
carinii pneumonia for adults and adolescents infected with
human
immunodeficiency virus. MMWR 1992;41(No. RR-4).
National Institutes of Health. Recommendations for zidovudine:
early infection. JAMA 1990;263(12):1606,1609.
CDC. 1993 Revised classification system for HIV infection and
expanded surveillance case definition for AIDS among
adolescents
and adults. MMWR 1992;41(No. RR-17):1-35.
CDC. Guidelines for the performance of CD4+ T-cell
determinations in persons with human immunodeficiency virus
infection. MMWR 1992;41(No. RR-8):1-17.
CDC. Update: universal precautions for prevention of
transmission of human immunodeficiency virus, hepatitis B
virus,
and other bloodborne pathogens in health-care settings. MMWR
1988;37(24):377-82, 387-8.
CDC. 1988 Agent summary statement for human immunodeficiency
virus and report on laboratory-acquired infection with human
immunodeficiency virus. MMWR 1988;37(No. SS-4):1-22.
CDC. Recommendations for prevention of HIV transmission in
health-care settings. MMWR 1987;36(2S):1S-18S.
CDC. Acquired immunodeficiency syndrome (AIDS): precautions for
clinical and laboratory staffs. MMWR 1982;31:577-80.
CDC. Acquired immunodeficiency syndrome (AIDS): precautions for
health-care workers and allied professionals. MMWR
1983;32:450-2.
CDC. Recommendations for preventing transmission of infection
with human T-lymphotropic virus type
III/lymphadenopathy-associated
virus in the workplace. MMWR 1985;34(45):681-95.
CDC and NIH. Biosafety in microbiological and biomedical
laboratories. 3rd ed. US Department of Health and Human
Services,
1993.
National Committee for Clinical Laboratory Standards.
Protection of laboratory workers from infectious disease
transmitted by blood, body fluids, and tissue. NCCLS Document
M29-T2. Villanova, PA, 1991.
Nicholson JKA, Browning SW, Orloff SL, McDougal JS.
Inactivation of HIV-infected H9 cells in whole blood
preparations
by lysing/fixing reagents used in flow cytometry. J Immunol
Methods
1993;160:215-8.
Cory JM, Rapp R, Ohlsson-Wilhelm BM. Effects of cellular
fixatives on human immunodeficiency virus production. Cytometry
1990;11:647-51.
Aloisio CH, Nicholson JKA. Recovery of infectious human
immunodeficiency virus from cells treated with 1%
paraformaldehyde.
J Immunol Methods 1990;128:281-5.
Lifson JD, Sasaki DT, Engleman EG. Utility of formaldehyde
fixation for flow cytometry and inactivation of the
AIDS-associated
retrovirus. J Immunol Methods 1986;86:143-9.
Martin LS, Loskoski SL, McDougal JS. Inactivation of human
T-lymphotropic virus type III/ lymphadenopathy-associated virus
by
formaldehyde-based reagents. Appl Environ Microbiol
1987;53:708-9.
National Committee for Clinical Laboratory Standards. Additives
to blood collection devices: EDTA. NCCLS Document H35-P.
Villanova,
PA, 1989.
National Committee for Clinical Laboratory Standards. Reference
leukocyte differential count (proportional) and evaluation of
instrumental methods. NCCLS Document H20-A. Villanova, PA,
1992.
Paxton H, Bendele T. Effect of time, temperature, and
anticoagulant on flow cytometry and hematological values. Ann
NY
Acad Sci 1993;677:440-3.
Nicholson JK, Green TA, Collaborating Laboratories. Selection
of anticoagulants for lymphocyte immunophenotyping: effect of
specimen age on results. J Immunol Methods 1993;165:31-5.
National Committee for Clinical Laboratory Standards.
Procedures for the collection of diagnostic blood specimens by
venipuncture. 2nd ed. Approved Standard. NCCLS Publication
H3-A2,
Villanova, PA, 1984.
Shield CF III, Manlett P, Smith A, Gunter L, Goldstein G.
Stability of human leukocyte differentiation antigens when
stored
at room temperature. J Immunol Methods 1983;62:347-52.
McCoy JP Jr, Carey JL, Krause JR. Quality control in flow
cytometry for diagnostic pathology: 1. Cell surface phenotyping
and
general laboratory procedures. Am J Clin Pathol 1990;93 (Suppl
1):S27-S37.
Ekong T, Kupek E, Hill A, Clark C, Davies A, Pinching A.
Technical influences on immunphenotyping by flow cytometry. The
effect of time and temperature of storage on the viability of
lymphocyte subsets. J Immunol Methods 1993;164:263-73.
Code of Federal Regulations, part 72. Interstate shipment of
etiologic agents, 1987:59-63.
Koepke JA, Landay AL. Precision and accuracy of absolute
lymphocyte counts. Clin Immunol Immunopathol 1989;52:19-27.
Nicholson JKA, Jones BM, Cross D, McDougal S. Comparison of T
and B cell analysis on fresh and aged blood. J Immunol Methods
1984;73:29-40.
Weiblen BJ, Debell K, Giorgio A, Valeri CR. Monoclonal antibody
testing of lymphocytes after overnight storage. J Immunol
Methods
1984;70:179-83.
Schenker EL, Hultin LE, Bauer KD, Ferbas J, Margolick JB,
Giorgi JV. Evaluation of a dual-color flow cytometry
immunophenotyping panel in a multicenter quality assurance
program.
Cytometry 1993;14:307-17.
Knapp W, Dorken K, Gilks WR, Rieber EP, Schmidt RE, Stein H,
von dom Borne AEGKR, eds. Leukocyte typing IV: white cell
differentiation antigens. Oxford: Oxford University Press,
1989.
National Committee for Clinical Laboratory Standards. Clinical
applications of flow cytometry. Quality assurance and
immunophenotyping of peripheral blood lymphocytes. NCCLS
Publication H24-T. Villanova, PA, 1992.
Mandy FF, Bergeron M, Recktenwald D, and Izaguirre CA. A
simultaneous three-color T cell subsets analysis with single
laser
flow cytometers using T cell gating protocol. Comparison with
conventional two-color immunophenotyping method. J Immunol
Methods
1992;156:151-62.
Loken MR, Brosnan JM, Bach BA, Ault KA. Establishing optimal
lymphocyte gates for immunophenotyping by flow cytometry.
Cytometry
1990;11:453-9.
Ekong T, Gompels M, Clark C, Parkin J, Pinching A.
Double-staining artefact observed in certain individuals during
dual-colour immunophenotyping of lymphocytes by flow cytometry.
Cytometry 1993;14:679-84.
Margolick JB, Scott ER, Odaka N, Saah AJ. Flow cytometric
analysis of gamma delta T cells and natural killer cells in
HIV-1
infection. Clin Immunol Immunopathol 1991;58:126-38.
DePaoli P, Gennari D, Martelli P, et al. A subset of
lymphocytes is increased during HIV-1 infection. Clin Exp
Immunol
1991;83:187-91.
Association of State and Territorial Public Health Laboratory
Directors. Report and recommendations. Flow cytometry. Sixth
Annual
Conference on Human Retrovirus Testing, Kansas City, MO,
1991:17-9.
Calvelli T, Denny TN, Paxton H, Gelman R, Kagan J. Guidelines
for flow cytometric immunophenotyping: a report from the
National
Institutes of Allergy and Infectious Diseases, Division of
AIDS.
Cytometry 1993;14:702-15.
Homburger HA, Rosenstock W, Paxton H, Paton ML, Landay AL.
Assessment of interlaboratory variability of immunophenotyping.
Ann
NY Acad Sci 1993;677:43-9.
Gelman R, Cheng S-C, Kidd P, Waxdal M, Kagan J. Assessment of
the effects of instrumentation, monoclonal antibody, and
fluorochrome on flow cytometric immunophenotyping: a report
based
on 2 years of the NIAID DAIDS flow cytometry quality assessment
program. Clin Immunopathol 1993;66(2):150-62.
Rickman WJ, Monical C, Waxdal MJ. Improved precision in the
enumeration of absolute numbers of lymphocyte phenotypes with
long-term monthly proficiency testing. Ann NY Acad Sci
1993;677:53-8.
Statland BE, Winkel P. Physiological variability of leukocytes
in healthy subjects. In: Koepke JA, ed. Differential leukocyte
counting. Skokie, IL: College of American Pathology,
1978:23-38.
APPENDIX
Table_A1 Table_1 Note:
To print large tables and graphs users may have to change their printer settings to landscape and use a small font size.
TABLE 1. Recommended 2-color monoclonal antibody panel for lymphocyte immunophenotyping
============================================================================================
FITC *        PE +                               Reason for using
-------------------------------------------------------------------------------------
CD45          CD14         To draw gates; lymphocytes are brightly positive for
                             CD45 and negative for CD14

Isotype      Isotype       To set cursors

CD3            CD4         To measure CD4+ T-cells; only cells positive for both CD4
                             and CD3 should be considered CD4+ T-cells

CD3            CD8         To measure CD8+ T-cells; only cells that are positive for
                             both CD8 and CD3 should be considered CD8+ T-cells.
                             The remainder of the CD8 cells (CD3-) are natural killer
                             (NK)-cells

CD3          CD19 &        To measure B-cells for quality assurance and to help
                             account for all lymphocytes

CD3        CD16 and/or     To measure NK-cells (negative for CD3, positive for CD16
             CD56 &          and/or CD56) for quality assurance and to help account
                             for all Iymphocytes.
-------------------------------------------------------------------------------------
* Fluorescein isothiocyanate.
+ Phycoerythrin or RD-1 (Coulter(TM)).
& A minimal acceptable 2-color panel omits these two monoclonal antibody combinations. See
  Note under specimen processing (E.2.c.ii) before deciding to use an abbreviated panel.
============================================================================================
Disclaimer
All MMWR HTML versions of articles are electronic conversions from ASCII text into HTML. This conversion may have resulted in character translation or format errors in the HTML version. Users should not rely on this HTML document, but are referred to the electronic PDF version and/or the original MMWR paper copy for the official text, figures, and tables. An original paper copy of this issue can be obtained from the Superintendent of Documents, U.S. Government Printing Office (GPO), Washington, DC 20402-9371; telephone: (202) 512-1800. Contact GPO for current prices.
**Questions or messages regarding errors in formatting should be addressed to mmwrq@cdc.gov.
