 |
|
|
|
|
|
|
| ||||||||||
|
|
|
|
|
|
|
||||
| ||||||||||
|
|
|
|
|
Persons using assistive technology might not be able to fully access information in this file. For assistance, please send e-mail to: mmwrq@cdc.gov. Type 508 Accommodation and the title of the report in the subject line of e-mail. Mortality Patterns -- United States, 1991In 1991, 2,169,518 deaths were registered in the United States -- 21,055 more than in 1990 and the most ever recorded (1). Despite this increase, the overall age-adjusted death rate * was 513.7 per 100,000 population, the lowest ever recorded. Provisional data for 1992 indicate that the death rate continued to decline through 1992 (1). As in previous years, nearly two thirds of deaths in 1991 were caused by the first three leading causes of death (i.e., heart disease, cancer, and stroke). This report summarizes mortality data for 1991 (2) and compares patterns with 1990. National death statistics are based on information contained on death certificates filed in state vital statistics offices as required by state law and are compiled by CDC's National Center for Health Statistics into a national data base for monitoring the nation's health and for research. In this report, cause-of-death statistics are based on the underlying cause of death. ** The causes of death are recorded on the death certificate by the attending physician, medical examiner, or coroner as specified by the World Health Organization (WHO) and endorsed by CDC. For nine of the 15 leading causes of death, mortality decreased from 1990 to 1991 (Table_1) *** the age-adjusted death rate for heart disease (International Classification of Diseases, Ninth Revision {ICD-9}, codes 390-398, 402, and 404-429), the leading cause of mortality in the United States, declined 2.5%. Mortality from unintentional injuries decreased 4.6%, the largest decline among the 15 leading causes of death. Mortality from cancer decreased 0.4%, and mortality from stroke decreased 3.2%. In contrast, mortality from chronic obstructive pulmonary disease (COPD) and allied conditions (ICD-9 codes 490-496), homicide and legal intervention (ICD-9 codes E960-E978), and human immunodeficiency virus (HIV) infection (ICD-9 codes 042-044) **** increased 2.0%, 6.9%, and 15.3%, respectively. The death rates from homicide and HIV infection in 1991 were the highest ever recorded. Provisional data for 1992 indicate that HIV is the eighth leading cause of death in the United States (2). Compared with 1990, age-adjusted death rates declined for whites ***** (from 492.8 to 486.8) and for blacks (from 789.2 to 780.7). Differences in death rates from leading causes of death contributed to the differential in mortality between the black and white populations in 1991. For most of the leading causes, age-adjusted death rates were higher for blacks than for whites. The largest differences in rates were for homicide and HIV infection: the rate for blacks was 6.8 times and 3.4 times that for whites, respectively (Table_2) Death rates were lower for blacks for two of the 15 leading causes of death -- COPD and allied conditions and suicide (ICD-9 codes E950-E959). As in the past, age-adjusted death rates for males in 1991 were higher than those for females (Table_2). Compared with 1990, age-adjusted death rates declined for both males (from 680.2 to 669.9) and for females (from 390.6 to 386.5). The greatest sex differential in mortality was associated with HIV infection: the rate for males was 7.4 times that for females. Rates for suicide and homicide were 4.4 and 3.8 times, respectively, higher for males than for females, and the rate for unintentional injuries (ICD-9 codes E800-E949) was 2.6 times higher for males. The smallest sex-specific difference was for diabetes mellitus (ICD-9 code 250) (male:female ratio=1.1:1). In 1991, 323 women were reported to have died of maternal causes; however, this number includes only those deaths assigned to complications of pregnancy, childbirth, and the puerperium (ICD-9 codes 630-676). The maternal mortality rate was 7.9 deaths per 100,000 live births. The maternal mortality rate for blacks was 3.2 times greater than that for whites. In 1991, 29,555 deaths were attributed to HIV infection. Age-specific death rates were highest for persons aged 35-44 years. Age-adjusted death rates were highest for black males (52.9), followed by white males (16.7), black females (12.0), and white females (1.3). In 1991, overall life expectancy (LE) at birth was 75.5 years (Figure_1) Despite increases in HIV infection and homicide, the overall LE increased by 0.1 years, primarily because of decreases in mortality from heart disease and unintentional injuries. White females continued to have the highest LE at birth (79.6 years), followed by black females (73.8 years), white males (72.9 years), and black males (64.6 years). All four racial-sex groups experienced increases in LE during 1990-1991. The gap between the life expectancy of blacks and whites remained the same as the previous year; during 1984-1989, the gap had widened. Reported by: Mortality Statistics Br, Div of Vital Statistics, National Center for Health Statistics, CDC. Editorial NoteEditorial Note: The mortality data in this report can be used to monitor the health of the nation and to identify groups at greatest risk for death from specific diseases and injuries. Differences in death rates by race may reflect differences in factors such as socioeconomic status, access to medical care, and the prevalence of specific risks. Although the data indicate that mortality from some chronic diseases (e.g., heart disease and stroke) and unintentional injuries has declined, these gains are offset by trends in younger age groups in which mortality is increasing, primarily because of homicide and HIV infection. LE summarizes death rates by age into a single measure used as an indicator of the nation's health. Overall, LE has increased every year during the past decade. Improvements in LE reflect decreases in many of the leading causes of death, particularly heart disease; however, increased LE is largely offset by mortality patterns for homicide and HIV infection. Decreasing mortality in heart disease among older persons and decreases in unintentional injuries for most age groups between ages 15 and 64 years contributed most to the increased LE for the total population. Increasing mortality attributed to HIV for all age groups, particularly between ages 25 and 54 years, and increasing mortality for homicide, particularly within the 15-24-year age group, helped offset LE gains. Another approach to mortality data is to examine the major risk factors contributing to death. A recent study emphasized the importance of risk factors as the cause of death rather than the medical cause reported by physicians on death certificates (4). Studies of attributable risk use cause-of-death profiles from the death certificate as the basis for estimates. Examining the underlying causes of death and the attributable risk of underlying risk factors has been useful in establishing public health priorities, such as the national health objectives for the year 2000 (5). References
* Age-adjusted to the 1940 U.S. population. Age-adjusted death rates indicate changes in the risk for death more effectively than crude death rates and are better indicators for comparisons of mortality by race or sex. ** Defined by the World Health Organization's International Classification of Diseases, Ninth Revision as "(a) the disease or injury which initiated the train of morbid events leading directly to death, or (b) the circumstances of the accident or violence which produced the fatal injury." *** "Motor-vehicle accidents" and "all other accidents and adverse effects" are not included as causes of death for which the rate has decreased because these causes are subcategories of the leading cause "accidents and adverse effects." When a death occurs under "accidental" circumstances, the preferred term within the public health community is "unintentional injury." **** These codes are from addenda to the ICD-9 (3).
***** Hispanics and non-Hispanics are included in totals for both
whites and blacks. Numbers for other racial/ethnic groups were too
small for meaningful analysis.
TABLE 1. Age-adjusted death rates * for 1991 and percentage changes in age-adjusted
death rates from the 15 leading causes of death from 1990 to 1991 and 1979 to 1991
-- United States
===============================================================================================
                                                                        % Change
                                                         1991       ----------------
                                                     Age-adjusted   1990 to  1979 to
Rank +  Cause of death (ICD-9 code &)                  death rate     1991     1991
------------------------------------------------------------------------------------
  1     Diseases of heart (390-398, 402, 404-429)        148.2        -2.5    -25.7
  2     Malignant neoplasms, including neoplasms of
         lymphatic and hematopoietic tissues (140-208)   134.5        -0.4      2.8
  3     Cerebrovascular diseases (430-438)                26.8        -3.2    -35.6
  4     Chronic obstructive pulmonary diseases and
         allied conditions (490-496)                      20.1         2.0     37.7
  5     Accidents @ and adverse effects (E800-E949)       31.0        -4.6    -27.7
          Motor-vehicle accidents (E810-E825)             17.0        -8.1    -26.7
          All other accidents and adverse effects
           (E800-E807, E826-E949)                         13.9        -0.7    -29.1
  6     Pneumonia and influenza (480-487)                 13.4        -4.3     19.6
  7     Diabetes mellitus (250)                           11.8         0.9     20.4
  8     Suicide (E950-E959)                               11.4        -0.9     -2.6
  9     Human immunodeficiency virus infection
         (042-044) **                                     11.3        15.3      --
  10    Homicide and legal intervention (E960-E978)       10.9         6.9      6.9
  11    Chronic liver disease and cirrhosis (571)          8.3        -3.5    -30.8
  12    Nephritis, nephrotic syndrome, and nephrosis
         (580-589)                                         4.3         --       --
  13    Septicemia (038)                                   4.1         --      78.3
  14    Atherosclerosis (440)                              2.6        -3.7    -54.4
  15    Certain conditions originating in the perinatal
         period ++ (760-779)                               --         -4.0    -39.5

        All causes                                       513.7        -1.2    -11.0
------------------------------------------------------------------------------------
 * Per 100,000 population, age-adjusted to the 1940 U.S. population.
 + Based on number of deaths.
 & International Classification of Diseases, Ninth Revision.
 @ When a death occurs under "accidental" circumstances, the preferred term within the public
   health community is "unintentional injury."
** These codes are from addenda to the ICD-9 (3).
++ Based on infant mortality rates.
===============================================================================================
Return to top. Table_2 Note: To print large tables and graphs users may have to change their printer settings to landscape and use a small font size.
TABLE 2. Ratio of age-adjusted death rates * from the 15 leading causes of death, by
sex and race of decedent -- United States, 1991
===============================================================================================
Rank +  Cause of death (ICD-9 &)                         Male:female    Black:white @
-------------------------------------------------------------------------------------
  1     Diseases of heart (390-398, 402, 404-429)            1.9            1.5
  2     Malignant neoplasms, including neoplasms of
         lymphatic and hematopoietic tissues (140-208)       1.5            1.4
  3     Cerebrovascular diseases (430-438)                   1.2            1.9
  4     Chronic obstructive pulmonary diseases and
         allied conditions (490-496)                         1.7            0.8
  5     Accidents ** and adverse effects (E800-E949)         2.6            1.3
          Motor-vehicle accidents (E810-E825)                2.4            1.0
          All other accidents and adverse effects
           (E800-E807, E826-E949)                            2.9            1.7
  6     Pneumonia and influenza (480-487)                    1.7            1.5
  7     Diabetes mellitus (250)                              1.1            2.4
  8     Suicide (E950-E959)                                  4.4            0.6
  9     Human immunodeficiency virus infection
         (042-044) ++                                        7.4            3.4
  10    Homicide and legal intervention (E960-E978)          3.8            6.8
  11    Chronic liver disease and cirrhosis (571)            2.3            1.6
  12    Nephritis, nephrotic syndrome, and nephrosis
         (580-589)                                           1.5            2.8
  13    Septicemia (038)                                     1.3            2.7
  14    Atherosclerosis (440)                                1.4            1.1
  15    Certain conditions originating in the perinatal
         period && (760-779)                                 1.3            3.1

        All causes                                           1.7            1.6
-------------------------------------------------------------------------------------
 * Per 100,000 population, age-adjusted to the 1940 U.S. population.
 + Based on number of deaths.
 & International Classification of Diseases, Ninth Revision.
 @ Both groups include Hispanics. Numbers for other racial/ethnic groups were too small for
   meaningful analysis.
** When a death occurs under "accidental" circumstances, the preferred term within the public
   health community is "unintentional injury."
++ These codes are from addenda to the ICD-9 (3).
&& Based on infant mortality rates.
===============================================================================================
Return to top. Figure_1 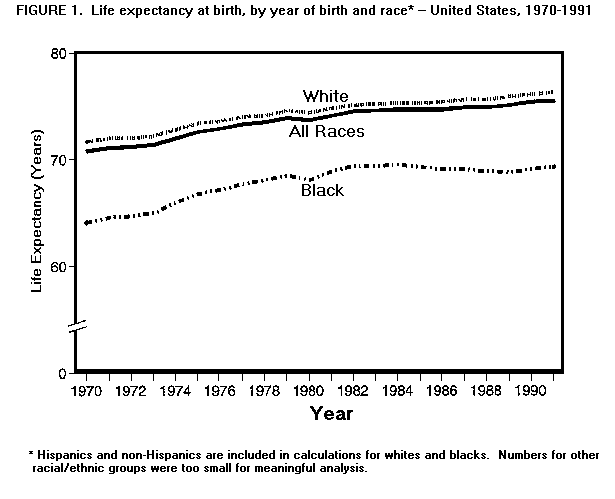 Return to top. Disclaimer All MMWR HTML versions of articles are electronic conversions from ASCII text into HTML. This conversion may have resulted in character translation or format errors in the HTML version. Users should not rely on this HTML document, but are referred to the electronic PDF version and/or the original MMWR paper copy for the official text, figures, and tables. An original paper copy of this issue can be obtained from the Superintendent of Documents, U.S. Government Printing Office (GPO), Washington, DC 20402-9371; telephone: (202) 512-1800. Contact GPO for current prices. **Questions or messages regarding errors in formatting should be addressed to mmwrq@cdc.gov.Page converted: 09/19/98 |
|||||||||
This page last reviewed 5/2/01
|