 |
|
|
|
|
|
|
| ||||||||||
|
|
|
|
|
|
|
||||
| ||||||||||
|
|
|
|
|
Persons using assistive technology might not be able to fully access information in this file. For assistance, please send e-mail to: mmwrq@cdc.gov. Type 508 Accommodation and the title of the report in the subject line of e-mail. Surveillance for Influenza --- United States, 1994--95, 1995--96, and 1996--97 SeasonsT. Lynnette Brammer, M.P.H. AbstractProblem/Condition: Influenza epidemics occur nearly every year during the winter months and are responsible for substantial morbidity and mortality in the United States, including an average of approximately 114,000 hospitalizations and 20,000 deaths per year. Reporting Period: This report summarizes U.S. influenza surveillance data from October 1994 through May 1997, from both active and passive surveillance systems. Description of System: During the period covered, CDC received weekly reports from October through May from a) state and territorial epidemiologists on estimates of local influenza activity, b) approximately 140 sentinel physicians on their total number of patient visits and the number of cases of influenza-like illness (ILI), and c) approximately 70 World Health Organization (WHO) collaborating laboratories in the United States on weekly influenza virus isolations. WHO collaborating laboratories also submitted influenza isolates to CDC for antigenic analysis. Throughout the year, vital statistics offices in 121 cities reported deaths related to pneumonia and influenza (P&I) weekly, providing a measure of the impact of influenza on mortality. Results: During the 1994--95 influenza season, 25 state epidemiologists reported regional or widespread activity at the peak of the season. Cases of ILI reported by sentinel physicians exceeded baseline levels for 4 weeks, peaking at 5%. Influenza A(H3N2) was the most frequently isolated influenza virus type/subtype. The longest period of sustained excess mortality was 5 consecutive weeks, when the percentage of deaths attributed to P&I exceeded the epidemic threshold, peaking at 7.6%. During the 1995--96 season, 33 state epidemiologists reported regional or widespread activity at the peak of the season. ILI cases exceeded baseline levels for 5 weeks, peaking at 7%. Influenza A(H1N1) viruses predominated, although influenza A(H3N2) and influenza B viruses also were identified throughout the United States. P&I mortality exceeded the epidemic threshold for 6 consecutive weeks, peaking at 8.2%. The 1996--97 season was the most severe of the three seasons summarized in this report. Thirty-nine state epidemiologists reported regional or widespread activity at the peak of the season. ILI reports exceeded baseline levels for 5 consecutive weeks, peaking at 7%. The proportion of respiratory specimens positive for influenza peaked at 34%, with influenza A(H3N2) viruses predominating. Influenza B viruses were identified throughout the United States, but only one influenza A(H1N1) virus isolate was reported overall. The proportion of deaths attributed to P&I exceeded the epidemic threshold for 10 consecutive weeks, peaking at 9.1%. Interpretation: Influenza A(H1N1), A(H3N2), and B viruses circulated during 1994--1997. Local surveillance data are important because of geographic and temporal differences in the circulation of influenza types/subtypes. Public Health Actions: CDC conducts active national surveillance annually from October through May for influenza to detect the emergence and spread of influenza virus variants and monitor the impact of influenza-related morbidity and mortality. Surveillance data are provided weekly throughout the influenza season to public health officials, WHO, and health-care providers and can be used to guide prevention and control activities, vaccine strain selection, and patient care. INTRODUCTIONEpidemics of influenza occur nearly every year during the winter months and are responsible for substantial morbidity and mortality in the United States, including an average of approximately 114,000 hospitalizations and 20,000 deaths per year (1). Annual vaccination is recommended for groups at increased risk, including adults aged >50 years, persons with underlying chronic health conditions (e.g., cardiovascular disease, pulmonary disease, and certain metabolic conditions), and women in their second or third trimester of pregnancy (1,2). During influenza epidemics, hospitalization rates among older adults and persons with underlying chronic health problems can increase twofold to fivefold over nonepidemic periods (3). Influenza epidemics also are associated with increased mortality. From the 1972--73 season through the 1994--95 season, the average number of influenza-associated deaths was approximately 20,000 per year. During six of those seasons, >40,000 influenza-associated deaths occurred (1,4). In recent years, >90% of influenza-associated deaths have occurred among persons aged >65 years (5). The Advisory Committee on Immunization Practices (ACIP) recommends annual vaccination of persons at high risk for influenza-associated complications as the most effective way to reduce the impact of influenza. ACIP also recommends annual vaccination of persons in frequent contact with persons at high risk to reduce transmission to those at high risk (1). Influenza vaccination is 70%--90% effective in preventing influenza-like illness (ILI) in young, healthy adults when the vaccine antigens closely match the circulating influenza virus strains (6). Among nursing home residents aged >65 years, influenza vaccine is 30%--40% effective in preventing illness, 50%--60% effective in preventing serious complications and hospitalization, and 80% effective in preventing death (7,8). In addition, vaccination can reduce the risk for outbreaks in nursing home settings (9). Influenza viruses undergo constant antigenic change. Because vaccine effectiveness depends on antigenic similarity between vaccine strains and circulating viruses, one or two of the three vaccine component strains typically are updated each year. Both virologic surveillance, in which influenza viruses are isolated for antigenic characterization, and disease surveillance are necessary to identify influenza virus variants and to determine their ability to spread and cause disease. This information is needed for selection of the optimal influenza vaccine components each year. Each year from October through May, weekly updates of summaries of U.S. influenza surveillance data are available from the following sources:
Influenza activity updates are published several times during each influenza season in the Morbidity and Mortality Weekly Report (MMWR [weekly]). This report summarizes influenza activity for the three seasons from October 1994 through May 1997. METHODSThe sources of influenza surveillance data used during the 1994--95, 1995--96, and 1996--97 seasons were similar to those used in previous years. These sources are listed below. State and Territorial Epidemiologist ReportsThe level of statewide or territory-wide influenza activity, as assessed by the state or territorial epidemiologist, was reported to CDC weekly from October through May. Levels were reported as either widespread (i.e., outbreaks of ILI* or culture-confirmed influenza in counties having a combined population of >50% of the state's population), regional (i.e., outbreaks of ILI or culture-confirmed influenza in counties having a combined population of <50% of the state's population), sporadic (i.e., sporadically occurring cases of ILI or culture-confirmed influenza, with no outbreaks detected), or no activity. Methods of assessing activity levels vary from state to state. Sentinel Physician Surveillance NetworkEach week from October through May, approximately 140 volunteer family-practice physicians reported the number of patients they saw each week, the number of these patients who were seen for ILI,† and the number of these patients who were hospitalized for ILI or related complications. ILI information was reported by age group. Baseline levels of total patient visits for ILI ranged from 0% to 3%. Levels >3% usually correlated with increased influenza activity. A subset of these physicians also submitted nasal and throat swabs to a contract laboratory for virus isolation. World Health Organization (WHO) Collaborating LaboratoriesEach week from October through May, approximately 70 WHO collaborating laboratories in the United States reported the number of specimens received for respiratory virus testing and the number of positive isolations of influenza A(H1N1), A(H3N2), A(not subtyped), or influenza B by age group (<1 years, 1--4 years, 5--24 years, 25--44 years, 45--64 years, >65 years, or unknown). Most WHO collaborating laboratories were located in state or local health departments, although some were in universities or hospitals. These laboratories submitted a subset of the isolates for complete antigenic characterization and antiviral resistance testing to the WHO Collaborating Center for Reference and Research on Influenza at CDC. Although formal weekly reporting is discontinued during summer months, WHO collaborating laboratories can report influenza viruses isolated during the summer to CDC and submit these viruses for antigenic characterization. 121 Cites Mortality Reporting SystemEach week throughout the year, the vital statistics offices in 121 cities reported the number of death certificates filed and the number of death certificates in which a) pneumonia was identified as the underlying cause of death or b) influenza was listed anywhere on the certificate. These data were used to calculate the proportion of all deaths attributed to pneumonia and influenza (P&I), as well as a P&I mortality curve. A periodic regression model that incorporated a robust regression procedure was applied to produce a seasonal baseline of P&I deaths and to calculate "excess" deaths above the baseline. An increase of 1.645 standard deviations above the seasonal baseline of P&I deaths was considered the epidemic threshold (i.e., the point at which the observed proportion of deaths attributed to pneumonia or influenza was significantly higher than would be expected at that time of year in the absence of influenza). The data reported from the sentinel physician surveillance network and from WHO collaborating laboratories are analyzed both nationally and by influenza surveillance region (Figure 1). State and territorial reports include only state-based surveillance, and data from the 121 cites mortality reporting system are only analyzed nationally. RESULTS1994--95 SeasonState and Territorial Epidemiologist ReportsState and territorial epidemiologists first reported regional influenza activity for the week ending December 3, 1994 (week 48) and widespread activity for the week ending January 7, 1995 (week 1) (Figure 2). Influenza activity increased steadily during January and February, peaked during the week ending March 11 (week 10) when 25 states reported regional or widespread activity, then declined. Widespread activity was last reported for the week ending April 15 (week 15), and regional influenza activity was last reported for the week ending May 13 (week 19). Sporadic activity continued to be reported through the week ending May 20 (week 20), the last week for which reports were available. Sentinel Physicians Surveillance NetworkVisits to sentinel physicians for ILI exceeded baseline levels (0%--3%) for 4 consecutive weeks, from January 29 through February 25, 1995 (weeks 5--8) (Figure 3). The percentage of visits for ILI peaked at 5% during the week ending February 18 (week 7). Activity varied widely by influenza surveillance region. In the New England region, the percentage of visits for ILI increased from 1% during the week ending January 7 (week 1) to 10% during the week ending January 14 (week 2), peaked at 17% during the week ending February 18 (week 7), and remained above baseline levels through the week ending April 8 (week 14). This peak level and duration of elevated activity (13 consecutive weeks) was higher than in any other region. The Mountain region had the second highest level of ILI activity, with patients visits for ILI peaking at 7% during weeks 6, 8, and 9 and remaining above baseline levels for 8 consecutive weeks, from January 8 through March 4 (weeks 2--9). In contrast, the percentage of patient visits for ILI never exceeded baseline levels in the Mid-Atlantic, West North Central, East South Central, and Pacific regions. WHO Collaborating Laboratories and Vaccine Strain SelectionFrom October 2, 1994, through May 20, 1995, WHO collaborating laboratories tested 39,657 respiratory specimens and identified 3,920 influenza isolates. Of these 3,920 isolates, 2,896 (74%) were influenza type A, and 1,024 (26%) were influenza B (Figure 4). Of the 1,940 influenza A isolates that were subtyped, 1,888 (97%) were identified as influenza A(H3N2), and 52 (3%) were influenza A(H1N1). Reported influenza isolates increased during December 1994 and January 1995, peaking from January 29 through February 11 (weeks 5 and 6). Influenza A(H1N1) viruses were first reported during the week ending January 28 (week 4) and continued to be identified through the week ending May 20 (week 20). The proportion of influenza virus types and subtypes varied by region (Figure 5). In the Mountain region, influenza B was the predominant virus and accounted for 98 (50%) of the 196 influenza viruses reported. Of the 70 influenza A viruses that were isolated in the Mountain region and subtyped, 18 (27%) were A(H1N1). Although the Mountain region contributed only 196 (5%) of the total influenza isolates reported in the United States, 18 of these were influenza A(H1N1) --- representing 35% of the national total of H1N1 viruses. Influenza B accounted for 38% of all influenza viruses isolated in the South Atlantic region and was the predominant virus isolated in that region through the week ending February 11 (week 6). In contrast, influenza B viruses accounted for 2% of isolates in the East South Central region, 7% in the West North Central region, 10% in the East North Central region, 12% in the New England region, and 15% in the West South Central region. Active influenza surveillance for the 1994--95 season ended May 20, 1995. After this date, CDC's strain surveillance laboratory received additional influenza A(H1N1), A(H3N2), and B isolates from specimens collected during late May and June. CDC also received influenza A(H1N1) viruses collected during July and September, influenza A(H3N2) viruses collected during August and September, and influenza B viruses collected during August. The 1994--95 influenza vaccine contained A/Shangdong/09/93(H3N2), A/Texas/36/91(H1N1), and B/Panama/45/90 antigens (Table). Of the 311 influenza A(H3N2) viruses antigenically characterized by CDC, 193 (62%) were similar to A/Shangdong/09/93, whereas the remaining 118 (38%) were more closely related to A/Johannesburg/33/94. A/Johannesburg/33/94-like viruses were isolated throughout the season, but the proportion of H3N2 viruses similar to A/Johannesburg/33/94 increased as the season progressed. Of the 58 influenza A(H1N1) viruses characterized, all but three were antigenically related to A/Texas/36/91 or the antigenically similar virus A/Taiwan/01/86. Forty-two (24%) of 173 influenza B viruses characterized were B/Panama/45/90-like viruses, whereas the remaining 131 (76%) were similar to the antigenic variant B/Beijing/184/93. The 1995--96 influenza vaccine was updated to include A/Johannesburg/33/94 (H3N2) and B/Beijing/184/93-like viruses while retaining A/Texas/36/91 as the H1N1 component. 121 Cites Mortality Reporting SystemFrom October 2, 1994, through May 20, 1995, the percentage of deaths attributed to P&I exceeded the epidemic threshold for 14 of the 33 weeks and peaked at 7.6% for the week ending March 4 (week 9) (Figure 6). The longest duration in which this percentage was above the epidemic threshold was 5 consecutive weeks, from February 26 through April 1 (weeks 9--13). Outbreak SurveillanceThe first influenza outbreak reported to CDC during the 1994--95 season began in late November and involved residents of a skilled nursing facility in Long Island, New York (10). Influenza A(H3N2) viruses antigenically similar to A/Shangdong/09/93 --- the influenza A(H3N2) component of the 1994--95 vaccine --- were isolated from eight nasopharyngeal specimens. As the season progressed, influenza outbreaks were reported among all age groups through May. Although most outbreaks were associated with influenza A(H3N2) viruses, influenza A(H1N1) and influenza B viruses were also associated with institutional outbreaks. 1995--96 SeasonState and Territorial Epidemiologist ReportsDuring the 1995--96 influenza season, regional activity was reported by 0--2 states each week from October 1 through November 11, 1995 (weeks 40--45) (Figure 2). The number of states reporting regional activity increased to five for the week ending November 18 (week 46), and widespread activity was first reported the week ending November 25 (week 47). Influenza activity peaked during the weeks ending January 6 (week 1) and January 13, 1996 (week 2), when 33 states reported regional or widespread activity. Widespread activity was last reported for the week ending March 16 (week 11), and regional activity was last reported for the week ending April 20 (week 16). Sentinel Physicians Surveillance NetworkThe percentage of patient visits to sentinel physicians for ILI exceeded baseline levels (0%--3%) for 5 consecutive weeks, from December 10, 1995 (week 50), through January 13, 1996 (week 2) (Figure 3). Patient visits for ILI peaked at 7% during the week ending December 30 (week 52). The highest percentage of patient visits for ILI occurred in the East South Central (15%), New England (12%), and Pacific (12%) regions. In contrast, the percentage of patient visits for ILI in the Mid-Atlantic region peaked at 4%. The number of weeks above baseline levels varied by region from 13 weeks in the New England region to 1 week in the Mid-Atlantic region. WHO Collaborating Laboratories and Vaccine Strain SelectionDuring the 1995--96 influenza season, the number of isolates reported from WHO collaborating laboratories rose sharply during November and peaked during the week ending December 23, 1995 (week 51), when 26% of respiratory specimens tested were positive for influenza (Figure 4). From October 1, 1995, through May 18, 1996, a total of 4,740 influenza isolates were reported to CDC. Of this number, 4,018 (85%) were influenza type A, and 722 (15%) were type B. Although influenza A viruses predominated overall, influenza B isolates increased at the end of the season and were isolated more frequently than influenza A during March, April, and May. Of the 2,571 influenza A isolates subtyped, 1,507 (59%) were influenza A(H1N1). The last report of influenza A(H1N1) isolates occurred during the week ending March 23 (week 12). Isolation of influenza A(H3N2) viruses continued through April and May. Active influenza surveillance for the 1995--96 season ended on May 18, but WHO collaborating laboratories continued to report influenza B isolates from specimens collected each month through July. Influenza A(H3N2) viruses were isolated from specimens collected each month from May through September. The temporal pattern of influenza virus isolations was similar throughout the country, with virus isolation peaking in all regions from week 50 through week 52. However, the proportion of different virus types/subtypes varied among regions (Figure 5). Influenza A was the predominant virus type isolated in all nine regions. However, at the subtype level, influenza A(H1N1) viruses were predominant in six regions (Mid-Atlantic, East North Central, West North Central, South Atlantic, East South Central, and West South Central), whereas influenza A(H3N2) viruses were predominant in the New England, Mountain, and Pacific regions. The highest percentages of influenza B isolates were reported in the East North Central (25%) and West North Central (23%) regions. In contrast, 3% of the isolates identified in the New England region and 5% of those in the Pacific region were influenza type B. The 1995-96 influenza vaccine contained A/Texas/36/91(H1N1), A/Johannesburg/33/94(H3N2), and B/Beijing/184/93-like antigens (Table). For the B/Beijing/184/93-like virus, U.S. vaccine manufacturers used the antigenically equivalent virus B/Harbin/07/94 because of its growth properties. Of the 219 influenza A(H3N2) viruses characterized, 155 were similar to A/Johannesburg/33/94. Sixty-three isolates were more closely related to A/Wuhan/359/95, and the proportion of A/Wuhan/359/95-like isolates increased over time. All of the 211 influenza A(H1N1) isolates antigenically characterized by CDC were similar to the reference strains A/Texas/36/91 or A/Taiwan/01/86. All influenza B viruses were similar to B/Beijing/184/93. A/Texas/36/91(H1N1) and B/Beijing/184/93-like strains were retained for the 1996--97 vaccine. The H3N2 component of the 1996--97 vaccine was updated to an A/Wuhan/359/95-like (H3N2) virus. 121 Cites Mortality Reporting SystemFor 1995--96, the percentage of deaths attributed to P&I exceeded the epidemic threshold for 6 consecutive weeks, from December 24, 1995 (week 52), through February 3, 1996 (week 5), and peaked at 8.2% during the week ending January 20, 1996 (week 3) (Figure 6). The proportion of deaths attributed to P&I returned to baseline levels during the week ending February 10 (week 6) and did not exceed the epidemic threshold again for the remainder of the season. Outbreak SurveillanceAlthough most outbreaks reported to CDC during the 1995--96 influenza season were among school-aged children, some were among adults aged >65 years residing in nursing homes. In 1996, influenza A(H3N2) viruses were associated with a) a nursing home outbreak in Washington from late May through June, b) a nursing home outbreak in Hawaii during July, c) increased influenza activity at a military base in Hawaii during July and August, and d) an outbreak among students at a Wisconsin university that began in mid-September (11,12). 1996--97State and Territorial Epidemiologist ReportsDuring the 1996--97 influenza season, regional activity was first reported for the week ending October 19, 1996 (week 42), and continued to be reported by one or two states each week through the week ending November 16 (week 46) (Figure 2). For the week ending November 23 (week 47), the number of states reporting regional activity increased to seven, and widespread influenza activity was reported for the first time. Influenza activity continued to increase during December and peaked during the week ending January 4, 1997 (week 1), when 39 states reported regional or widespread activity. Activity declined from late January through March. The last report of widespread activity was for the week ending March 22 (week 12), and regional activity was last reported for the week ending April 12 (week 15). Sentinel Physicians Surveillance NetworkThe percentage of patient visits to sentinel physicians for ILI exceeded baseline levels (0%--3%) for 5 consecutive weeks, from December 1, 1996 (week 49), through January 4, 1997 (week 1) (Figure 3). Patient visits for ILI peaked at 7% during the week ending December 28 (week 52). The highest percentage of patients visits for ILI occurred in the New England and Pacific regions, which peaked at 21% and 16%, respectively. These regions also had more weeks above baseline levels --- 13 weeks for the New England region and 14 consecutive weeks in the Pacific region. In contrast, the peak percentage of patient visits for ILI in the East South Central region (2%) was below baseline levels. WHO Collaborating Laboratories and Vaccine Strain SelectionDuring the 1996--97 influenza season, the number of isolates reported by WHO collaborating laboratories peaked during the weeks ending December 21 (week 51) and December 28, 1996 (week 52), when 33% and 34%, respectively, of specimens tested for respiratory viruses were positive for influenza (Figure 4). Of the 6,509 influenza isolates reported to CDC from September 29, 1996, through May 17, 1997, a total of 5,056 (78%) were influenza type A, and 1,452 (22%) were type B. Influenza type A viruses were reported for all weeks during the 1996--97 season, with the highest number reported during the week ending December 21 (week 51). Of the 2,274 influenza A isolates subtyped, 2,273 were influenza A(H3N2) and one was influenza A(H1N1). Influenza type B viruses were reported during 28 of 33 weeks and peaked during the week ending March 1 (week 9). Influenza B viruses were more frequently isolated than type A from the week ending February 15 (week 7) through the end of the season. The temporal pattern of influenza virus isolation was similar throughout the country, with peaks occurring in all nine regions from week 50 through week 1. In all regions, a peak of influenza B activity followed the peak of influenza A activity. Influenza A was the predominant virus type isolated, ranging from 62% in the Pacific region to 89% in the West South Central region. The 1996--97 influenza vaccine contained A/Wuhan/359/95-like (H3N2), A/Texas/36/91(H1N1), and B/Beijing/184/93-like antigens (Table). For the A/Wuhan/359/95-like strain, U.S. vaccine manufacturers used the antigenically equivalent strain A/Nanchang/933/95(H3N2) because of its growth properties. For the same reason, manufacturers used B/Harbin/07/94 for the B/Beijing/184/93-like strain. All 319 influenza A(H3N2) viruses antigenically characterized by CDC were similar to A/Wuhan/359/95. Of the 158 influenza B viruses characterized antigenically, all were similar to B/Beijing/184/93. No influenza A(H1N1) viruses from the United States were submitted during the 1996--97 season. Based on the antigenic characterization of H1N1 viruses from other countries, the H1N1 component of the 1997--98 influenza vaccine was updated to an A/Bayern/ 07/95-like (H1N1) virus. Because of its growth properties and suitability for vaccine production, U.S. manufacturers used A/Johannesburg/82/96 (H1N1). The H3N2 and B components did not change for the 1997--98 season. 121 Cites Mortality Reporting SystemDuring the 1996--97 influenza season, the percentage of deaths attributed to P&I exceeded the epidemic threshold for 13 of 33 weeks (Figure 6). This percentage exceeded the epidemic threshold for 10 consecutive weeks, from December 8, 1996 (week 50), through February 15, 1997 (week 7), and peaked at 9.1% during the week ending January 25 (week 4). Outbreak SurveillanceOutbreaks associated with influenza A(H3N2) viruses were reported during the summer of 1996 (11), until the beginning of the 1996--97 season, and throughout the fall and winter (12). During the 1996--97 influenza season, most reported outbreaks occurred among nursing home residents aged >65 years. However, all age groups were affected, with outbreaks among students also frequently reported. DISCUSSIONInfluenza type A viruses predominated during each of the three influenza seasons from October 1994 through May 1997. Influenza A(H3N2) was the prevalent subtype during the 1994--95 and 1996--97 seasons, and A(H1N1) was more prevalent during the 1995--96 season. During the 1995--96 season, the predominating influenza A subtype varied by regions. Influenza B viruses accounted for 15%--26% of all influenza viruses isolated during each of these three seasons, and the proportion of influenza B viruses increased toward the end of the 1995--96 and 1996--97 seasons. The differences in the temporal and geographic distribution of influenza viruses across the United States illustrate the importance of timely, ongoing influenza surveillance at the local, state, and regional levels. This information helps health-care providers determine the optimal treatment for patients with ILI throughout the United States. Although widespread influenza activity typically occurs in the United States during the winter months, sporadic cases and outbreaks can occur at any time of the year. Influenza viruses were isolated and reported to CDC each month from November 1994 through May 1997, and outbreaks of influenza A were reported throughout the summer of 1996. Because influenza infection can occur at any time of the year, physicians should include influenza in the differential diagnosis of febrile respiratory illness during summer months. Several rapid diagnostic tests for influenza are available and can be performed in <30 minutes in a physician's office. One test type detects only influenza type A viruses, but other tests can detect both influenza A and B viruses without differentiating between the virus types. These tests are useful for the rapid identification of influenza, but should be used along with viral culture, particularly during institutional outbreaks and for cases that occur during nonpeak months. Since their identification in 1968--69, influenza A(H3N2) viruses typically have been associated with increases in P&I mortality, particularly among older adults. Influenza A(H3N2) viruses predominated during eight of the 11 influenza seasons during 1972--1995 in which there were >20,000 excess deaths attributed to P&I. The 1994--95 influenza season was unusual in that influenza A(H3N2) viruses predominated, but P&I mortality as detected by the 121 cites mortality reporting system was low. The percentage of P&I deaths exceeded the epidemic threshold by a small margin for 5 consecutive weeks and peaked at 7.6%. Influenza morbidity rates reported by sentinel physicians also were low, with the percentage of patient visits for ILI peaking at 5% nationally and never exceeding baseline levels in four of the nine regions. During the 1996--97 season, influenza-related mortality followed a pattern more typical of years predominated by H3N2 viruses, with the proportion of deaths attributed to P&I exceeding the epidemic threshold for 10 consecutive weeks, peaking at 9.1%. Before the 1995--96 influenza season, influenza type A(H1N1) viruses had not circulated widely in the United States since the 1988--89 season, when they represented almost 50% of influenza virus isolates reported by WHO collaborating laboratories in the United States (13). The occurrence of a high proportion of reported outbreaks among school-aged children during the 1995--96 season is consistent with patterns seen during previous influenza seasons when type A(H1N1) viruses have predominated (14). Influenza A(H1N1) viruses circulated from 1918 through 1957, then disappeared for 20 years. The influenza A(H1N1) virus that reappeared in 1977 was antigenically and genetically similar to strains isolated in 1950 and 1951. Since their reappearance in 1977, influenza A(H1N1) viruses have had less impact on persons born during or before the mid-1950s than on those born after that time, probably because of immunity developed during the 1940s and 1950s (14). After the 1996--97 influenza season, surveillance methods were changed. Sentinel physician surveillance for influenza is now conducted in collaboration with state health departments. As a result, the number of participating and regularly reporting physicians has increased to approximately 400. Virologic information is now received from laboratories participating in the National Respiratory and Enteric Virus Surveillance System, as well as from WHO collaborating laboratories, increasing the number of laboratories reporting each week to approximately 120. During each influenza season, activity updates of preliminary data are published several times in the MMWR [weekly]. Data summaries for entire seasons are published periodically in CDC Surveillance Summaries. References
*For this surveillance system, the case definition for ILI is left to the discretion of state and territorial health departments. †For this surveillance system, the case definition for ILI is fever >100 F (36 C) and cough or sore throat, in the absence of other confirmed diagnosis. Table 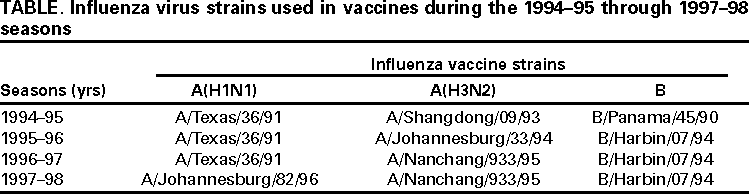 Return to top. Figure 1 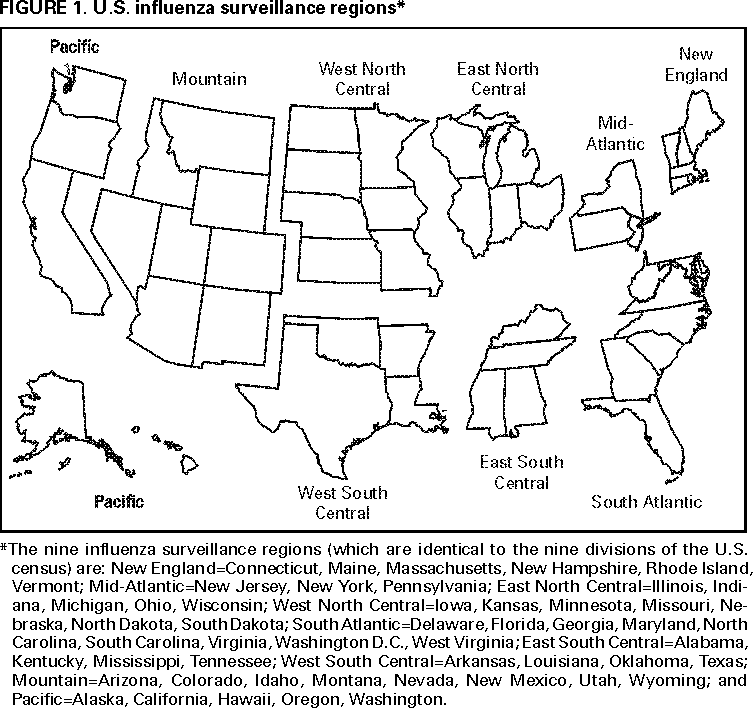 Return to top. Figure 2 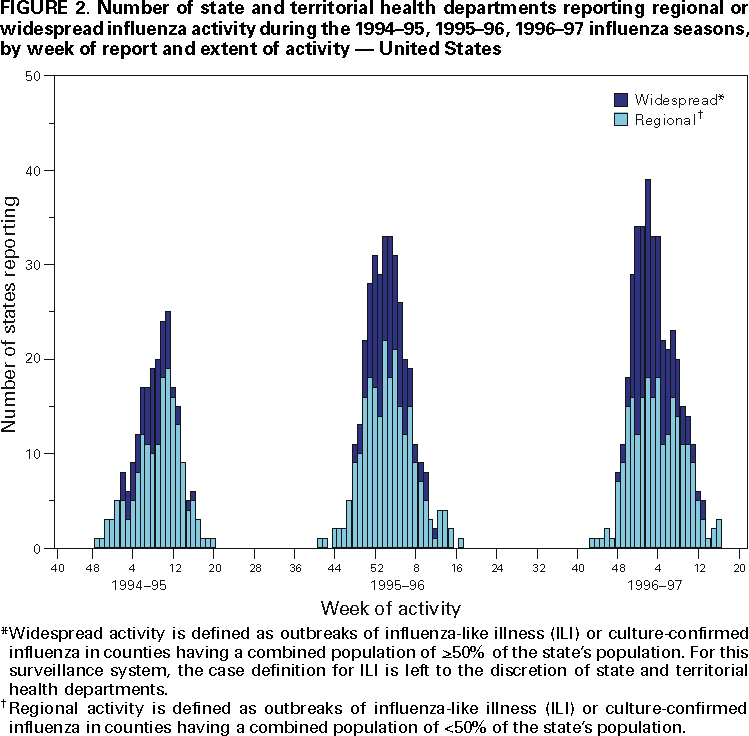 Return to top. Figure 3 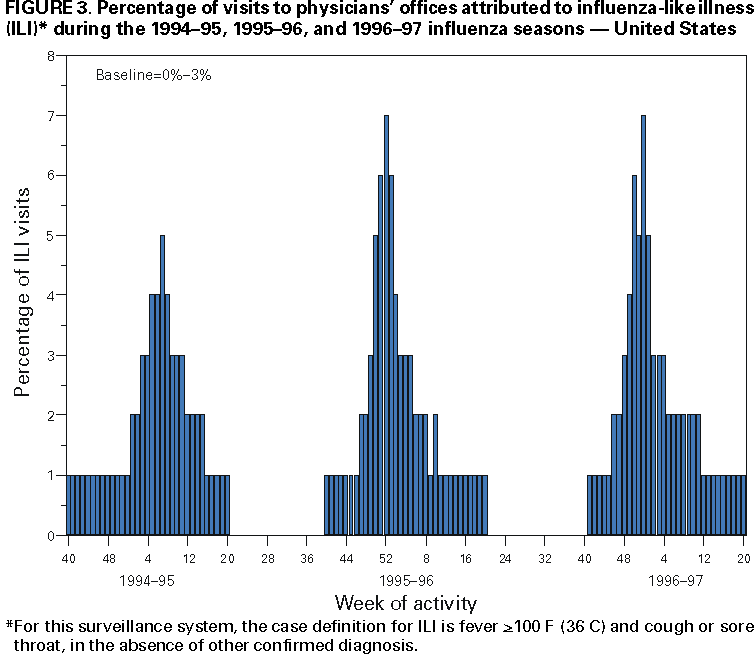 Return to top. Figure 4 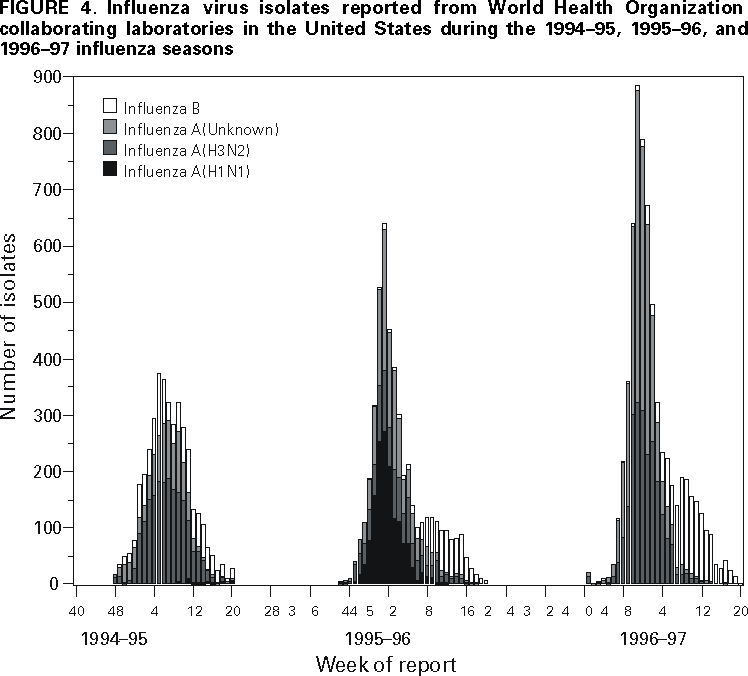 Return to top. Figure 5 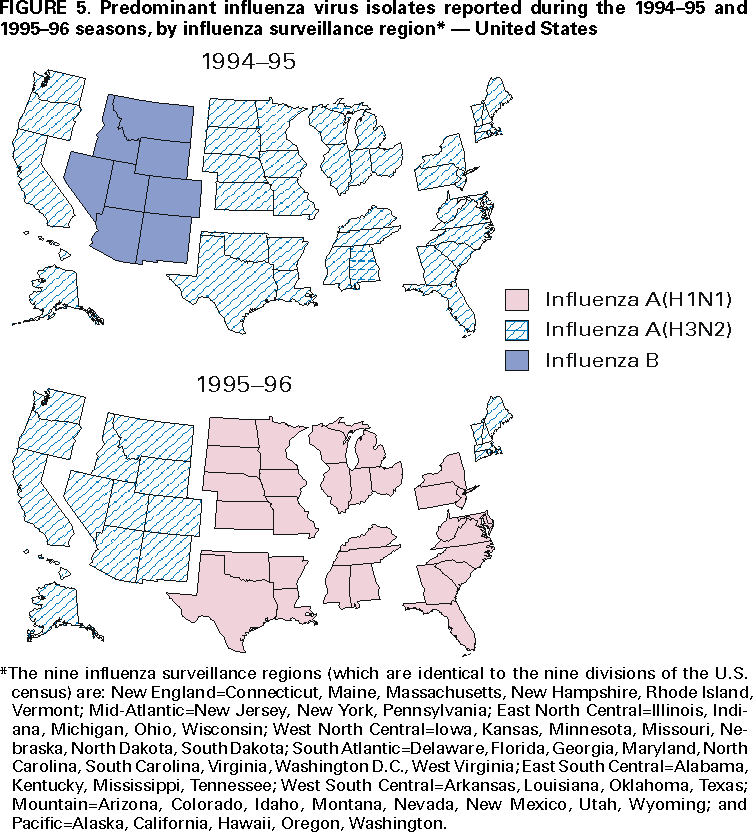 Return to top. Figure 6  Return to top. Disclaimer All MMWR HTML versions of articles are electronic conversions from ASCII text into HTML. This conversion may have resulted in character translation or format errors in the HTML version. Users should not rely on this HTML document, but are referred to the electronic PDF version and/or the original MMWR paper copy for the official text, figures, and tables. An original paper copy of this issue can be obtained from the Superintendent of Documents, U.S. Government Printing Office (GPO), Washington, DC 20402-9371; telephone: (202) 512-1800. Contact GPO for current prices. **Questions or messages regarding errors in formatting should be addressed to mmwrq@cdc.gov.Page converted: 4/25/2000 |
|||||||||
This page last reviewed 5/2/01
|