 |
|
|
|
|
|
|
| ||||||||||
|
|
|
|
|
|
|
||||
| ||||||||||
|
|
|
|
|
Persons using assistive technology might not be able to fully access information in this file. For assistance, please send e-mail to: mmwrq@cdc.gov. Type 508 Accommodation and the title of the report in the subject line of e-mail. Public Health Surveillance for Behavioral Risk Factors in a Changing Environment Recommendations from the Behavioral Risk Factor Surveillance TeamPrepared by The material in this report originated in the National Center for Chronic Disease Prevention and Health Promotion, James S. Marks, M.D., M.P.H, Director, and the Division of Adult and Community Health, Virginia S. Bales, Director. Summary The Behavioral Risk Factor Surveillance System (BRFSS) is a state-based system of health surveys. Information regarding health risk behaviors, clinical preventive health practices, and health-care access, primarily related to chronic disease and injury, is obtained from a representative sample of adults in each state. Approximately 200,000 adult interviews are completed each year in all 50 states, the District of Columbia, Puerto Rico, the Virgin Islands, and Guam. The challenge for BRFSS is how to effectively manage an increasingly complex surveillance system that serves the needs of numerous programs while facing changing telecommunication technology and the greater demand for more local-level data. To determine options and recommendations for how best to meet BRFSS future challenges, CDC's Behavioral Surveillance Branch conducted a 2-day strategy workshop, attended by survey-research specialists. The workshop featured presentations on the current system; emerging technologic challenges; telephone-surveying techniques; program perspectives of CDC, partner organizations, and states; and recommendations for change. This report summarizes the recommendations resulting from that workshop. IntroductionBackgroundThe Behavioral Risk Factor Surveillance System (BRFSS) is a state-based system of health surveys that was established in 1984 by CDC and state health departments. Information regarding health risk behaviors, clinical preventive health practices, and health-care access, primarily related to chronic disease and injury, is obtained from a representative sample of adults in each state. For the majority of states, BRFSS is the only source for this type of information. Data are collected monthly in all 50 states, the District of Columbia, Puerto Rico, the Virgin Islands, and Guam. Approximately 200,000 adult interviews are completed each year, making BRFSS the largest health survey conducted by telephone in the world. Not only is BRFSS a unique source of risk behavior data for states, but the system is also useful in measuring progress toward Healthy People 2010 (1) objectives for the states and the nation. Multiple leading health indicators for 2010 can be assessed through BRFSS (e.g., cancer screening, diagnosed diabetes, influenza or pneumococcal vaccination, obesity, smoking, and binge drinking). In 1984, BRFSS began with 15 states collecting data concerning the six individual-level risk factors associated with the leading causes of premature mortality among adults,
From its inception, BRFSS was designed to allow states to add questions of their own choosing to their surveys. Beginning in 1988, optional, standardized sets of questions regarding specific topics (optional modules) were made available to states. The survey was redesigned in 1993 to include certain questions every year (i.e., a fixed core) and others in alternate years (i.e., a rotating core). As part of the 1993 redesign, <5 emerging core questions for newly arising topics were included for all states (Table). By collecting behavioral data at the state level, BRFSS has proven to be a powerful tool for building health-promotion activities (2). Demand for data has increased, as has the number of requests to add questions to the survey (Table). The majority of divisions within the National Center for Chronic Disease Prevention and Health Promotion (NCCDPHP) and other CDC centers, institute, and offices (CIOs) have questions on BRFSS. Other federal agencies (e.g., the Health Resources and Services Administration [HRSA], National Institute of Health [NIH], the Administration on Aging [AoA], and the Veterans Administration [VA]), have added questions to the survey. In addition, CDC has provided technical assistance to countries developing similar surveillance systems (e.g., China, Australia, Canada, and Russia). The World Health Organization (WHO) is developing a model surveillance system based on BRFSS for export to other countries. With the growth in scope and influence of the system, certain successes have been realized by the BRFSS program. All states use BRFSS data to establish and track state health objectives, plan and evaluate health programs, or implement multiple disease-prevention activities. Approximately two thirds of states use BRFSS data to support health-related legislative efforts. For example, in Delaware, data were used to support legislation to create the Healthy Lifestyle and Tobacco-Related Disease Prevention Fund (2). In Illinois, two successful legislative initiatives to ban smoking in public buildings and to include coverage for mammography screening in all health insurance coverage were supported by BRFSS data (2). In Nevada, BRFSS data documenting the state's high rates of chronic and binge drinking were used to support legislation to place a per-gallon tax at the wholesale level on distilled alcohol. Only because the data were state-specific could these efforts succeed (2). Since 1984, demand for more behavioral risk factor data has increased at the district, county, or city level. Although BRFSS was designed to produce state-level estimates, growth in the sample size has facilitated production of representative smaller area estimates. In 1997, the need for prevalence estimates at the local level led to the Selected Cities Project. Data from BRFSS were used to calculate estimates for selected cities in the United States with >300 respondents. In 2000, this use of BRFSS data yielded estimates of health risk behaviors for 99 cities to support targeted program implementation and evaluation, which should help cities better plan and direct their prevention and health promotion efforts. BRFSS OperationBRFSS field operations are managed by health departments with assistance from CDC. These health departments participate in developing the survey instrument and conducting the interviews either in-house or by using contract labor. Data are transmitted to NCCDPHP's Behavioral Surveillance Branch for editing, processing, weighting, and analysis. An edited and weighted data file is provided to each participating health department for each year of data collection, and summary reports of state-specific data are prepared by CDC staff. The health characteristics estimated from BRFSS pertain only to the adult population aged >18 years, living in households. Respondents are identified by using telephone-based methods. Although approximately 95% of U.S. households have telephones, coverage ranges from 87% to 98% across states and varies for subgroups as well (3). For example, persons living in the South, minorities, and those in lower socioeconomic groups typically have lower telephone coverage (3). No direct method of compensating for nontelephone coverage is employed by BRFSS; however, poststratification weights are used and might correct for any bias caused by nontelephone coverage. These weights adjust for differences in probability of selection and nonresponse, as well as noncoverage, and must be used for deriving representative population-based estimates of risk-behavior prevalence. BRFSS LimitationsAs a telephone survey, BRFSS has certain limitations. First, the survey is based on noninstitutionalized populations and excludes persons residing elsewhere (e.g., nursing homes or long-term--care facilities). Second, the data are based on self-reports, which can be subject to recall bias. Third, persons without a residential telephone are not included; therefore, BRFSS might exclude certain persons of lower socioeconomic status or households with cellular phones only. In contrast, the data are based on the largest telephone survey in the world. BRFSS is an ongoing state-based survey that provides program planners with a unique opportunity to compare changes in risk behaviors at the local, state, and national levels. Furthermore, the substantial sample size allows for stratification to further examine the risk by selected variables of interest. Designing BRFSSEach year, the states agree on the content of the core component and optional modules. For comparability, certain questions are taken from established national surveys (e.g., the National Health Interview Survey or the National Health and Nutrition Examination Survey). This practice allows BRFSS to use questions that might have been tested and allows states to compare their data with those from other surveys. Any new questions proposed as additions to BRFSS must be cognitive- and field-tested before their inclusion on the survey. BRFSS protocol specifies that all states ask the core component questions without modification. They may choose to add any, all, or none of the optional modules, and they may add questions of their choosing at the end of the questionnaire. States are selective in their choices of modules and state-specific questions to keep the questionnaire at a reasonable length, although wide variation exists from state to state in the total number of questions for a given year, ranging from a low of approximately 90 to >150. New questionnaires are implemented in January and usually remain unchanged throughout the year. However, the flexibility of state-added questions does permit additions, changes, and deletions at any time during the year. Annual Questionnaire DevelopmentBefore the beginning of the calendar year, states decide on the text of the core component and the optional modules that will be asked for the coming year. States select their optional modules and choose any state-added questions. Then, each state constructs its questionnaire. The core component is asked first; optional modules are asked next; and state-added questions last. This ordering ensures comparability from state to state and follows standard protocol. Typically, the only changes allowed are the limited insertion of state-added questions regarding topics related to core questions. Such exceptions must be agreed upon in consultation with all partners. After the content (i.e., core, modules, and state-added questions) of the questionnaire is determined by a state, a paper version of the instrument is constructed, and a paper or electronic copy is sent to CDC. The questionnaire is used without changes for one calendar year. If a substantial portion of the state population does not speak English, states have the option of translating the questionnaire into other languages (e.g., Chinese in California). CDC only provides a Spanish translation of the core questionnaire and optional modules. Sample DescriptionTo meet BRFSS standard for the participating states' sample, designs must be justifiable as a probability sample of all households with telephones in the state. All states and the District of Columbia use a disproportionate stratified sample (DSS) design. In the BRFSS DSS design, a common practice is to divide telephone numbers into two groups, or strata, which are sampled separately. One group, the high-density stratum, contains telephone numbers that are expected to contain a substantial proportion of households. The low-density stratum contains telephone numbers that are expected to contain a limited proportion of households. Whether a telephone number goes into the high-density or low-density stratum is determined by the number of listed household numbers in its hundred block. A hundred block is a set of 100 telephone numbers with the same area code, prefix, and first two digits of the suffix and all possible combinations of the last two digits. Numbers that come from hundred blocks with >1 listed household number (i.e., 1 + blocks or banks) are put in the high-density stratum. Numbers that come from hundred blocks with no listed household numbers (i.e., zero blocks or banks) are put in the low-density stratum. Both strata are sampled to obtain a probability sample of all households with telephones. The high-density stratum is sampled at a higher rate than the low-density stratum (i.e., disproportionately) to obtain a sample that contains a larger proportion of household numbers than would be the case if all numbers were sampled at the same rate. In the majority of cases, each state constitutes a single stratum. However, to provide adequate sample sizes for smaller geographically defined populations of interest, 25 states are sampled disproportionately from strata defined to correspond to substate regions. Data for a state can be collected directly by the state health department or through a contractor. In 2001, a total of 14 state health departments collected their data in-house, and 40 contracted data collection with university survey research centers or commercial firms. The Behavioral Surveillance Branch provided a sample of telephone numbers to 53 states or territories purchased from Genesys (Marketing Group Systems, Fort Washington, Pennsylvania; available at http://www.m-s-g.com). Nevada purchased their sample from Survey Sampling International, Inc. (Fairfield, Connecticut; available at http://www.surveysampling.com). Data CollectionInterview ProceduresInterviews are conducted by using computer-assisted telephone interview systems (CATI), and CDC supports CATI programming by using the Ci3 CATI software package (Sawtooth Technologies, Inc., Northbrook, Illinois; available at http://www.sawtooth.com). This support includes programming of the core and module questions, providing questionnaire scripting of state-added questions through a contract with a commercial firm for states requiring assistance, and contracting with a Ci3 consultant to assist states. By following specifications provided by CDC, state health personnel or contractors conduct interviews. The core portion of the questionnaire takes an average of 10 minutes to conduct. Interview time for modules and state-added questions is dependent upon the number of questions used, but typically extend the interview period by an additional 5--10 minutes. Interviewer retention is high among states that conduct the survey in-house. The state coordinator or interviewer supervisor usually conducts the training by using materials developed by CDC that cover seven basic areas, as follows:
Contractors typically use interviewers who have experience conducting telephone surveys, but these interviewers are given additional training on the BRFSS questionnaire and procedures before they are certified to work on BRFSS. More specific information regarding interviewer training and procedures is available at the BRFSS website (http://www.cdc.gov/brfss). In 2001, all surveillance projects had the capacity to monitor their interviewers, as is expected of telephone-interviewing surveys. The system used for monitoring interviewers varied from listening to the interviewer only at an on-site location to listening to both the interviewer and respondent at a remote location. Verification callbacks were also used by certain states in lieu of direct monitoring. Contractors typically conducted systematic monitoring by monitoring each interviewer for a certain amount of time each month. All states had the capability to tabulate disposition code frequencies by interviewer. These data were the primary means for quantifying interviewer performance. All states were required to do verification callbacks for a sample of completed interviews as part of their quality-control practices. Telephone interviewing was conducted during each calendar month, and calls were made 7 days/week, during both day and evening hours. Standard procedures in the interview were followed for rotation of calls during days of the week and times of the day. A summary of rules for respondent selection, callbacks per sample piece, refusal conversion, answering machines, and monthly interviewing periods are available at the BRFSS website (http://www.cdc.gov/brfss). Data ProcessingPreparing for Data Collection and Data ProcessingData processing is an integral part of any survey. Because data are collected and sent to CDC during each month of the year, routine data-processing tasks need attention at all times throughout the year. In addition, certain tasks need to be conducted at different points in the annual BRFSS cycle. The preparation for the survey involves multiple steps that occur after the new questionnaire is finalized. This process includes developing the edit specifications, programming portions of the Ci3 CATI software, programming the PC-EDITS software, and producing telephone sample estimates for states that require them and then ordering the sample estimates from the contract vendor. A Ci3-CATI data-entry module for each state that uses this software is produced. Skip-patterns, together with certain consistency edits, and response-code range checks are incorporated into the CATI system. Incorporating edits and skip-patterns into the CATI instrument reduces interviewer errors, data-entry errors, and skip errors. Data-conversion tables are developed to read the survey data from the entry module and call information from the sample-tracking module and to combine information into the final format specified for the data year. CDC also creates and distributes a Windows®-based editing program that can perform data validations on correctly formatted survey results files. This program is used to output lists of errors or warning conditions encountered in the data. CDC begins to process data for the survey year as soon as states or their contractors begin submitting data to the data-management mailbox, and continues processing data throughout the survey year. CDC receives and tracks monthly data submissions from the states. After data are received from the state, editing programs and cumulative data-quality checks are run against the data. Any problems in the file are noted, and a CDC programmer works with the state until the problems are resolved or agreement is reached that no resolution is possible. Response-rate data-quality reports are produced and shared with the project officers and state coordinators, who review the reports and discuss any potential problems with the state.* After the entire year of data for a state has been received and validated, multiple year-end programs are run for additional, limited data cleanup specific to the state and data year, and reports are produced that identify potential analytic problems with the data set. When these programs are complete, the data are ready for assigning weights and adding new variables. Not all of the variables that appear on the public-use data set are taken directly from the state files. CDC prepares a set of SAS programs (4) that implement the end-of-year data processing. These programs prepare the data for analysis and add weighting and risk-factor calculations as variables to the data file. To create these variables, multiple variables from the data file are combined. Creation of the variables vary in complexity; certain ones only combine codes, whereas others require sorting and combining selected codes from multiple variables. Approximately all the variables derived from the BRFSS interview have a code category labeled "refused" and assigned a value of A9, A99, or A999. Typically, the category consists of noninterviews and persons for whom the question was not applicable because of a previous response or a personal characteristic (e.g., age). However, this code might capture certain responses that were supposed to be answered, but for a certain reason were not, and appeared as a blank or other symbol. The combination of these types of responses into a single code requires vigilance on the part of data-file users who wish to separate respondents who were skipped on one question from those who were asked, but whose answer was unknown or who refused to answer a particular question. Weighting the DataWhen data are used without weights, each record counts the same as any other record. Implicit in such use are the assumptions that each record has an equal selection probability and that noncoverage and nonresponse are equal among all segments of the population. When deviations from these assumptions are substantial enough to affect the results obtained from a data set, then weighting each record appropriately can help adjust for assumption violations. An additional, but conceptually unrelated, reason for weighting is to make the total number of cases equal to a certain desired number; for state BRFSS data, this is the state's population aged >18 years. In BRFSS, poststratification serves as a blanket adjustment for noncoverage and nonresponse and forces the total number of cases to equal population estimates for each geographic stratum, which for BRFSS is usually a state. Data QualityAnnually, CDC produces a BRFSS data-quality--control report, which enables the state BRFSS coordinator to monitor and improve data quality. The report is intended also to assist with the following questions:
In certain cases, the standard is defined by BRFSS protocol. For example, 100% of records dispositioned as "no answer" should have received >15 call attempts. In other cases, the standard might be defined by the variability in state-by-state data, with outliers indicating states that should receive special attention. An outside standard is used in bias measures (e.g., census data). Bias is measured by the difference between a sample value and a population value. For example, a sample with 60% female respondents drawn from a population that is 52% female indicates a selection bias of 8%. Finally, consistency is a key concern. A measure might be consistent at an acceptable level, but inconsistency might be an indicator of lower quality data-collection practices. BRFSS data quality (i.e., comparing BRFSS data with census data and the frequency of disposition codes) has always been optimal. When compared with other national surveys, BRFSS data have been reported to be valid and reliable (5). In 2000, the data quality reports for all 50 states, the District of Columbia, and the territories, demonstrate minimum bias when BRFSS data is compared with census data. In 2001, bias in BRFSS data was not associated with response rate. Moreover, when bias is compared between 1995, when the median CASRO (i.e., definition of response rates issued by the Council of American Survey Research Organizations) response rate was 68.4, and 2000, when the median CASRO response rate is 48.9, the bias in 2000 is lower because it indicates a random variation that is not associated with response rate (Figure). Perhaps this is a result of the strict standards applied by BRFSS in computing response rates. The challenge for BRFSS is effectively managing an increasingly complex surveillance system that serves the needs of multiple programs while telecommunication technology is ever-changing. In addition, demand for more local-level data is increasing. Strategic Vision ProcessTo find ways to meet the challenges for BRFSS in the future, CDC's Behavioral Surveillance Branch staff conducted a 2-day strategy meeting with survey-research specialists; their goal was to develop options and recommendations for behavioral surveillance to meet future challenges. During the workshop, presentations were made by survey methodology specialists and persons knowledgeable in emerging technologic challenges. Their presentations included such topics as the current data-collection system and telephone surveying, and CDC, partner, and state program perspectives. After the presentations, the larger working group divided into three subgroups to develop options for meeting future challenges. The three subgroups addressed technology, methodology, and system challenges. The initial options from the subgroups were offered to a review panel for their reactions and then to the larger group of workshop attendees. After discussion with the review panel and the larger group, the subgroups reconvened to draft final recommendations with advantages and disadvantages. The final recommendations were presented and discussed with the larger group and a review panel and are described in the following sections. Technology ChallengesRapid changes in telecommunication technology have led to problems for all telephone-surveying systems. With the recent increase in the number of area codes and central office codes, the population of telephone numbers has grown substantially. Therefore, the proportion of telephone numbers that are working residential telephone numbers has decreased, resulting in an increase in the number of dial attempts required to complete one survey. Moreover, with the growing use of the Internet, households are spending more time online, which leads to more busy signals. Use of answering machines and caller-identification technology means that households are screening more calls and refusing to answer. Owned numbers that go with a person when he or she moves can also make state and local area surveys more challenging. Devices and services that screen and block calls to households (i.e., a device that sends a signal indicating that the number is not in service), automatic call-blocking (i.e., a household selects which numbers it chooses to receive calls from), the phone butler (i.e., a relatively new service for screening calls), state do-not-call lists (i.e., a list of telephone numbers that do not accept telemarketing calls), and mobile-only households (MOHs), which use cellular phones exclusively, have also contributed to the decline in telephone-survey response rates and their representativeness of the general population. A random-digit--dialing (RDD) approach is viable, except for owned numbers, but certain problems need to be addressed to sustain BRFSS at a high-quality level. These concerns include the declining response rates, coverage, and problems with standardization across states. BRFSS has unique characteristics (e.g., decentralized data collection); therefore, ongoing research regarding methodology and technology concerns is needed for continuous improvement in the survey system and to assess the effects of changes in telecommunication technology on the survey. The technology and methodology challenges subgroup provided short, intermediate, and long time-frame estimates for their initial recommendations. They also added priorities to the items as well as justifications for their recommendations. Technology Challenges Recommendations Response Rate.
Coverage Rate.
Standardization.
Methodology ChallengesThe methodology subgroup stressed the importance and successes of BRFSS, despite the resource limitations. Needed changes should be addressed while maintaining the BRFSS state focus and sound science. Their recommendations were grouped into five categories: 1) strengthening core operations at CDC to better assist the states, 2) strengthening core operations at the state directly, 3) employing continuous survey operations, 4) implementing continuous quality improvement, and 5) applying certain immediate fixes that could be achieved while longer term efforts are introduced. Methodology Challenges Recommendations Strengthening CDC Core Operations. Core capacity at CDC for statistical analysis, content development, and technical assistance should be increased.
Strengthening State Core Operations. States need increased capacity to respond to changes introduced by CDC or requested by states.
Employing Continuous Survey Operations. Continuous survey operations are best practices proven to work elsewhere.
Implementing Continuous Improvement Efforts. BRFSS operations need to enhance its quality-improvement practices (e.g., by making data adjustments monthly) and to make those improved practices continuous.
Applying Immediate Fixes Selectively. Certain items can be implemented immediately to ease resources for other activities.
System ChallengesIn the past, funding restrictions for BRFSS have required the BRFSS program to charge other CDC organizations and external programs for adding questions to the survey. This strategy enabled the system to continue but resulted in a questionnaire content determined by the ability to pay, with public health and state priorities sometimes being a secondary consideration. In addition, this system hampered long-term questionnaire development and planning. However, in the fiscal year 2003 budget, the U.S. Congress appropriated an increase for BRFSS that will allow CDC to begin implementing the changes recommended in this report. The system challenges subgroup affirmed the importance of partnerships between CDC and the states. BRFSS provides state- and substate-level data and builds state capacity. States seek standardization from CDC for BRFSS. Program input from CDC is also critical to states and to the state-level programs that use BRFSS data (e.g., state diabetes programs). System Challenges Recommendations
ConclusionBRFSS is a powerful tool for building health-promotion activities, and the system is a critical part of public health in the United States. Implementing the recommendations made by the three subgroups will ensure that BRFSS continues providing valuable information for action at the local, state, and national levels. In the fiscal year 2003 budget, the U.S. Congress appropriated an increase for BRFSS that will allow CDC to begin implementing the changes recommended in this report. References
* Data-quality checks include a comparison with census data and the disposition-codes assignment. † Those households where neither English nor Spanish are spoken are counted against the rate in the response rate formula; however, after other languages are added, the response rate will increase. § During the survey, respondents are asked if they have had an interruption in their telephone service. Those persons who have had an interruption that was not caused by inclement weather are regarded in the same manner as those who do not have a telephone. Adjustments in the data are made to account for households not having telephones by using the data from persons who have had an interruption in telephone service. Behavioral Risk Factor Surveillance System
Participants, Prevention Strategy Meeting on the Behavioral Risk Factor Surveillance System, May 22--23, 2002: Martin Frankel, Ph.D., Baruch College, Cos Cob, Connecticut; Fritz Scheuren, Ph.D., University of Chicago, Chicago, Illinois; Michael W. Link, Ph.D., Research Triangle Institute International, Research Triangle Park, North Carolina ; Eve Powell-Griner, Ph.D., National Center for Health Statistics, CDC; and Charles Hunt , M.P.H., Kansas Department of Health and Environment, Topeka, Kansas. Technologic Challenges Subgroup: James Lepkowski, Ph.D., University of Michigan, Ann Arbor, Michigan; William S. Garvin, National Center for Chronic Disease Prevention and Health Promotion, CDC; Vickie Clewis, Southern Research Group, Jackson, Mississippi; Michael Battaglia, M.A., Abt Associates, Inc., Cambridge, Massachusetts; Harry McGee, M.P.H., Michigan Department of Community Health, Lansing, Michigan; Stephen J. Blumberg, Ph.D., National Center for Health Statistics, CDC; and Michael W. Link, Ph.D., Research Triangle Institute International, Research Triangle Park, North Carolina. Methodologic Challenges Subgroup: Peter Mariolis, Ph.D., National Center for Chronic Disease Prevention and Health Promotion, CDC; William D. Kalsbeek, Ph.D., University of North Carolina, Chapel Hill, North Carolina; Colm O' Muircheartaigh, Ph.D., National Opinion Research Center, Chicago, Illinois; Linda Martin, M.S., Georgia Division of Public Health, Atlanta, Georgia; Martin Frankel, Ph.D., Baruch College, New York, New York; Fritz Scheuren, University of Chicago, Chicago, Illinois; and Charlie Palit, Ph.D., University of Wisconsin, Madison, Wisconsin. System Challenges Subgroup: Joanne Grunbaum, Ed.D., National Center for Chronic Disease Prevention and Health Promotion, CDC; David E. Nelson, M.D., National Institutes of Health, Bethesda, Maryland; Charles Hunt, M.P.H., Kansas Department of Health and Environment, Topeka, Kansas; Michael Schooley, M.P.H., and Gloria Colclough, National Center for Chronic Disease Prevention and Health Promotion, CDC; and Eve Powell-Griner, Ph.D., National Center for Health Statistics, CDC. Review Panel: Marshall Krueter, Ph.D., (Facilitator), Atlanta, Georgia; Donna Stroup, Ph.D., Wayne Giles, M.D., and Ali Mokdad, Ph.D., National Center for Chronic Disease Prevention and Health Promotion, CDC. CDC Behavioral Risk Factor Surveillance System Team: Indu Ahluwalia, Ph.D.; Lina Balluz, Sc.D.; William P. Bartoli; David W. Brown, M.S.P.H., M.Sc.; Julie Brown; Gloria J. Colclough; Clark H. Denny, Ph.D.; Kathy A. Douglas, Ph.D.; Evelyn Dunn; Earl Ford, M.D.; William S. Garvin, III; David Gilbertz, M.S.; Jane Grimsley; Ronald N. Goodson, M.S.W.; Ruth Jiles, Ph.D.; Kenneth J. Laliberte, M.P.A.; Karin A. Mack, Ph.D.; Kathleen Y. McDuffie, Ph.D.; Peter Mariolis, Ph.D.; Ali Mokdad, Ph.D.; Wilmon Murphy; Catherine Okoro, M.S.; Luann Rhodes, M.P.H.; James Ribble; Yolanda Rowe; Bill Scott; Ajay Sharma; Carol A. Stanwyck, Ph.D.; Horace V. Thompson; and Machell Town, M.Sc., Division of Adult and Community Health, National Center for Chronic Disease Prevention and Health Promotion. Table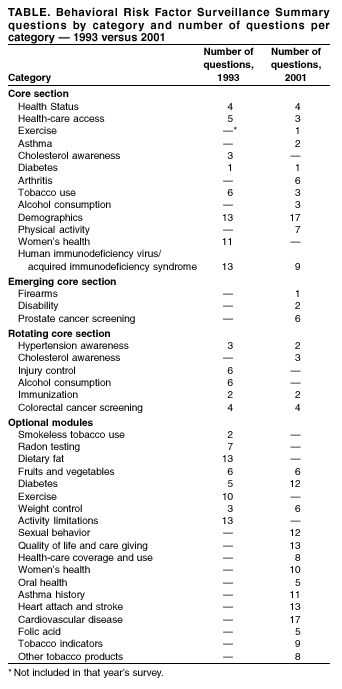 Return to top. Figure 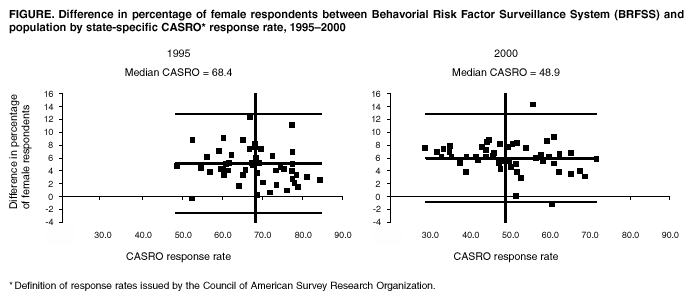 Return to top.
Disclaimer All MMWR HTML versions of articles are electronic conversions from ASCII text into HTML. This conversion may have resulted in character translation or format errors in the HTML version. Users should not rely on this HTML document, but are referred to the electronic PDF version and/or the original MMWR paper copy for the official text, figures, and tables. An original paper copy of this issue can be obtained from the Superintendent of Documents, U.S. Government Printing Office (GPO), Washington, DC 20402-9371; telephone: (202) 512-1800. Contact GPO for current prices. **Questions or messages regarding errors in formatting should be addressed to mmwrq@cdc.gov.Page converted: 5/7/2003 |
|||||||||
This page last reviewed 5/7/2003
|