 |
|
|
|
|
|
|
| ||||||||||
|
|
|
|
|
|
|
||||
| ||||||||||
|
|
|
|
|
Persons using assistive technology might not be able to fully access information in this file. For assistance, please send e-mail to: mmwrq@cdc.gov. Type 508 Accommodation and the title of the report in the subject line of e-mail. Racial Disparities in Tuberculosis --- Selected Southeastern States, 1991--2002Despite substantial declines in tuberculosis (TB) in the United States, in 2002, non-Hispanic blacks continued to have TB at rates eight times greater than non-Hispanic whites (1). To better understand racial disparities in TB, CDC analyzed surveillance data collected during 1991--2002, comparing TB cases in seven southeastern states* where TB rates were higher than the national average with TB cases in the rest of the United States. This report summarizes the results of that analysis, which indicated that TB rates among non-Hispanic blacks in the seven southeastern states continued to exceed those among non-Hispanic whites but were similar to rates among non-Hispanic blacks in the rest of the country. In addition, non-Hispanic blacks with TB in the southeastern states were more likely than non-Hispanic whites to report certain risk factors, suggesting that differences in socioeconomic status might create barriers to diagnosis and treatment. The continued disparity in TB cases underscores the need for effective, targeted strategies to prevent TB in non-Hispanic blacks. CDC conducts public health surveillance for TB nationwide in collaboration with health departments in all 50 states, the District of Columbia, and New York City†. Data were examined for seven southeastern states where annual TB rates were above the national average for >8 years during 1991--2002§. Only persons describing themselves as non-Hispanic black or non-Hispanic white were included. Definitions for additional data collected by the national TB surveillance system have been published previously (1,2). During 1991--2002, the seven states reported a total of 32,414 TB cases, including 18,038 (56%) among non-Hispanic blacks and 11,506 (35%) among non-Hispanic whites. In 2002, the TB rate for non-Hispanic blacks in the region was 11.3 per 100,000 population, 4.7 times greater than the rate (2.4) for non-Hispanic whites. During 1991--2002, TB rates declined 54% for non-Hispanic blacks and 64% for non-Hispanic whites (Figure). During 1991--1996, the average yearly decline in TB rates for non-Hispanic blacks was 3.2% in the southeastern states, compared with 5.3% for non-Hispanic whites. During 1997--2002, the average yearly decline was 9.5% for non-Hispanic blacks and 11.4% for non-Hispanic whites. The ratio of TB rates in non-Hispanic blacks to rates in non-Hispanic whites increased slightly, from an annual average of 4.0 during 1991--1996 to 4.6 during 1997--2002. In 2002, non-Hispanic black TB patients in the seven states were more likely than non-Hispanic white patients to have TB risk factors that often are associated with lower socioeconomic status (Table). Non-Hispanic blacks were more likely than non-Hispanic whites to report excess alcohol use (24% versus 17%, respectively) and drug use (13% versus 6%, respectively) during the 12 months before receiving a diagnosis of TB. Non-Hispanic blacks also were more likely than non-Hispanic whites to be inmates at a correctional facility at the time of TB diagnosis (5% versus 2%, respectively) and more likely to be coinfected with human immunodeficiency virus (HIV) (13% versus 4%, respectively). The percentage of TB patients who were children aged <5 years was greater among non-Hispanic blacks (5%) than among non-Hispanic whites (1%). The percentage of non-Hispanic blacks in the seven states who had all or part of their TB therapy observed directly by a health-care worker (94%) was greater than the percentage for non-Hispanic whites (85%). During 1991--2002, TB among foreign-born persons in the seven southeastern states increased from 0.2% to 7% for non-Hispanic blacks and from 0.1% to 3% for non-Hispanic whites. In 2002, in the rest of the United States, foreign-born persons accounted for 28% of TB among non-Hispanic blacks and 19% among non-Hispanic whites. Non-Hispanic blacks with TB in the rest of the United States shared characteristics with non-Hispanic blacks with TB in the seven states. In 2002, the TB rate for non-Hispanic blacks in the rest of the United States (12.4 per 100,000 population) was similar to that for non-Hispanic blacks in the southeastern states (11.3). However, the TB rate for non-Hispanic whites in the rest of the United States (1.4) was 42% lower than the rate for non-Hispanic whites in the seven states (2.4), resulting in a black-to-white rate ratio of 8.9 in the rest of the United States, almost two times greater than the rate ratio in the seven states (4.7). During 1997--2002, non-Hispanic blacks and non-Hispanic whites in the rest of the United States experienced average yearly declines in TB rates (9.5% and 9.7%, respectively) similar to those observed in the seven southeastern states. Risk factors reported by non-Hispanic black TB patients in the seven states were similar to those reported by black patients in the rest of the United States, with the exception of excessive alcohol use, which was reported by 24% in the seven states and by 19% in the rest of the United States (Table). Reported by: Div of Tuberculosis Elimination, National Center for HIV, STD, and TB Prevention, CDC. Editorial Note:The rate of TB among both non-Hispanic blacks and non-Hispanic whites has declined substantially in recent years; however, racial disparities in TB continue. Effective, targeted programs are needed to achieve the 2010 national objective to reduce new TB cases to 1.0 per 100,000 population across all racial/ethnic populations (objective 14-11) (3). The reasons for racial disparities in TB rates are multifactorial and require further study. The findings in this report indicate that TB rates and risk factors are similar for non-Hispanic blacks in the seven southeastern states and in the rest of the country. Approximately 56% of TB cases in the seven states occurred among non-Hispanic blacks because a higher proportion of the population in the region is non-Hispanic black (27% versus 11% in the rest of the United States, respectively). The finding that the percentage of TB cases in children aged <5 years is higher in non-Hispanic blacks than in non-Hispanic whites suggests that a greater proportion of TB disease in blacks than whites might be the result of the recent transmission of Mycobacterium tuberculosis¶. A previous study determined that 44% of non-Hispanic blacks with TB had M. tuberculosis isolates with DNA genotypes that matched an isolate from one or more other patients, compared with 20% of non-Hispanic whites with TB (4). Patients with genetically clustered isolates represent recent transmission more commonly than TB patients with genetically unique isolates. Among persons with TB in the seven states studied, non-Hispanic blacks were more likely than non-Hispanic whites to report certain risk factors (e.g., drug use, excessive alcohol use, incarceration, infection with HIV) often associated with being socioeconomically disadvantaged or immunocompromised. Differences in socioeconomic status have been identified as key predictors of TB rates (5). As of 2002, the South** had the highest percentage of households with incomes below the federal poverty level†† (13.8%) of any region in the United States (6); this might account for the higher TB rate among non-Hispanic whites in the seven southeastern states, compared with the rest of the United States. General racial/ethnic disparities in health care also have been explained as a potential consequence of differential access to care, structural impediments in the health-care system, and unequal treatment (7). Whatever roles poor access to health care and poverty have in the elevated TB rate in non-Hispanic blacks, once blacks enter a TB treatment program, a high percentage receive directly observed therapy (DOT). This patient management technique is recognized in the United States as a critical component of successful TB treatment. The percentage of non-Hispanic blacks receiving DOT, which ensures that every treatment dose is administered, is consistent with their low rate of infection with multidrug-resistant TB. These performance measures indicate successful management of DOT programs in the non-Hispanic black population. The findings in this report are subject to at least two limitations. First, CDC's TB surveillance does not include data directly related to socioeconomic status, and previous findings that socioeconomic status was a key predictor of TB rates were not independently verified. Second, HIV status was unknown for 22% of non-Hispanic blacks and 34% of non-Hispanic whites, making these comparisons less reliable. In 2003, the federal Advisory Council for the Elimination of Tuberculosis and CDC developed a strategy for nongovernment organizations to help reduce TB disparities in the United States by studying local TB epidemiology, increasing awareness about TB disparities (especially among non-Hispanic blacks), and educating legislators. In addition, in 2002, CDC began funding three ongoing demonstration projects (in Georgia, Illinois, and South Carolina) to identify innovative strategies to accelerate the decline of TB among non-Hispanic blacks. In January 2004, CDC began the Tuberculosis Genotyping Program to identify instances of recent TB transmission, enabling earlier outbreak detection and more thorough contact investigations, which might help reduce racial disparities in TB in the United States (8). References
* Alabama, Arkansas, Georgia, Louisiana, Mississippi, South Carolina, and Tennessee. Florida was not included because of a substantially higher proportion (24% versus 2% in 1991) of TB cases among foreign-born persons than the other seven southeastern states. † Puerto Rico and other U.S. jurisdictions that report TB cases to CDC were not included. § Using information updated through March 2003. ¶ TB disease in adults results from either progression of recently transmitted M. tuberculosis or from reactivation of remote infections. In contrast, by definition, TB disease in children aged <5 years reflects recent transmission. ** Defined by the U.S. Census Bureau as the following: Alabama, Arkansas, Delaware, District of Columbia, Florida, Georgia, Kentucky, Louisiana, Maryland, Mississippi, North Carolina, Oklahoma, South Carolina, Tennessee, Texas, Virginia, and West Virginia. †† Based on the 2002 federal poverty level (FPL), which takes into account both income and household size. For example, in 2002, the FPL was an annual household income of $18,244 for a family of two adults with two children aged <18 years.
Table 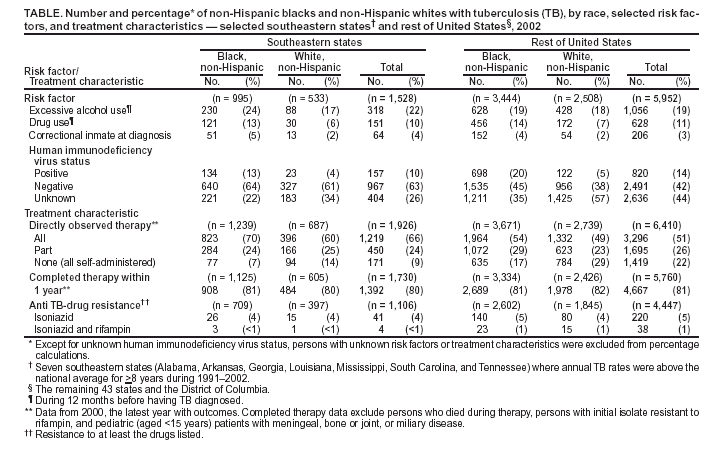 Return to top. Figure 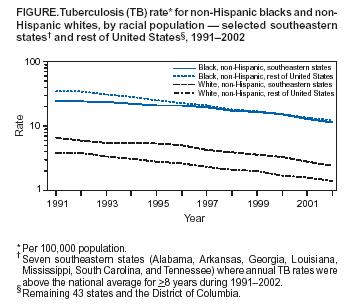 Return to top.
Disclaimer All MMWR HTML versions of articles are electronic conversions from ASCII text into HTML. This conversion may have resulted in character translation or format errors in the HTML version. Users should not rely on this HTML document, but are referred to the electronic PDF version and/or the original MMWR paper copy for the official text, figures, and tables. An original paper copy of this issue can be obtained from the Superintendent of Documents, U.S. Government Printing Office (GPO), Washington, DC 20402-9371; telephone: (202) 512-1800. Contact GPO for current prices. **Questions or messages regarding errors in formatting should be addressed to mmwrq@cdc.gov.Page converted: 7/1/2004 |
|||||||||
This page last reviewed 7/1/2004
|