 |
|
|
|
|
|
|
| ||||||||||
|
|
|
|
|
|
|
||||
| ||||||||||
|
|
|
|
|
Persons using assistive technology might not be able to fully access information in this file. For assistance, please send e-mail to: mmwrq@cdc.gov. Type 508 Accommodation and the title of the report in the subject line of e-mail. Cigarette Use Among High School Students --- United States, 1991--2003Cigarette use is the leading preventable cause of death in the United States (1). One of the national health objectives for 2010 is to reduce the prevalence of current cigarette use among high school students to <16% (objective no. 27-2b) (1). To examine changes in cigarette use among high school students in the United States during 1991--2003, CDC analyzed data from the national Youth Risk Behavior Survey (YRBS). This report summarizes the results of that analysis, which indicated that although 1) the prevalence of lifetime cigarette use was stable among high school students during the 1990s and 2) the prevalence of both current and current frequent cigarette use increased into the late 1990s, all three behaviors had declined significantly by 2003. Prevention efforts must be sustained to ensure this pattern continues and the 2010 objective is achieved. The national YRBS, a component of CDC's Youth Risk Behavior Surveillance System, used independent three-stage cluster samples for the 1991--2003 surveys to obtain cross-sectional data representative of public and private school students in grades 9--12 in all 50 states and the District of Columbia. During 1991--2003, sample sizes ranged from 10,904 to 16,296, school response rates ranged from 70% to 81%, student response rates ranged from 83% to 90%, and overall response rates ranged from 60% to 70%. For each cross-sectional national survey, students completed an anonymous, self-administered questionnaire that included identically worded questions about cigarette use. For this analysis, temporal changes for three behaviors were assessed: 1) lifetime cigarette use (i.e., ever tried cigarette smoking, even one or two puffs), 2) current cigarette use (i.e., smoked cigarettes on >1 of the 30 days preceding the survey), and 3) current frequent cigarette use (i.e., smoked cigarettes on >20 of the 30 days preceding the survey). For current cigarette use, temporal changes and subgroup differences in 2003 were analyzed by sex, race/ethnicity, and grade. Data are presented only for non-Hispanic black, non-Hispanic white, and Hispanic students because the numbers of students from other racial/ethnic groups were too small for meaningful analysis. Data were weighted to provide national estimates, and SUDAAN was used for all data analyses. Temporal changes were analyzed by using logistic regression analyses that assessed linear and quadratic time effects simultaneously and controlled for sex, race/ethnicity, and grade. Quadratic trends indicated significant but nonlinear trends in the data over time. When a significant quadratic trend accompanied a significant linear trend, the data demonstrated a nonlinear variation (e.g., leveling off or change in direction) in addition to an overall increase or decrease over time. T-tests were used to examine differences in current cigarette use in 2003 by sex, race/ethnicity, and grade. All results are statistically significant (p<0.05) unless otherwise noted. Significant linear and quadratic trends were detected for lifetime and current cigarette use. The prevalence of lifetime cigarette use, although stable during the 1990s, declined significantly, from 70.4% in 1999 to 58.4% in 2003 (Table 1). The prevalence of current cigarette use increased from 27.5% in 1991 to 36.4% in 1997 and then declined significantly to 21.9% in 2003. A significant quadratic trend was detected for current frequent cigarette use; the prevalence increased from 12.7% in 1991 to 16.7% in 1997 and 16.8% in 1999, then declined significantly to 9.7% in 2003. Significant linear and quadratic trends were detected in current cigarette use among both sexes (Table 2). Among female students, the prevalence of current cigarette use peaked during 1997--1999 and then declined significantly to 21.9% in 2003. Among male students, the prevalence of current cigarette use peaked in 1997 and then declined significantly to 21.8% in 2003. Similarly, among white, white female, Hispanic, Hispanic female, Hispanic male, and 9th- and 11th-grade students, current cigarette use prevalence peaked by 1997 and then declined significantly in 2003. Significant quadratic trends were detected among white male, black, black female, black male, and 10th- and 12th-grade students, indicating that the prevalence of current cigarette use peaked by 1999 and then declined significantly. During 2003, white students were significantly more likely than black and Hispanic students to report current cigarette use. More white female students than black and Hispanic female students and more Hispanic female than black female students reported current cigarette use. The prevalence of current cigarette use was not significantly different among white, black, and Hispanic male students. By grade level, significantly more 10th-, 11th-, and 12th-grade students than 9th-grade students and more 12th-grade than 10th-grade students reported current cigarette use. Reported by: Office on Smoking and Health; Div of Adolescent and School Health, National Center for Chronic Disease Prevention and Health Promotion, CDC. Editorial Note:The findings in this report indicate that the prevalence of current cigarette use has declined substantially since the late 1990s and is at the lowest level since YRBS was initiated in 1991. These findings are consistent with trends observed in other national surveys, although the other surveys suggest the rate of decline might be slowing (2--4). Factors that might have contributed to the decline in cigarette use include 1) a 90% increase in the retail price of cigarettes during December 1997--May 2003 (5), 2) increases in school-based efforts to prevent tobacco use, and 3) increases in the proportion of young persons who have been exposed through the mass media to smoking-prevention campaigns funded by states or the American Legacy Foundation (6). Factors that might have slowed the rate of decline in cigarette use among young persons include 1) tobacco industry expenditures on tobacco advertising and promotion, which increased from $5.7 billion in 1997 to $11.2 billion in 2001 (7); 2) reductions in Master Settlement Agreement funds used for tobacco-use prevention; and 3) the frequency with which smoking was depicted in films (8). The findings in this report are subject to at least two limitations. First, these data apply only to youths who attend high school. Nationwide, among persons aged 16--17 years, approximately 6% were not enrolled in a high school program and had not completed high school (9). Second, the extent of underreporting or overreporting in YRBS cannot be determined, although the survey questions demonstrate test/retest reliability (10). Although the declines in cigarette use are encouraging, prevention efforts must be sustained if the nation is to reach its 2010 national health objective. In 2003, approximately one in five high school students were current smokers, and one in 10 were current frequent smokers. Reducing the prevalence of cigarette use further among young persons will require continued efforts in 1) devising targeted and effective media campaigns, 2) reducing depictions of tobacco use in entertainment media, 3) instituting campaigns to discourage family and friends from providing cigarettes to young persons, 4) promoting smoke-free homes, 5) instituting comprehensive school-based programs and policies in conjunction with supportive community activities to prevent smoking initiation and encourage smoking cessation, and 6) decreasing the number of adult smokers (e.g., parents) to present more nonsmoking role models. References
Table 1 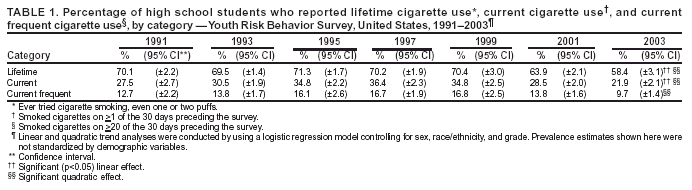 Return to top. Table 2 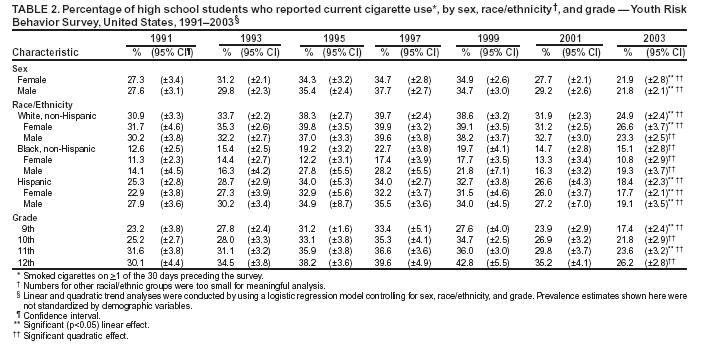 Return to top.
Disclaimer All MMWR HTML versions of articles are electronic conversions from ASCII text into HTML. This conversion may have resulted in character translation or format errors in the HTML version. Users should not rely on this HTML document, but are referred to the electronic PDF version and/or the original MMWR paper copy for the official text, figures, and tables. An original paper copy of this issue can be obtained from the Superintendent of Documents, U.S. Government Printing Office (GPO), Washington, DC 20402-9371; telephone: (202) 512-1800. Contact GPO for current prices. **Questions or messages regarding errors in formatting should be addressed to mmwrq@cdc.gov.Page converted: 6/17/2004 |
|||||||||
This page last reviewed 6/17/2004
|