 |
|
|
|
|
|
|
| ||||||||||
|
|
|
|
|
|
|
||||
| ||||||||||
|
|
|
|
|
Persons using assistive technology might not be able to fully access information in this file. For assistance, please send e-mail to: mmwrq@cdc.gov. Type 508 Accommodation and the title of the report in the subject line of e-mail. Monitoring Hospital-Acquired Infections to Promote Patient Safety -- United States, 1990-1999Please note: An erratum has been published for this article. To view the erratum, please click here. Hospital-acquired infections are adverse patient events that affect approximately 2 million persons annually (1). National Nosocomial Infections Surveillance (NNIS) is a voluntary, hospital-based reporting system established to monitor hospital-acquired infections and to guide the prevention efforts of infection control practitioners (ICPs). The NNIS approach may be a model for future programs aimed at preventing other adverse patient events (2). This report describes the decrease in infection rates reported in NNIS hospitals during 1990-1999, presents the results of a survey of ICP responsibilities, and discusses the importance of NNIS for monitoring adverse patient events. NNIS began in 1970 with 62 participating hospitals in 31 states. In 1999, 285 hospitals in 42 states participated in NNIS (1). All NNIS hospitals have >100 beds and tend to be larger than other U.S. hospitals (median size: 360 beds versus 210 beds); however, both NNIS and non-NNIS hospitals have a similar geographic distribution. The purposes of NNIS are to establish national risk-adjusted benchmarks for hospital-acquired infection rates and for device use ratios (3) by using uniform case definitions and data collection methods and computerized data entry and analysis. To promote the use of standardized data collection and analysis methods, ICPs receive 28 hours of training at CDC and are invited to attend a biennial conference. Trends in Nosocomial Infection Rates Patients in intensive care units (ICUs) are at high risk for nosocomial infections. By ICU type, these patients have been monitored using site-specific, risk-adjusted infection rates (4,5). During 1990-1999, risk-adjusted infection rates decreased for all three body sites (i.e., respiratory tract, urinary tract, and bloodstream) monitored in ICUs (Figure 1) (6). Bloodstream infection rates decreased substantially in medical (nonsurgical) ICUs (44%), coronary ICUs (43%), pediatric ICUs (32%), and surgical ICUs (31%). NNIS uses data from 1997 to 1999 as its benchmark (Table 1). Device use ratios, the proportion of days spent in the ICU in which the patient's treatment included invasive devices, also were calculated. Urinary catheter-associated urinary tract infection (UTI) rates were highest in medical (nonsurgical) ICUs (6.5 UTIs per 1000 days a catheter was used) and lowest in pediatric ICUs (5.6 UTIs per 1000 days a catheter was used). Central line-associated bloodstream infection (BSI) rates were highest in pediatric ICUs (7.7 BSIs per 1000 days a central line was used) and lowest in coronary ICUs (4.3 BSIs per 1000 days a central line was used). Ventilator-associated pneumonia (VAP) rates were highest in surgical ICUs (13.0 cases of pneumonia per 1000 days a ventilator was used) and were lowest in pediatric ICUs (5.0 cases of pneumonia per 1000 days a ventilator was used). The percentiles (Table 1) represent a measure of the variations in device-associated rates in NNIS ICUs. For example, the 25th percentile for VAP rates in the medical (nonsurgical) ICU was 4.1, (i.e., 25% of reporting medical [nonsurgical] ICUs had a VAP rate of >4.1). Device use ratios ranged from 0.22 for ventilators in coronary ICUs to 0.85 for urinary catheters in surgical ICUs. Survey of Infection Control Practitioners ICPs are usually registered nurses but also may be microbiologists, epidemiologists, or medical technologists. ICPs collect and interpret data, identify problems, and implement interventions to prevent infections and improve patient safety; hospitals should have at least one full-time ICP for every 250 occupied hospital beds (1,7,8). In 1999, participating NNIS hospitals were surveyed using a mailed questionnaire to determine the number of ICPs in each hospital and the spectrum of ICP activities. Of 285 NNIS hospitals surveyed, 225 (79%) reported data on ICPs in their facilities; 221 (96%) respondents reported a ratio of at least one ICP to 250 occupied hospital beds (median: one ICP per 115 beds; range: one ICP per 21 beds-one ICP per 382 beds). Although 68% of ICP work hours were devoted to inpatient infection-control activities, including surveillance, ICPs reported other responsibilities, such as noninfection-related quality improvement (6%), occupational health (4%), and administration or clinical duties (12%). Reported by: Nosocomial Infections Surveillance Activity, Hospital Infections Program, National Center for Infectious Diseases; and an EIS Officer, CDC. Editorial Note:The Institute of Medicine reports that preventable adverse patient events, including hospital-acquired infections, are responsible for 44,000-98,000 deaths annually at a cost of $17-$29 billion (2). In 1990, one of the national health objectives for 2000 was to reduce by at least 10% the incidence of surgical wound infections and nosocomial infections in ICU patients in U.S. hospitals (objective 20.5). NNIS data indicate that almost all goals have been achieved or surpassed (6). This report demonstrates the value of NNIS as a model to prevent hospital-acquired infections. The elements of NNIS critical for rate reduction included 1) voluntary participation and confidentiality for NNIS hospitals; 2) standard definitions and protocols; 3) targeted, high-risk populations (e.g., intensive care and surgical patients); 4) site-specific, risk-adjusted infection rates comparable across institutions; 5) adequate numbers of trained ICPs; 6) data dissemination to health-care providers; and 7) links between monitored rates and prevention efforts (3,8,9). The findings in this report are subject to at least three limitations. First, the improvements in NNIS hospitals may reflect other national efforts to prevent infections (e.g., new research findings and prevention guidelines). Second, some rate reductions may be attributable to the shift in the U.S. health-care system from hospital-based care to nonhospital settings. Third, most events reported to CDC are obtained from patient record review. More efficient methods that use electronic information could save substantial time, and financial and personnel resources; however, these methods have not been validated for most infections and other adverse health events (10). Although reductions in hospital-acquired infections were substantial, the wide range of infection-rate percentiles suggests that a better understanding of this variability is needed. Also, NNIS has not conducted surveillence in nonhospital settings. Efforts are needed in these locations to determine the extent of health-care-related infection rates and where to target prevention efforts. The key to NNIS is having ICPs who use monitoring data to implement prevention activities. Any new system for preventing adverse health events will need to develop professionals at the health-care facility to design and implement appropriate interventions. References
Table 1 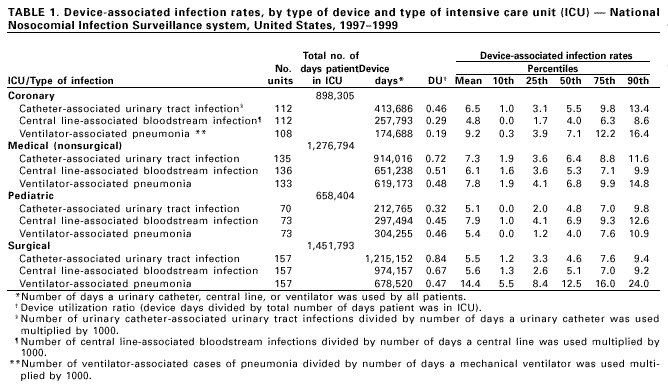 Return to top. Figure 1 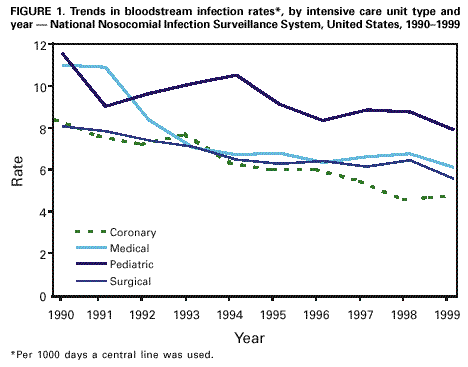 Return to top. Disclaimer All MMWR HTML versions of articles are electronic conversions from ASCII text into HTML. This conversion may have resulted in character translation or format errors in the HTML version. Users should not rely on this HTML document, but are referred to the electronic PDF version and/or the original MMWR paper copy for the official text, figures, and tables. An original paper copy of this issue can be obtained from the Superintendent of Documents, U.S. Government Printing Office (GPO), Washington, DC 20402-9371; telephone: (202) 512-1800. Contact GPO for current prices. **Questions or messages regarding errors in formatting should be addressed to mmwrq@cdc.gov.Page converted: 3/2/2000 |
|||||||||
This page last reviewed 5/2/01
|