 |
|
|
|
|
|
|
| ||||||||||
|
|
|
|
|
|
|
||||
| ||||||||||
|
|
|
|
|
Persons using assistive technology might not be able to fully access information in this file. For assistance, please send e-mail to: mmwrq@cdc.gov. Type 508 Accommodation and the title of the report in the subject line of e-mail. Surveillance for Asthma -- United States, 1960-1995David M. Mannino, M.D.(1) David M. Homa, Ph.D.(1) Carol A. Pertowski, M.D.(1) Annette Ashizawa, Ph.D.(1,2) Leah L. Nixon, M.P.H.(1) Carol A. Johnson, M.P.H.(1) Lauren B. Ball, D.O., M.P.H.(1) Elizabeth Jack1 David S. Kang1 (1) Division of Environmental Hazards and Health Effects National Center for Environmental Health (2) Council of State and Territorial Epidemiologists Abstract Problem/Condition: Asthma is one of the most common chronic diseases in the United States, and it has increased in importance during the preceding 20 years. Despite its importance, no comprehensive surveillance system has been established that measures asthma trends at the state or local level. Reporting Period: This report summarizes and reviews national data for specific endpoints: self-reported asthma prevalence (1980-1994), asthma office visits (1975-1995), asthma emergency room visits (1992-1995), asthma hospitalizations (1979-1994), and asthma deaths (1960-1995). Description of System: The National Center for Health Statistics (NCHS) annually conducts the National Health Interview Survey, which asks about self-reported asthma in a subset of the sample. NCHS collects physician office visit data with the National Ambulatory Medical Care Survey, emergency room visit data with the National Hospital Ambulatory Medical Care Survey, and hospitalization data with the National Hospital Discharge Survey. NCHS also collects mortality data annually from each state and produces computerized files from these data. We used these datasets to determine self-reported asthma prevalence, asthma office visits, asthma emergency room visits, asthma hospitalizations, and asthma deaths nationwide and in four geographic regions of the United States (i.e., Northeast, Midwest, South, and West). Results: We found an increase in self-reported asthma prevalence rates and asthma death rates in recent years both nationally and regionally. Asthma hospitalization rates have increased in some regions and decreased in others. At the state level, only death data are available for asthma; death rates varied substantially among states within the same region. Interpretation: Both asthma prevalence rates and asthma death rates are increasing nationally. Available surveillance information are inadequate for fully assessing asthma trends at the state or local level. Implementation of better state and local surveillance can increase understanding of this disease and contribute to more effective treatment and prevention strategies. INTRODUCTION Asthma is a chronic inflammatory disorder of the airways characterized by variable airflow obstruction and airway hyperresponsiveness in which prominent clinical manifestations include wheezing and shortness of breath (1). It is a multifactorial disease that has been associated with familial, infectious, allergenic, socioeconomic, psychosocial, and environmental factors (2,3). Asthma morbidity and mortality are largely preventable with improved patient education regarding the factors associated with asthma and medical management (1,4). Surveillance information on asthma, with the exception of mortality data, are not available at the state or local level. Such information is needed to identify high-risk populations and to design and evaluate interventions aimed at preventing the development or exacerbation of this disease. This report summarizes and reviews national data for self-reported asthma prevalence (1980-1994), asthma office visits (1975-1995), asthma emergency room visits (1992-1995), asthma hospitalizations (1979-1994), and asthma deaths (1960-1995). In addition, this report describes several asthma surveillance programs at the state and local levels that may be useful to other states that are developing asthma surveillance systems. METHODS We used existing databases to evaluate self-reported asthma prevalence, asthma office visits, asthma emergency room visits, asthma hospitalizations, and asthma mortality. At the state level, only asthma mortality data are reported; the other endpoints are available only at regional and national levels. The four regions * (Figure_1) represent standardized geographical divisions defined by the U.S. Bureau of the Census. We used data from the 1960, 1970, 1980, and 1990 censuses and the 1996 intercensal estimate to calculate denominators for office visit rates, emergency room visit rates, hospitalization rates, and death rates. We stratified each censal dataset by region, sex, race (white, black, and other), and age group (i.e., 0-4 years, 5-14 years, 15-34 years, 35-64 years, and greater than or equal to 65 years). The 1960 census reported only whites and nonwhites; therefore, we used the 1970 region-, sex-, and age-specific proportions between black and other nonwhite populations and applied this proportion to the 1960 region-, sex-, and age-specific population of nonwhites. We used linear interpolation to estimate the population for years in which there was neither census data nor the intercensal estimate. We used the civilian, noninstitutionalized population of the United States as our denominator for prevalence rates. The diagnosis of asthma is less reliable among persons aged less than 5 years and those aged greater than 35 years (5) compared with persons aged 5-34 years. Persons in these same age groups, however, are the ones most likely to be adversely affected by asthma (6,7). The figures in this summary depict the asthma endpoints, by region, both among the overall population and among persons aged 5-34 years. For most datasets, we grouped the data into 3-year groups. We also race-, sex-, and age-adjusted our estimates to the 1970 U.S. population, using the five age groups (i.e., 0-4 years, 5-14 years, 15-34 years, 35-64 years, and greater than or equal to 65 years). We used 1970 as a reference population because we had complete race, sex, and age data available from the 1970 census. All analyses were done using SAS (SAS Institute, Cary, NC) and SUDAAN (RTI, Chapel Hill, NC). We used the procedure REG in SAS to determine whether the trends over time in asthma prevalence rates, asthma office visit rates, asthma emergency room visit rates, asthma hospitalization rates, and asthma death rates were significant. We used two-tailed t tests to compare asthma hospitalization rates and asthma emergency room visit rates between regions, racial groups, age groups, and males and females in a single year or group of years. Using the Bonferroni adjustment for multiple comparisons in up to five groups, we considered a p value of 0.05 as significant. Self-Reported Prevalence The National Health Interview Survey (NHIS) is conducted annually among a probability sample of the civilian, noninstitutionalized population of the United States by the National Center for Health Statistics (NCHS) (8). The NHIS questionnaire asks participants about their own present health status and that of other persons in their families, including whether they have had any recent illnesses. Each year, one sixth of the sample (approximately 20,000 of 120,000 persons) are asked whether they have had any one of 17 chronic respiratory diseases, including asthma, during the preceding 12 months. We used this subset of NHIS to determine the prevalence of self-reported asthma, using NHIS weights to determine national estimates of the population affected. Information on chronic conditions is collected on NHIS core questionnaire in which questions are asked about all family members. Although all members of the family are invited to participate in the interview, in many cases, a single respondent provides information for other family members. Thus, for adults, information on asthma may not have been reported by subjects themselves; for children, all information would have been provided by an adult responding for the family. We used SUDAAN (RTI, Research Triangle Park, NC) to determine the relative standard errors (RSEs) of the estimates and to indicate which estimates were reliable (i.e., RSE less than 30%, which is equivalent to a relative confidence interval less than 59%). Office Visits Ambulatory medical care is the predominant means of providing health-care services in the United States. Since 1975, NCHS has administered the National Ambulatory Medical Care Survey (NAMCS), collecting information on ambulatory patient visits to physicians' offices (9). Of the 3,507 physicians included in the 1975 NAMCS sample, 2,081 actually participated in the survey. Approximately 2,000 physicians participated in the survey in subsequent years that the survey was administered (i.e., 1980, 1981, 1985, and 1989-1995). For each year, 30,000-60,000 patient encounters were included in the database. We identified visits for which asthma (International Classification of Diseases, Ninth Revision, Clinical Modification {ICD-9-CM}, code 493) was the first-listed diagnosis. Sample weights were used to obtain national estimates of annual office visits for asthma. We used the RSEs, which are listed with the database documentation, to indicate which estimates were reliable (i.e., RSE less than 30%). Emergency Room Visits Since 1992, information on visits to hospital emergency and outpatient departments has been collected annually by NCHS in the National Hospital Ambulatory Medical Care Survey (NHAMCS) (10). For this analysis, we included only the emergency room database. For each year, records from 25,000 to 45,000 emergency room visits were included in the survey. We identified emergency room records for which asthma (ICD-9-CM-493) was listed as the first diagnosis. We used the survey weights to obtain national estimates of emergency room visits for asthma. We used the RSEs to indicate which estimates were reliable (i.e., RSE less than 30%). Hospitalizations To investigate national trends in hospitalizations attributable to asthma in the United States during 1979-1994, we analyzed hospitalization data from the National Hospital Discharge Survey (NHDS) (11), which is conducted annually by NCHS. These data were obtained from a sample of inpatient records from a national sample of non-federal general and short-stay specialty hospitals in the United States. Hospitalizations considered attributable to asthma were those with ICD-9-CM-493 listed as the primary discharge diagnosis. Data on race were missing for 5%-20% of the sample in any given year (12); we excluded these subjects from the race-specific rate calculations but included them in all of the other rate calculations. Thus, the race-specific, age-adjusted rates underestimate the true hospitalization rates. We used the RSEs to indicate which estimates were reliable (i.e., RSE less than 30%). The survey was redesigned in 1988; our trend analysis was done on data during 1988-1994 (13). Mortality We reviewed the Underlying Cause of Death dataset from NCHS (14) for 1960 through 1995 to identify all deaths in which asthma was selected as the underlying cause of death. During this period, three different ICD classifications were used to indicate a diagnosis of asthma: ICD-7 (code 241, 1960-1967), International Classification of Diseases, Eighth Revision (Adapted) (ICDA-8) (code 493, 1968-1978), and ICD-9 (code 493, 1979-1995). The comparability ratio for asthma (ICD-9/ICDA-8) is 1.35, indicating that approximately 35% more deaths would be attributed to asthma as the underlying cause of death under ICD-9 as compared with ICDA-8 (15). Part of this change was related to classifying "asthmatic bronchitis" as "bronchitis" in ICDA-8 but as "asthma" in ICD-9 (16). The comparability ratio for asthma (ICDA-8/ICD-7) is 0.70, indicating that approximately 30% fewer deaths would have been assigned to asthma under ICDA-8 compared with ICD-7 (17). For 1960 and 1961 mortality data, race was classified as white and nonwhite. For these years, we estimated the number of blacks and persons of other races within the nonwhite stratum (by state, race, and age) by using the proportion of blacks and persons of other races in that same stratum during 1962-1963. We used a similar technique to estimate the number of deaths among blacks and whites in New Jersey for 1962 and 1963, as no race data were available for that state for those years. In addition to the regional analysis, we did a state-by-state analysis of death rates among blacks and whites within 6-year periods. Among blacks, we restricted our analysis to states in which two or more asthma deaths occurred annually over the 6-year period, corresponding to an RSE of less than 30%. Our trend analysis was limited to data during 1979-1995. RESULTS During the preceding 15 years, prevalence and death rates for asthma have increased both nationally and regionally. Regional differences were apparent for some endpoints (e.g., hospitalization rates and emergency room visit rates) but not for others (e.g., prevalence rates). Self-Reported Prevalence The self-reported prevalence rate for asthma increased 75% from 1980 to 1994; by 1993-1994, an estimated 13.7 million persons reported asthma during the preceding 12 months (Table_1). This increasing trend in rates was evident among all race strata, both sexes, and all age groups (p less than 0.05 for all). The most substantial increase occurred among children aged 0-4 years (160%, from 22.2 per 1,000 to 57.8 per 1,000; p less than 0.05) and persons aged 5-14 years (74%, from 42.8 per 1,000 to 74.4 per 1,000; p less than 0.05) (Table_2). During 1993-1994 the self-reported prevalence rate for asthma was slightly higher among persons aged less than or equal to 14 years than among persons aged greater than or equal to 15 years. The increasing trend in asthma prevalence rates during 1980-1994 was evident and significant (p less than 0.05) in every region of the United States, with the prevalence patterns in the overall population similar to those among persons aged 5-34 years (Figure_2) and (Figure_3). During 1993-1994, asthma prevalence rates were similar in all four regions of the country. Office Visits From 1975 to 1993-1995, the estimated annual number of office visits for asthma more than doubled, from 4.6 million to 10.4 million (Table_3). Repeat visits could not be separated out in the data; therefore, the number of persons affected cannot be determined. Increasing rates were evident among all race strata, both sexes, and all age groups (Table_4). Estimated regional rates for asthma office visits also increased, but not uniformly (Figure_4) and (Figure_5). During 1993-1995, the rate for office visits for asthma was lowest among persons aged 15-34 years (p less than 0.05) (Table_4). We did not report on hospital outpatient visits for asthma, which comprise less than 10% of total visits for asthma (18), and for which data were only available for 1992-1995. Emergency Room Visits Data for emergency room visits are available for 1992-1995. Over this period, the national rate of emergency room visits for asthma did not change significantly (p less than 0.05). In 1995, there were an estimated greater than 1.8 million emergency room visits for asthma (Table_5). Blacks had consistently higher rates for emergency room visits than whites (p less than 0.05), and rates decreased as age strata increased (Table_6). In 1995, the Northeast had higher rates than the South and West, both among the entire population and among persons aged 5-34 years (p less than 0.05) (Figure_6) and (Figure_7). For each year, the rate for emergency room visits for asthma decreased with increasing age (Table_6). Hospitalizations Between 1979-1980 and 1993-1994, the estimated national number of asthma-related hospitalizations increased from 386,000 to 466,000 (Table_7), whereas the national asthma hospitalization rate was not significantly changed (p greater than 0.05; Table_8). During this period, hospitalization rates for asthma were consistently higher among blacks than they were among whites (p less than 0.05) (Table_8). During 1988-1994, asthma hospitalization rates increased in the Northeast but decreased in the Midwest and West (p less than 0.05). By 1993-1994, age-adjusted asthma hospitalization rates were higher among persons residing in the Northeast than they were among those residing in the West (p less than 0.05) (Figure_8). A similar pattern was exhibited in the rates among persons aged 5-34 years (Figure_9). In every grouping of years, asthma hospitalization rates were highest among persons aged 0-4 years, lowest among persons aged 15-34 years, and intermediate among persons aged greater than or equal to 35 years (Table_8). Mortality Overall rates of death with asthma as the underlying cause decreased from 1960-1962 through 1975-1977, and gradually increased again in all race, sex, and age strata. (Table_9) and (Table_10). Blacks had consistently higher death rates than whites. Death rates were consistently higher in older age strata. In most race-, sex-, and age-strata, death rates were lower during 1968-1978, when the ICDA-8 coding system was being used, than in other years. Changes in ICD codes also may have affected death rates by region (Figure_10) and (Figure_11). We found a difference in the regional death rates for the entire population when compared with the death rates among persons aged 5-34 years; the West had the highest death rates in the overall population, whereas the Northeast and Midwest had the highest rates among persons aged 5-34 years. Death rates also varied among states within regions among both whites (Table_11) and among blacks (Table_12). DISCUSSION This report describes several trends, raises questions, and highlights the need for improved surveillance of asthma and other chronic respiratory diseases. The overall picture of asthma is changing. National statistics indicate that asthma prevalence and mortality have increased in recent years, despite numerous advancements in the diagnosis and treatment of asthma. The reasons for these increases are not clear (2). The data cannot be used to differentiate between a true increase in asthma versus an increase in the diagnosis of asthma by physicians (19). Asthma-related deaths varied substantially by age group. Although asthma prevalence was lowest for persons aged greater than or equal to 35 years, this group accounted for greater than 85% of the asthma mortality. This may reflect an overlap in diagnosis of asthma with chronic obstructive pulmonary disease (COPD), an overlap most likely to occur among older persons. Clinically, the key difference between these conditions is that decreases in airway function are reversible in asthma, but not in COPD. However, persons with longstanding asthma, especially if inadequately treated, can develop irreversible changes in lung function (20). Conversely, many persons with COPD can improve their lung function with interventions such as smoking cessation or medication (21). Trends in overall asthma mortality through the 1960s and 1970s may have been affected by both changes in clinical diagnosis and changes in the ICD coding system (16). At the state level, only mortality data are available for asthma. Age-adjusted death rates for asthma during 1990-1995 varied substantially from state to state, even among states in the same region (Table_11) and (Table_12). We have used several measures of asthma morbidity: self-reported prevalence, office visits, emergency room visits, and hospitalizations. The overall national increase in the prevalence of asthma, which has been previously reported, occurred in all regions of the United States. We observed different trends, however, in hospitalization rates. In 1979, the four regions had similar hospitalization rates, both for the overall population and for persons aged 5-34 years. By 1994, overall rates in the Northeast were more than twice the rates in the West; among persons aged 5-34 years, the difference was more than threefold (Figure_8) and (Figure_9). The possible reasons for these differences include differences among the regions in asthma severity (22), asthma treatment (23), physician diagnosis (22), access to health care (24,18), climatic and home heating factors (25), or exposure to air pollutants (26,27). Caution should be exercised in interpreting trends over time, in that methods of data collection, disease coding, and disease recognition have changed over the years (13,16). The summary differences in asthma morbidity outcomes among regions raise the question of whether rates within the regions are also heterogeneous. The previously described state-to-state differences in death rates suggest that morbidity may also differ within regions and highlight the need for asthma surveillance data at the state and local level. A 1996 survey by the Council of State and Territorial Epidemiologists and CDC revealed an interest in establishing asthma surveillance systems among states and territories that do not have programs (28). Of the 43 state respondents who did not have an asthma-control program, 37 (86%) were interested in establishing such programs. Respondents cited funding and manpower limitations as the main reasons for not having an asthma-control program. Forty-two states had hospital discharge data available for characterizing asthma, but only 14 (33%) had used the data to examine asthma morbidity. In some states, legislative restraints and incompatible data formats contributed to an inability to use the data (28). Several states have used existing data or have initiated other approaches to examine asthma morbidity. Wisconsin analyzed billing data from hospital emergency rooms to develop a low-cost surveillance system for asthma. The main data source came from billing data for emergency room visits for 1990-1994 from Children's Hospital of Wisconsin in Milwaukee. Data collected included demographic information, date of visit, diagnosis, and length of stay (if the patient was hospitalized). Patients aged less than 19 years who had a diagnosis of asthma (ICD-9-CM-493), acute pharyngitis (ICD-9-CM-462), upper respiratory infections (ICD-9-CM-465), or acute bronchitis or bronchiolitis (ICD-9-CM-466) were included (29,30). Results from this study revealed that 20% of the children in the study accounted for 50% of the total number of emergency room visits, and 8% of these children accounted for 38% of all hospital admissions. Researchers also found that asthma admissions increased when sulfur dioxide levels in ambient air increased (29,30). The Michigan Department of Community Health has examined hospital data from the Michigan Inpatient Discharge Database for 1989-1993 for children aged less than 15 years with a primary diagnosis of asthma (ICD-9-CM-493) (31). Results indicated that the rate for asthma hospitalizations was higher for boys than for girls (43 per 10,000 versus 25 per 10,000) and that the rate for blacks was higher than for whites (81.3 per 10,000 versus 25.6 per 10,000). The data also demonstrated local differences, with three groups of counties in the southeast, southwest, and eastern parts of Michigan having higher hospitalization rates for asthma than the rest of the state (31). Other potential sources of asthma surveillance include billing data from Medicaid and Medicare and data from managed-care organizations. In 1995, Arizona had a higher asthma death rate than the overall U.S. population (2.8 versus 2.1 per 100,000), with particularly high rates in Maricopa County, in which the city of Phoenix is located. Billing data and managed-care data from Maricopa County demonstrated high hospital discharge rates, particularly among blacks and Hispanics (32). The Behavioral Risk Factor Surveillance System (BRFSS) is an ongoing random-digit-dialed telephone survey in which 45 states participate. The purpose of the survey is to ascertain the prevalence of behaviors and practices related to certain risk factors (e.g., cigarette smoking) associated with the leading causes of death in the United States. The system has core questions (e.g., about diabetes and tobacco use), which all state participants are required to ask and standardized modules (e.g., about health-care utilization and weight control), which are optional. States may also include additional health questions as part of the survey, although these questions are not nationally standardized. Since 1996, New Hampshire, New York, and Oregon have included additional questions about asthma, and in 1997, Washington added questions about asthma. Respondents from all four states were asked if a doctor or other health professional had told them that they had asthma. New Hampshire, New York, and Oregon had questions on medication usage. New Hampshire and Washington included questions regarding children in the household with asthma, whereas New York and Oregon included a question on emergency room and urgent-care visits. Oregon and New Hampshire have analyzed BRFSS data on asthma-specific questions. The American Lung Association of Oregon assisted in analyzing data for Oregon. These data, which are specific to adults, indicated that 6.6% of the 1995 respondents (n=2,371) and 7.4% of the 1996 respondents (n=2,932) reported active asthma (i.e., positive responses for wheezing during the preceding year and ever being told by a health provider that they had asthma). Nine percent of the respondents who had been told that they had asthma reported receiving emergency care for asthma during the year preceding the survey (33). Data from New Hampshire revealed that 11% of the respondents (n=1,502) reported that they had been told that they had asthma. Of those with asthma (n=166), 19.9% of the males and 44.6% of the females had used medication. Almost 10% of the respondents reported that they had a child with asthma (L. Powers, New Hampshire Department of Health and Human Services, personal communication, 1997). Asthma surveillance data collected by states have many uses. Researchers in Wisconsin have demonstrated that asthma surveillance data can be used to investigate correlations between environmental events and asthma morbidity. States are also using data to develop prevention strategies. In Michigan, prevention strategies have been implemented in areas with elevated hospital discharge rates for asthma. In southeast Michigan, an area where hospitalization rates for asthma are high, asthma has been made a health priority in a seven-county area. One county health department has organized an advisory committee to develop strategies for prevention (K. Wilcox, Michigan Department of Health, personal communication, 1997). The experience in Arizona highlights the importance of partnerships between the public and private sectors in collecting and analyzing surveillance data. Nationwide, CDC can help states identify potential partners in collecting surveillance data and also can help promote collaborative efforts. One component of a proposed national strategy for asthma control and surveillance is to support the development of state-based asthma surveillance systems, using existing databases. As indicated by the state systems highlighted in this report, developing state-based surveillance systems for asthma will likely require the use of several sources of data. These data sources should be easily accessible and not costly. Some surveillance data that already exist include hospital discharge data, billing and insurance data, and managed-care data (34). Hospital discharge data and the billing and insurance data (e.g., Medicare and Medicaid) would probably be the most accessible and least costly data sources in many states. Because managed-care organizations are private entities, use of their data may require the development of specific collaborative projects (32). Potential national activities to promote the development of state surveillance systems include providing technical assistance on the design and implementation of systems and developing standardized data elements and case definitions for use by states. National activities can also encourage states to share information on data collection and analysis and on the development and assessment of control measures. A second component of a proposed national strategy for asthma control and surveillance is to develop new databases that can provide estimates of morbidity at the state level. One approach that may meet these criteria is the BRFSS, which, in its present form, can obtain data reliable for adults but not for children. The use of an asthma module with randomly selected households can permit researchers to estimate asthma rates among adults. Another potential new source of data is the State and Local Integrated Telephone Survey, which is being piloted by NCHS and is modeled after NHIS. It could be used to obtain data on both persons with diagnosed asthma and persons with asthma symptoms (e.g., coughing or wheezing) but no diagnosis. This report presents data on asthma morbidity and mortality and highlights the need for better state and local surveillance of asthma outcomes. Collecting local asthma data can aid in assessing the etiology of asthma and in evaluating prevention strategies. State-specific data can help public health officials direct prevention efforts and allocate resources. Finally, asthma surveillance systems can provide an opportunity for health departments to develop partnerships with voluntary associations, managed-care organizations, and other groups to better understand, prevent, and treat a growing and expensive health problem that affects both children and adults (4). References
* Northeast=Connecticut, Maine, Massachusetts, New Hampshire, New
Jersey, New York, Pennsylvania, Rhode Island, and Vermont;
Midwest=Illinois, Indiana, Iowa, Kansas, Michigan, Minnesota, Missouri,
Nebraska, North Dakota, Ohio, South Dakota, and Wisconsin; South=
Alabama, Arkansas, Delaware, District of Columbia, Florida, Georgia,
Kentucky, Louisiana, Maryland, Mississippi, North Carolina, Oklahoma,
South Carolina, Tennessee,
Texas, Virginia, and West Virginia; and West=Alaska, Arizona,
California, Colorado, Hawaii, Idaho, Montana, Nevada, New Mexico,
Oregon, Utah, Washington, and Wyoming.
TABLE 1. Estimated average annual number of persons with self-reported asthma during the preceding 12
months, by race, sex, and age group -- United States, National Health Interview Survey, 1980-1994 *
========================================================================================================
Category                 1980     1981-1983     1984-1986      1987-1989    1990-1992    1993-1994
--------------------------------------------------------------------------------------------------------
Race
 White              5,790,000     6,560,000     7,430,000      8,270,000    9,110,000   10,700,000
 Black                880,000     1,020,000     1,030,000      1,510,000    1,590,000    1,880,000
 Other               100,000+      180,000+      320,000+       280,000+      380,000      540,000
Sex
 Male               3,350,000     3,730,000     4,080,000      4,910,000    5,260,000    6,150,000
 Female             3,410,000     4,110,000     4,680,000      5,290,000    6,060,000    7,400,000
Age group (yrs)
  0- 4                360,000       550,000       600,000        620,000      870,000    1,280,000
  5-14              1,520,000     1,560,000     1,790,000      2,130,000    2,360,000    2,790,000
 15-34              2,160,000     2,410,000     2,810,000      3,210,000    3,320,000    4,050,000
 35-64              1,960,000     2,410,000     2,460,000      2,980,000    3,630,000    4,090,000
  >=65                770,000       920,000     1,100,000      1,260,000    1,150,000    1,480,000
Total&              6,770,000     7,850,000     8,760,000     10,200,000   11,330,000   13,690,000
--------------------------------------------------------------------------------------------------------
* All relative standard errors are <30% (i.e., relative confidence interval <59%) unless otherwise
  indicated.
+ Relative standard error of the estimate is 30%-50%; the estimate is unreliable.
& Numbers for each variable may not add up to total because of rounding error.
========================================================================================================
Return to top. Table_2 Note: To print large tables and graphs users may have to change their printer settings to landscape and use a small font size. TABLE 2. Estimated average annual rate* of self-reported asthma during the preceding 12 months, by race, sex, and age group -- United States, National Health Interview Survey, 1980-1994 + ===================================================================================================== Category 1980 1981-1983 1984-1986 1987-1989 1990-1992 1993-1994 ----------------------------------------------------------------------------------------------------- Race& White 30.4 33.9 37.7 41.1 44.7 50.8 Black 34.0 38.0 36.4 51.7 52.2 57.8 Other 22.5@ 31.7@ 28.2@ 32.7@ 39.7 48.6 Sex& Male 32.0 34.3 36.8 43.0 45.3 51.1 Female 29.2 34.7 38.4 42.3 47.5 56.2 Age group (yrs) 0- 4 22.2 32.6 34.3 33.9 46.1 57.8 5-14 42.8 44.7 51.1 60.7 65.9 74.4 15-34 27.7 30.2 35.1 40.1 41.7 51.8 35-64 28.1 33.1 32.0 36.8 42.3 44.6 >=65 30.7 34.4 38.9 42.1 36.4 44.6 Total& 30.7 34.6 37.6 42.9 46.6 53.8 ----------------------------------------------------------------------------------------------------- * Per 1,000 population. + All relative standard errors are <30% (i.e., relative confidence interval <59%) unless otherwise indicated. & Age-adjusted to the 1970 U.S. population. @ Relative standard error of the estimate is 30%-50%; the estimate is unreliable. ===================================================================================================== Return to top. Table_3 Note: To print large tables and graphs users may have to change their printer settings to landscape and use a small font size. TABLE 3. Estimated average number of office visits for asthma as the first-listed diagnosis, by race, sex, and age group -- United States, National Ambulatory Medical Care Survey, 1975-1995 * ======================================================================================================= Category 1975 1980-1981 1985 1989 1990-1992 1993-1995 ------------------------------------------------------------------------------------------------------- Race White 4,084,000 4,804,000 5,663,000 5,471,000 6,980,000 8,316,000 Black 463,000+ 584,000+ 702,000 893,000 1,196,000 1,373,000 Other & & & & 290,000 686,000 Sex Male 2,173,000 2,643,000 2,972,000 2,458,000 3,695,000 4,252,000 Female 2,460,000 2,830,000 3,531,000 4,364,000 4,866,000 6,122,000 Age group (yrs) 0- 4 429,000+ 517,000+ 556,000 626,000+ 950,000 1,024,000 5-14 867,000 1,629,000 1,520,000 975,000 1,821,000 2,004,000 15-34 1,009,000 1,140,000 1,206,000 1,580,000 1,984,000 1,876,000 35-64 1,743,000 1,506,000 2,275,000 2,684,000 2,617,000 3,982,000 >=65 584,000 680,000 945,000 957,000 1,187,000 1,488,000 Total@ 4,632,000 5,472,000 6,502,000 6,822,000 8,559,000 10,374,000 ------------------------------------------------------------------------------------------------------- * All relative standard errors are <30% (i.e., relative confidence interval <59%) unless otherwise indicated. + Relative standard error of the estimate is 30%-50%; the estimate is unreliable. & Relative standard error of the estimate exceeds 50%. @ Numbers for each variable may not add up to total because of rounding error and missing race for 1989 and 1990-1992. ======================================================================================================= Return to top. Table_4 Note: To print large tables and graphs users may have to change their printer settings to landscape and use a small font size. TABLE 4. Estimated average rates* of office visits for asthma as the first-listed diagnosis, by race, sex, and age group -- United States, National Ambulatory Medical Care Survey, 1975-1995 + ======================================================================================== Category 1975 1980-1981 1985 1989 1990-1992 1993-1995 ---------------------------------------------------------------------------------------- Race& White 22.2 26.2 29.3 26.2 34.6 39.6 Black 19.7@ 22.4@ 26.8 29.9 39.5 43.8 Other ** ** ** ** 17.3 34.1 Sex& Male 21.1 25.8 27.3 21.0 31.2 33.9 Female 21.5 23.7 28.3 32.7 36.7 43.6 Age group (yrs) 0- 4 25.3@ 30.4@ 30.7 32.7@ 48.2 50.3 5-14 22.5 45.6 42.6 27.0 49.3 51.5 15-34 14.1 13.9 14.6 19.0 23.9 22.8 35-64 25.4 20.7 28.8 31.7 29.5 41.7 >=65 25.3 25.8 33.0 30.9 37.0 44.0 Total& 21.4 25.0 27.9 27.0 34.1 39.0 ---------------------------------------------------------------------------------------- * Per 1,000 population. + All relative standard errors are <30% (i.e, relative confidence interval <59%) unless otherwise indicated. & Age-adjusted to the 1970 U.S. population. @ Relative standard error of the estimate is 30%-50%; the estimate is unreliable. ** Relative standard error of the estimate exceeds 50%. ======================================================================================== Return to top. Table_5 Note: To print large tables and graphs users may have to change their printer settings to landscape and use a small font size. TABLE 5. Estimated annual number of emergency room visits for asthma as the first-listed diagnosis, by race, sex, and age group -- United States, National Hospital Ambulatory Medical Care Survey, 1992-1995 * =================================================================================== Category 1992 1993 1994 1995 ----------------------------------------------------------------------------------- Race White 925,000 1,000,000 927,000 1,018,000 Black 488,000 642,000 635,000 775,000 Other 54,000+ 43,000+ 45,000+ 73,000+ Sex Male 667,000 766,000 735,000 725,000 Female 800,000 920,000 872,000 1,140,000 Age group (yrs) 0- 4 288,000 334,000 298,000 248,000 5-14 291,000 317,000 313,000 322,000 15-34 438,000 488,000 517,000 566,000 35-64 361,000 473,000 400,000 630,000 >=65 89,000 74,000 79,000 101,000 Total& 1,467,000 1,686,000 1,607,000 1,867,000 ----------------------------------------------------------------------------------- * All relative standard errors are <30% (i.e., relative confidence interval <59%) unless otherwise indicated. + Relative standard error of the estimate is 30%-50%; the estimate is unreliable. & Numbers for each variable may not add up to total because of rounding error. =================================================================================== Return to top. Table_6 Note: To print large tables and graphs users may have to change their printer settings to landscape and use a small font size. TABLE 6. Estimated annual rate* of emergency room visits for asthma as the first-listed diagnosis, by race, sex, and age group -- United States, National Hospital Ambulatory Medical Care Survey, 1992-1995 + ============================================================== Category 1992 1993 1994 1995 -------------------------------------------------------------- Race& White 46.8 50.3 46.1 48.8 Black 151.9 197.4 191.2 228.9 Other 28.6@ 23.7@ 21.9@ 33.1@ Sex& Male 55.5 62.6 53.4 57.8 Female 61.4 69.7 65.9 82.3 Age group (yrs) 0- 4 143.5 164.3 145.5 120.7 5-14 77.1 82.8 80.3 81.3 15-34 52.9 59.0 62.8 69.2 35-64 39.6 50.7 41.8 64.4 >=65 27.7 22.6 23.5 29.5 Total& 58.8 66.6 62.9 70.7 -------------------------------------------------------------- * Per 10,000 population. + All relative standard errors are <30% (i.e., relative confidence interval <59%) unless otherwise indicated. & Age-adjusted to the 1970 U.S. population. @ Relative standard error of the estimate is 30%-50%; the estimate is unreliable. ============================================================== Return to top. Table_7 Note: To print large tables and graphs users may have to change their printer settings to landscape and use a small font size. TABLE 7. Estimated average number of hospitalizations for asthma as the first-listed diagnosis, by race, sex, and age group -- United States, National Hospital Discharge Survey, 1979-1994 * ================================================================================================= Category 1979-1980 1981-1983 1984-1986 1987-1989 1990-1992 1993-1994 ------------------------------------------------------------------------------------------------- Race White 271,000 317,000 322,000 296,000 254,000 240,000 Black 67,000 94,000 94,000 111,000 124,000 115,000 Other 12,000 17,000 23,000 27,000 23,000 26,000 Missing+ 35,000 23,000 40,000 42,000 83,000 85,000 Sex Male 167,000 193,000 204,000 205,000 206,000 191,000 Female 219,000 259,000 275,000 271,000 277,000 275,000 Age group (yrs) 0- 4 56,000 72,000 85,000 95,000 111,000 97,000 5-14 56,000 66,000 66,000 65,000 73,000 67,000 15-34 68,000 75,000 75,000 76,000 74,000 78,000 35-64 127,000 148,000 146,000 135,000 132,000 139,000 >=65 79,000 90,000 106,000 105,000 94,000 85,000 Total& 386,000 451,000 478,000 476,000 484,000 466,000 ------------------------------------------------------------------------------------------------- * All relative standard errors are <30% (i.e., relative confidence interval <59%). + Race data was not collected by some hospitals in the survey. & Numbers for each variable may not add up to total because of rounding error. ================================================================================================= Return to top. Table_8 Note: To print large tables and graphs users may have to change their printer settings to landscape and use a small font size. TABLE 8. Estimated average rates* of hospitalizations for asthma as the first-listed diagnosis, by race, sex, and age group -- United States, National Hospital Discharge Survey, 1979-1994 + ================================================================================================ Category 1979-1980 1981-1983 1984-1986 1987-1989 1990-1992 1993-1994 ------------------------------------------------------------------------------------------------ Race& White 14.2 16.2 15.9 14.1 11.9 10.9 Black 26.0 34.8 33.2 38.1 40.1 35.5 Other 28.2 30.6 32.7 33.6 24.4 23.0 Sex& Male 16.3 18.4 18.7 18.3 18.0 15.9 Female 18.7 21.4 21.8 21.0 20.8 20.0 Age group (yrs) 0- 4 34.3 42.8 48.5 52.2 58.3 49.7 5-14 15.9 19.2 18.9 18.7 20.6 18.0 15-34 8.7 9.5 9.5 9.5 9.3 10.0 35-64 18.2 20.3 19.0 16.7 15.4 15.2 >=65 31.5 33.6 37.5 35.2 29.7 25.6 Total& 17.6 20.0 20.5 19.8 19.7 18.1 ------------------------------------------------------------------------------------------------ * Per 10,000 population. + All relative standard errors are <30% (i.e., relative confidence interval <59%). & Age-adjusted to the 1970 U.S. population. ================================================================================================ Return to top. Table_9 Note: To print large tables and graphs users may have to change their printer settings to landscape and use a small font size. TABLE 9. Average number of deaths with asthma as the underlying cause of death diagnosis, by race, sex, and age group -- United States, Underlying Cause of Death dataset, 1960-1995 * ====================================================================================================================================================================== Category 1960-1962+ 1963-1965 1966-1967 1968-1971+ 1972-1974 1975-1978 1979-1980+ 1981-1983 1984-1986 1987-1989 1990-1992 1993-1995 ---------------------------------------------------------------------------------------------------------------------------------------------------------------------- Race White 4,342 3,928 3,499 1,786 1,588 1,466 2,193 2,542 2,947 3,520 3,800 4,084 Black 682 701 688 560 428 377 514 652 769 972 1,022 1,182 Other 43 44 45 36 22 28 38 62 84 116 141 165 Sex Male 3,226 2,806 2,392 1,052 879 782 1,213 1,352 1,534 1,800 1,894 2,036 Female 1,841 1,867 1,839 1,330 1,159 1,089 1,532 1,904 2,266 2,809 3,069 3,394 Age group (yrs) 0- 4 86 77 62 52 32 22 27 27 28 28 40 34 5-14 77 89 100 76 50 39 53 76 91 103 108 136 15-34 272 272 274 256 197 176 223 309 331 392 420 489 35-64 2,239 2,102 1,947 1,130 920 745 962 1,164 1,305 1,541 1,588 1,798 >=65 2,393 2,134 1,848 868 840 888 1,481 1,679 2,045 2,545 2,807 2,972 Total& 5,067 4,674 4,231 2,382 2,039 1,870 2,745 3,255 3,800 4,609 4,963 5,429 ---------------------------------------------------------------------------------------------------------------------------------------------------------------------- * All relative standard errors are <30%, (i. e., relative confidence interval <59%). + International Classification of Diseases (ICD), Seventh Revision: 1960- 1967; ICD, Eighth Revision (Adapted): 1968- 1978; and ICD, Ninth Revisio n: 1979- 1995. & Numbers for each variable may not add up to total because of rounding error. ====================================================================================================================================================================== Return to top. Table_10 Note: To print large tables and graphs users may have to change their printer settings to landscape and use a small font size. TABLE 10. Rates* of death with asthma as the underlying cause of death diagnosis, by race, sex, and age group -- United States, Underlying Cause of Death dataset, 1960-1995 + ====================================================================================================================================================================== Category 1960-1962& 1963-1965 1966-1967 1968-1971& 1972-1974 1975-1978 1979-1980& 1981-1983 1984-1986 1987-1989 1990-1992 1993-1995 ---------------------------------------------------------------------------------------------------------------------------------------------------------------------- Race@ White 26.6 23.1 20.0 9.8 8.3 7.2 10.2 11.4 12.5 14.2 14.6 15.1 Black 42.0 40.8 38.0 28.4 20.7 17.3 22.2 26.7 30.0 36.1 35.6 38.5 Other 25.7 23.0 22.3 15.3 8.1 8.4 10.3 13.6 15.3 17.6 18.7 17.7 Sex@ Male 38.6 32.6 27.0 11.4 9.1 7.7 11.5 12.2 13.2 14.7 14.8 15.1 Female 19.5 18.7 17.7 12.3 10.0 8.8 11.6 13.8 15.5 18.2 18.9 20.0 Age group (yrs) 0- 4 4.3 4.0 3.4 3.0 1.9 1.3 1.6 1.6 1.6 1.5 2.1 1.8 5-14 2.1 2.4 2.6 1.8 1.3 1.1 1.5 2.2 2.6 2.9 3.0 3.7 15-34 5.6 5.2 4.9 4.3 3.0 2.4 2.8 3.9 4.1 4.9 5.3 6.3 35-64 36.9 33.9 30.8 17.5 13.8 10.9 13.8 16.0 17.0 19.0 18.5 19.6 >=65 141.5 118.8 98.1 43.6 38.7 37.6 58.6 63.0 72.3 85.0 89.0 89.8 Total@ 28.2 24.9 21.8 11.8 9.5 8.2 11.5 13.1 14.4 16.6 17.1 17.9 ---------------------------------------------------------------------------------------------------------------------------------------------------------------------- * Per 1,000,000 population. + All relative standard errors are <30% (i. e., relative confidence interval <59%). & International Classification of Diseases (ICD), Seventh Revision: 1960- 1967; ICD, Eighth Revision (Adapted): 1968- 1978; ICD, Ninth Revision: 1979- 1995. @ Age- adjusted to the 1970 U. S. population. ====================================================================================================================================================================== Return to top. Table_11 Note: To print large tables and graphs users may have to change their printer settings to landscape and use a small font size. TABLE 11. Rates* of deaths for asthma as the underlying cause of death among whites, by year, region, and state -- United States, Underlying Cause of Death dataset, 1960-1995 ======================================================================================================== Region/State 1960-1965+ 1966-1971& 1972-1977+ 1978-1983& 1984-1989+ 1990-1995 -------------------------------------------------------------------------------------------------------- Northeast Connecticut 16.4 -- 6.7 -- 10.9 10.2 Maine 35.0 -- 10.2 -- 15.7 13.0 Massachusetts 25.3 -- 8.1 -- 14.7 14.1 New Hampshire 35.8 -- 8.9 -- 13.4 12.4 New Jersey@ 17.5 -- 4.5 -- 9.4 11.3 New York 19.8 -- 8.4 -- 16.7 17.0 Pennsylvania 22.5 -- 6.9 -- 10.0 11.6 Rhode Island 28.0 -- 6.1 -- 8.6 9.5 Vermont 27.1 -- 9.9 -- 11.9 14.7 Midwest Illinois 21.5 -- 7.0 -- 11.8 14.5 Indiana 26.9 -- 6.9 -- 12.3 14.4 Iowa 29.6 -- 6.8 -- 14.9 16.6 Kansas 26.9 -- 8.7 -- 13.7 14.8 Michigan 30.6 -- 9.1 -- 12.5 14.1 Minnesota 26.0 -- 8.1 -- 15.7 18.1 Missouri 27.8 -- 6.9 -- 9.0 12.7 Nebraska 36.2 -- 9.1 -- 20.6 23.0 North Dakota 33.0 -- 10.7 -- 19.5 20.0 Ohio 22.8 -- 6.3 -- 11.2 11.7 South Dakota 33.6 -- 6.6 -- 16.3 18.3 Wisconsin 23.3 -- 7.8 -- 14.0 14.9 South Alabama 20.4 -- 7.0 -- 9.3 10.1 Arkansas 18.4 -- 5.6 -- 9.5 15.3 Delaware 22.8 -- 4.2 -- 7.7 12.7 District of Columbia 20.2 -- 7.3 -- 13.0 12.1 Florida 22.5 -- 6.6 -- 9.8 11.5 Georgia 21.1 -- 6.9 -- 11.8 13.3 Kentucky 34.6 -- 11.5 -- 13.9 14.1 Louisiana 22.9 -- 7.3 -- 12.0 15.3 Maryland 18.8 -- 6.2 -- 9.4 11.1 Mississippi 19.8 -- 5.6 -- 10.3 11.1 North Carolina 24.0 -- 8.7 -- 14.1 16.4 Oklahoma 31.1 -- 7.3 -- 13.6 16.0 South Carolina 18.6 -- 7.4 -- 12.6 14.1 Tennessee 24.3 -- 7.5 -- 10.3 14.2 Texas 21.5 -- 6.9 -- 11.3 15.4 Virginia 22.4 -- 7.5 -- 15.4 16.3 West Virginia 33.6 -- 11.4 -- 14.1 15.4 West Alaska 25.8 -- 9.4 -- 11.6 5.3 Arizona 89.4 -- 15.3 -- 23.5 20.4 California 24.8 -- 7.8 -- 15.8 17.0 Colorado 29.9 -- 10.6 -- 23.2 21.3 Hawaii 27.3 -- 11.5 -- 14.9 23.3 Idaho 34.2 -- 9.7 -- 19.4 16.9 Montana 34.0 -- 10.1 -- 21.8 22.4 Nevada 36.9 -- 10.2 -- 14.1 15.8 New Mexico 43.1 -- 12.4 -- 22.9 22.9 Oregon 31.3 -- 10.0 -- 20.4 21.5 Utah 23.9 -- 10.3 -- 18.0 18.8 Washington 28.4 -- 9.7 -- 16.2 18.2 Wyoming 34.5 -- 7.9 -- 14.3 17.2 -------------------------------------------------------------------------------------------------------- * Per 1,000,000 population, age-adjusted to the U.S. 1970 population. + International Classification of Diseases (ICD), Seventh Revision: 1960-1967; ICD, Eighth Revision (Adapted): 1968-1978; ICD, Ninth Revision: 1979-1995. & Rates are not reported for these year groupings because they cross ICD classifications. @ For 1962 and 1963, the number of deaths among whites was estimated. ======================================================================================================== Return to top. Table_12 Note: To print large tables and graphs users may have to change their printer settings to landscape and use a small font size. TABLE 12. Rates* of deaths for asthma as the underlying cause of death among blacks, by year, region, and state+ -- United States, Underlying Cause of Death dataset, 1960-1995 ============================================================================================================ Region/State 1960-1965&** 1966-1971@ 1972-1977** 1978-1983@ 1984-1989** 1990-1995 ------------------------------------------------------------------------------------------------------------ Northeast Connecticut 39.5 -- 16.1 -- 26.0 30.1 Massachusetts 52.9 -- 33.8 -- 32.2 36.4 New Jersey++ 34.4 -- 16.1 -- 29.1 36.1 New York 46.9 -- 24.7 -- 45.8 49.0 Pennsylvania 34.3 -- 15.1 -- 27.9 34.0 Midwest Illinois 28.0 -- 21.0 -- 45.4 60.8 Indiana 46.8 -- 12.0 -- 29.8 30.2 Kansas 56.4 -- 20.9 -- 42.5 23.2 Michigan 46.6 -- 18.0 -- 32.1 38.5 Missouri 53.7 -- 20.8 -- 31.3 41.1 Ohio 48.7 -- 15.9 -- 31.5 32.2 Wisconsin 44.6 -- 17.1 -- 29.5 48.5 South Alabama 31.1 -- 19.8 -- 26.0 26.5 Arkansas 33.8 -- 7.9 -- 30.1 45.0 Delaware 11.9 -- 21.1 -- 30.8 19.2 District of Columbia 51.7 -- 18.8 -- 34.3 44.9 Florida 58.6 -- 25.5 -- 28.5 30.4 Georgia 39.3 -- 19.3 -- 36.5 30.9 Kentucky 44.3 -- 23.2 -- 20.0 32.8 Louisiana 47.0 -- 21.0 -- 32.9 35.0 Maryland 45.3 -- 17.3 -- 23.5 25.6 Mississippi 30.8 -- 13.1 -- 27.6 32.2 North Carolina 32.2 -- 20.7 -- 30.2 31.7 Oklahoma 61.8 -- 12.4 -- 26.6 29.4 South Carolina 20.6 -- 14.1 -- 30.7 31.0 Tennessee 49.6 -- 20.2 -- 29.6 32.8 Texas 39.9 -- 14.8 -- 25.1 32.9 Virginia 42.4 -- 22.6 -- 26.4 36.7 West Virginia 46.2 -- 24.8 -- 12.0 26.3 West Arizona 104.1 -- 20.4 -- 39.4 40.6 California 40.3 -- 18.1 -- 37.9 36.6 Colorado 84.7 -- 17.2 -- 58.8 50.6 Washington 34.6 -- 13.9 -- 34.0 42.0 ------------------------------------------------------------------------------------------------------------ * Per 1,000,000 population, age-adjusted to the 1970 U.S. population. + Includes only data from states in which two or more asthma deaths occurred among blacks annually. & For 1960 and 1961, the number of deaths among blacks was estimated for all states. @ Rates are not reported for these year groupings because they cross ICD classifications. ** International Classification of Diseases (ICD), Seventh Revision: 1960-1967; ICD, Eighth Revision (Adapted): 1968-1978; ICD, Ninth Revision: 1979-1995. ++ For 1962 and 1963, the number of deaths among blacks was estimated. ============================================================================================================ Return to top. Figure_1 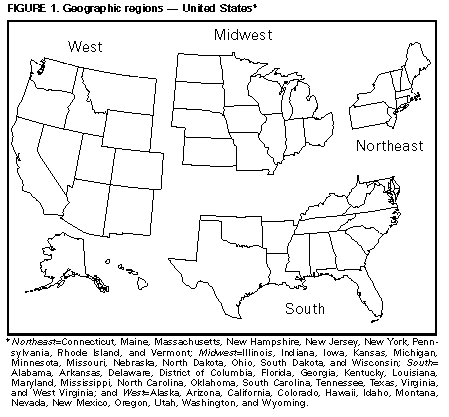 Return to top. Figure_2 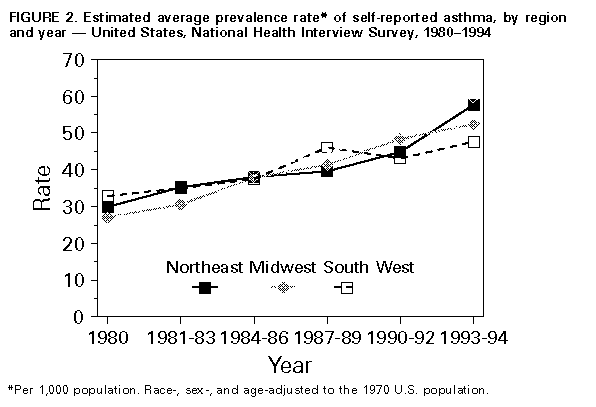 Return to top. Figure_3 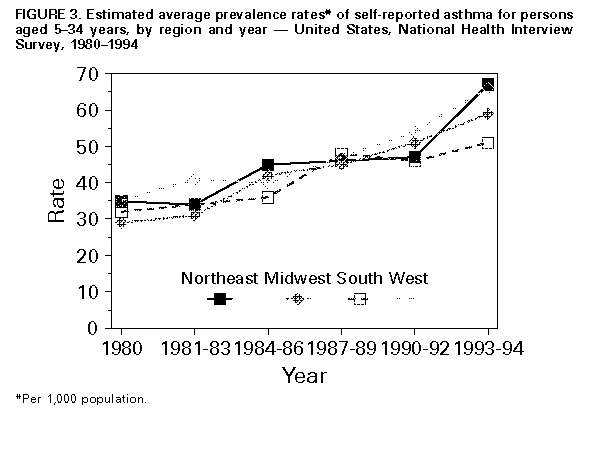 Return to top. Figure_6 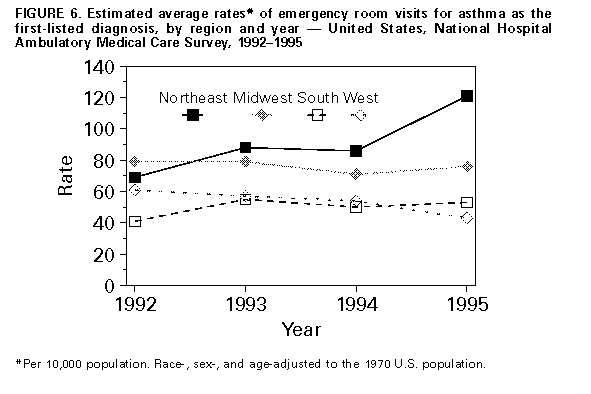 Return to top. Figure_7 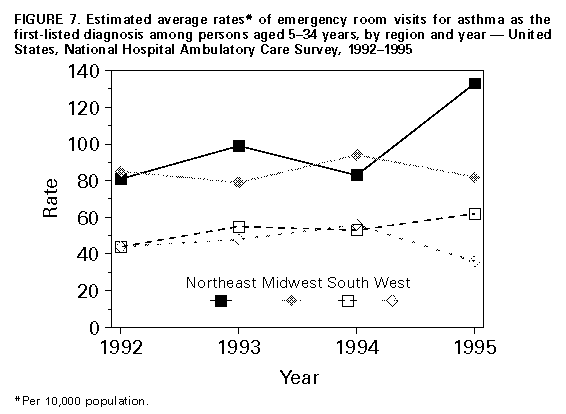 Return to top. Figure_8 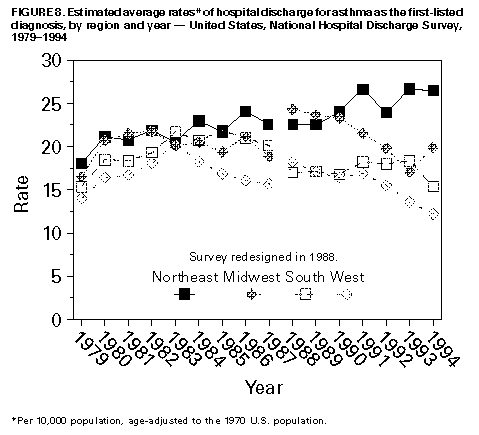 Return to top. Figure_9 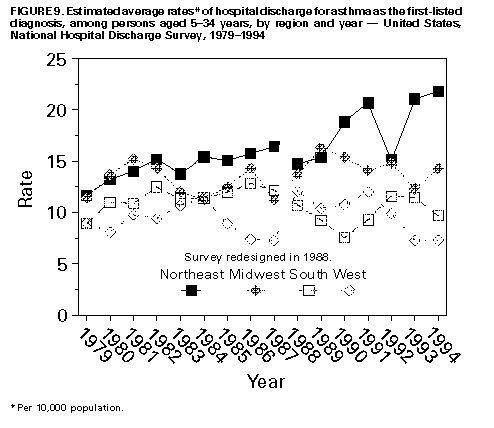 Return to top. Figure_10 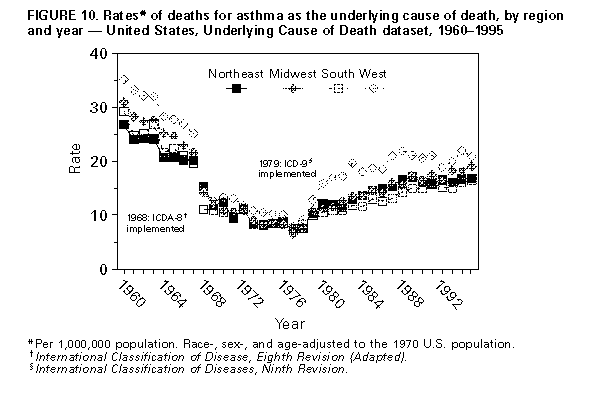 Return to top. Figure_11 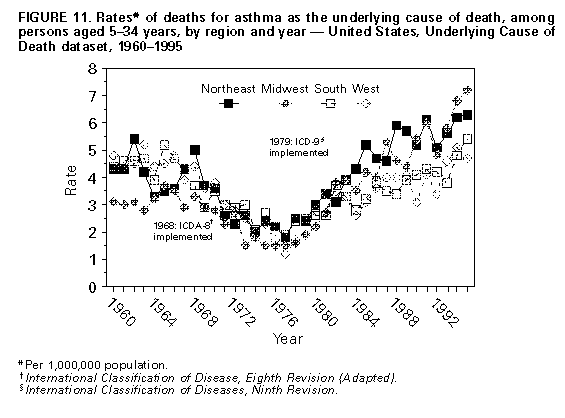 Return to top. Figure_4 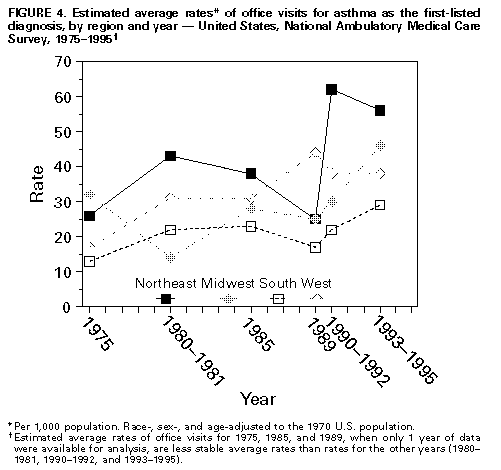 Return to top. Figure_5 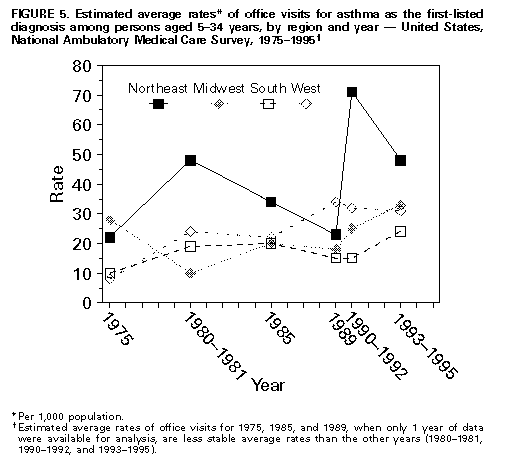 Return to top. Disclaimer All MMWR HTML versions of articles are electronic conversions from ASCII text into HTML. This conversion may have resulted in character translation or format errors in the HTML version. Users should not rely on this HTML document, but are referred to the electronic PDF version and/or the original MMWR paper copy for the official text, figures, and tables. An original paper copy of this issue can be obtained from the Superintendent of Documents, U.S. Government Printing Office (GPO), Washington, DC 20402-9371; telephone: (202) 512-1800. Contact GPO for current prices. **Questions or messages regarding errors in formatting should be addressed to mmwrq@cdc.gov.Page converted: 10/05/98 |
|||||||||
This page last reviewed 5/2/01
|