Skip Navigation LinksSkip Navigation Links
Centers for Disease Control and Prevention
Safer Healthier People
Blue White
Blue White
bottom curve
CDC Home Search Health Topics A-Z spacer spacer
spacer
Blue curve MMWR spacer
spacer
spacer

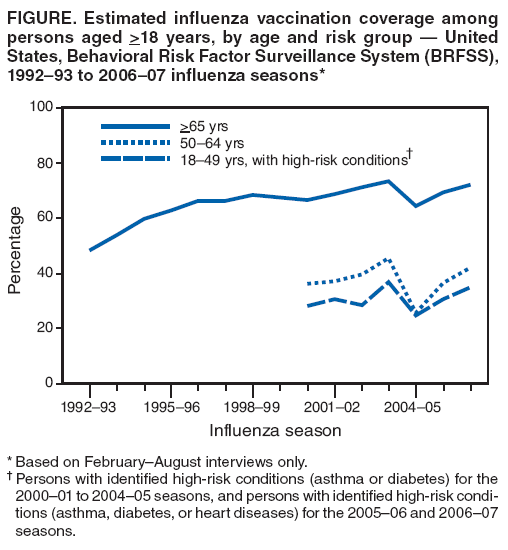
Persons using assistive technology might not be able to fully access information in this file. For assistance, please send e-mail to: mmwrq@cdc.gov. Type 508 Accommodation and the title of the report in the subject line of e-mail.

State-Specific Influenza Vaccination Coverage Among Adults --- United States, 2006--07 Influenza Season

Adult groups included in the 2008 Advisory Committee on Immunization Practices (ACIP) recommendation (1) for annual influenza vaccination include all persons aged >50 years, women who will be pregnant during the influenza season, persons aged 18--49 years with high-risk conditions,* and other persons at increased risk for complications from influenza. Health-care personnel and household contacts and caregivers of persons at high risk also should receive annual influenza vaccination, as should adults who want to reduce their risk for becoming ill with influenza or for transmitting it to others. Healthy People 2010 influenza vaccination coverage targets are 90% among all persons aged >65 years and 60% among persons aged 18--64 years who have one or more high-risk conditions (2). Data from the 2006 and 2007 Behavioral Risk Factor Surveillance System (BRFSS) surveys indicate that influenza vaccination coverage among adults for the 2006--07 season increased significantly compared with the 2005--06 season, reaching 35.1% among persons aged 18--49 years with high-risk conditions, 42.0% among all persons aged 50--64 years, and 72.1% among all persons aged >65 years. However, vaccination coverage remained well below Healthy People 2010 targets. Increasing influenza vaccination coverage among adults in the United States will require more cooperation among health-care providers, professional organizations, vaccine manufacturers, and public health departments to raise public awareness about influenza vaccination and to ensure continued distribution and administration of available vaccine throughout the vaccination season.

BRFSS is an ongoing, annual state-based telephone survey that collects information from approximately 400,000 randomly selected noninstitutionalized U.S. civilian adults aged >18 years on health risk behaviors, preventive health practices, and health-care use. Data are collected monthly in all 50 states, the District of Columbia, Puerto Rico, the U.S. Virgin Islands, and Guam, and weighted by age, sex, and race/ethnicity to reflect each area's adult population. To determine influenza vaccination coverage, respondents were asked, "During the past 12 months, have you had a flu shot?" and "During the past 12 months, have you had a flu vaccine that was sprayed in your nose?" Each year, BRFSS also solicits information regarding identified high-risk conditions; influenza-related high-risk conditions in the 2006 and 2007 surveys were diabetes, asthma, myocardial infarction, and coronary heart disease. To better approximate vaccination coverage, analysis was restricted to respondents interviewed during February--August of each survey year, thereby excluding vaccinations received during previous and subsequent seasons. The median state response rate, based on guidelines set by the Council of American Survey and Research Organization (CASRO), was 50.6% (range: 26.9%--65.4%) in 2007 and 51.4% (range: 35.1%--66.0%) in 2006. Unweighted sample sizes from the interviews conducted during February--August were 249,336 in 2007 and 210,335 in 2006. Respondents who reported unknown influenza vaccination status (0.42% in 2007 and 0.46% in 2006) were excluded from the analysis. T-tests were performed to test the percentage-point significant differences (p<0.05) among racial/ethnic populations and between influenza seasons.

Among adults aged 18--49 years, influenza vaccination coverage for the 2006--07 season was 35.1% among persons with identified high-risk conditions and 23.4% among those without these conditions. Coverage among persons with identified high-risk conditions was significantly higher for non-Hispanic whites (37.1%, 95% confidence interval [CI] = ±1.7) compared with the other racial/ethnic groups combined (31.6%, CI = ±3.1). Among these other racial/ethnic groups, coverage was 34.0% (CI = ±4.9) for non-Hispanic blacks, 36.5% (CI = ±13.6) for Asians, 43.9% (CI = ±10.0) for American Indians/Alaska Natives, and 28.2% (CI = ±4.9) for Hispanics. Coverage among those with identified high-risk conditions ranged from 22.3% in Florida to 54.0% in Tennessee (median: 37.6%) (Table 1). The median change in vaccination coverage among states and areas from the 2005--06 to 2006--07 seasons among persons aged 18--49 years with identified high-risk conditions was 6.2 percentage points (range: -5.3 to 22.0) (Table 2). Vaccination coverage increased significantly in four of the nine regions§ and 11 states or areas.

Among adults aged 50--64 years, influenza vaccination coverage during the 2006--07 season was 42.0%, ranging from 34.0% in Florida to 53.7% in Minnesota (median: 43.6%) (Table 1). Coverage among those with identified high-risk conditions was 54.2% (CI = ±1.4) and 37.9% (CI = ±0.8) among those without these conditions. Coverage was significantly higher for non-Hispanic whites (44.1%, CI = ±0.6) compared with other racial/ethnic groups (35.8%, CI = ±1.9). Among these other racial/ethnic groups, coverage was 35.2% (CI = ±2.3) for non-Hispanic blacks, 39.5% (CI = ±8.4) for Asians, 43.6% (CI = ±6.8) for American Indians/Alaska Natives, and 34.0% (CI = ±3.4) for Hispanics. Among states and areas, the median percentage-point difference in vaccination coverage from 2005--06 to 2006--07 among persons aged 50--64 years with identified high-risk conditions was 4.8 (range: -11.4 to 18.4) and among those without these conditions was 4.9 (range: -3.8 to 10.8) (Table 2).

Among adults aged >65 years, influenza vaccination coverage was 72.1% for the 2006--07 season, ranging from 60.8% (Nevada) to 81.0% (Rhode Island) (median: 73.3%) (Table 1). Coverage was significantly higher for non-Hispanic whites (74.2%) compared with other racial/ethnic groups (63.2%) as a whole. Coverage was 57.1% (CI = ±2.9) for non-Hispanic blacks, 83.3% (CI = ±8.8) for Asians, 63.1% (CI = ±7.4) for American Indians/Alaska Natives, and 61.4% (CI = ±4.9) for Hispanics. Compared with the 2005--06 season, the greatest racial/ethnic percentage-point increase was seen among Asians (19.3), with a smaller increase (2.3) among whites (3). Overall, among states and areas, the median percentage-point difference in vaccination coverage from 2005--06 to 2006--07 among persons aged >65 years was 2.7 (range: -2.8--9.2). Increases in coverage were statistically significant in four regions and 13 states (Table 2).

Influenza vaccination coverage has trended upward since the 1992--93 season, except for a drop in 2004--05 caused by an influenza vaccine shortage (4). By the 2006--07 season, coverage had nearly returned to 2003--04 levels (Figure). Among adults aged 50--64 years without identified high-risk conditions, 2006--07 vaccination coverage increased 16.1 percentage points over the 2004--05 level, but was still 4.6 percentage points below the 2003--04 level. In comparison, vaccination coverage for adults >65 years had increased to within 1.4 percentage points of the 2003--04 level, and coverage for adults aged 18--49 years with identified high-risk conditions was 1.7 percentage points below the 2003--04 level.

Reported by: PJ Lu, PhD, GL Euler, DrPH, GT Mootrey, DO, F Ahmed, MD, PhD, KG Wooten, MA, Immunization Svc Div, National Center for Immunization and Respiratory Diseases, CDC.

Editorial Note:

Compared with the previous season, influenza vaccination coverage significantly increased during the 2006--07 season among all adult groups for whom vaccination is recommended, but has not yet matched 2003--04 season coverage nor achieved the Healthy People 2010 target of 60% for persons aged 18--64 years with high-risk conditions and 90% for persons aged >65 years.

During the 2004--05 season, one influenza vaccine manufacturer was unable to supply any vaccine to the United States, which reduced the expected supply of trivalent inactivated influenza vaccine by nearly half. In response to the shortage, CDC recommended that healthy persons aged 50--64 years without high-risk conditions not be a priority group for influenza vaccination during that season. Compared with the 2003--04 season, influenza vaccination coverage levels declined by approximately half in this group, to 21.8%; however, coverage also declined among adults for whom vaccination continued to be recommended during the shortage season. During the 2005--06 season, the vaccine supply was adequate, but distribution of vaccine from one manufacturer was delayed, and vaccination coverage only partially rebounded. During the 2006--07 season, the vaccine supply was sufficient, distribution was not delayed, and vaccination coverage further increased to levels nearly equal to those achieved before the shortage. However, the coverage rebound for persons aged 50--64 years without high-risk conditions was weaker than for other groups. Targeted communications efforts might be appropriate for persons in this population group who might believe they are not recommended for vaccination (and their health-care providers).

The gap in vaccination coverage between whites and other racial/ethnic groups remained essentially the same for the 2005--06 and 2006--07 seasons, except for Asians, for whom the racial/ethnic gap was eliminated. Veterans Administration clinics also eliminated racial/ethnic disparities in influenza vaccination among older adults by using multimodal programs. These include standing orders, patient reminders, freestanding vaccination clinics, assessment of vaccination rates with feedback, and incentives to clinicians to improve influenza vaccination coverage (5).

NHIS results for the two most recent influenza seasons indicate that approximately 84% of all influenza vaccinations were administered during September--November (6). Health-care providers, health departments, and community vaccinators should offer influenza vaccine routinely as soon as it is available and throughout the entire influenza season.

CDC compared the results with estimates from the 2007 National Health Interview Survey (NHIS). NHIS is a national household survey conducted annually with a face-to-face interview method. Estimated influenza vaccination coverage from the 2007 NHIS was lower than that from BRFSS for all age groups examined (i.e., 25.5% among persons aged 18--49 years with high-risk conditions, 36.0% among persons aged 50--64 years, and 65.6% among persons aged >65 years) (1). The NHIS estimates, all lower than the BRFSS estimates in this report, might reflect the fact that BRFSS is limited to landline telephones. NHIS data indicate that persons with landline telephones have higher influenza vaccination rates than persons living in households without landline telephones (1,7).

The findings in this report are subject to at least three other limitations. First, self-reported influenza vaccination status is subject to recall bias. Second, persons with certain high-risk conditions (e.g., emphysema, bronchitis, cancer, kidney diseases, and neurologic conditions that impair lung function) identified by ACIP were not ascertained by the survey. Finally, sample sizes for blacks and Hispanics were relatively small, which limited comparisons by age and racial/ethnic groups at state levels.

To further increase influenza vaccination coverage among all adults, health-care providers should recommend influenza vaccination in accordance with ACIP recommendations throughout the influenza season. Standing orders for vaccination should be implemented in various settings, and reminder and recall systems for patients and providers should be incorporated into medical practices and facilities that routinely provide vaccinations to adults (8--10).

References

  1. CDC. Prevention and control of influenza: Recommendations of the Advisory Committee on Immunization Practices (ACIP). MMWR 2008;57(No. RR-7).
  2. US Department of Health and Human Services. Healthy people 2010 (conference ed., in 2 vols). Washington, DC: US Department of Health and Human Services; 2000. Available at http://www.health.gov/healthypeople.
  3. CDC. State-specific influenza vaccination coverage among adults aged >18 years---United States, 2003--04 and 2005--06 influenza seasons. MMWR 2007;56:953--9.
  4. CDC. Estimated influenza vaccination coverage among adults and children---United States, September 1--November 30, 2004. MMWR 2004;53:1147--53.
  5. Zimmerman RK, Santibanez TA, Janosky JE, et al. What affects influenza vaccination rates among older patients? An analysis from inner-city, suburban, rural, and Veterans Affairs practices. Am J Med 2003;114:31--8.
  6. CDC. National Influenza Vaccination Week---November 26--December 2, 2007. MMWR 2007;56:1216--7.
  7. Blumberg SJ, Luke JV, Cynamon ML. Telephone coverage and health survey estimates: evaluating the need for concern about wireless substitution. Am J Public Health 2006;96:926--31.
  8. Lindley MC, Wortley PM, Winston CA, et al. The role of attitudes in understanding disparities in adult influenza vaccination. Am J Prev Med 2006;31:281--5.
  9. Task Force on Community Preventive Services. The guide to community preventive services. What works to promote health? New York, NY: Oxford University Press; 2005:233--303.
  10. Poland GA, Shefer AM, McCauley M, et al. Standards for adult immunization practices. Am J Prev Med 2003;25:144--50.

* High-risk conditions include chronic pulmonary, cardiovascular, renal, hepatic, hematologic, or metabolic disorders; immunosuppression; cognitive dysfunction; spinal cord injuries; seizure disorders; and other neuromuscular disorders.

2006 and 2007 BRFSS summary data quality reports, available at http://www.cdc.gov/brfss/technical_infodata/quality.htm.

§ The nine regions (which are identical to the nine divisions of the U.S. census) are New England (Connecticut, Maine, Massachusetts, New Hampshire, Rhode Island, and Vermont); Mid-Atlantic (New Jersey, New York, and Pennsylvania); East North Central (Illinois, Indiana, Michigan, Ohio, and Wisconsin); West North Central (Iowa, Kansas, Minnesota, Missouri, Nebraska, North Dakota, and South Dakota); South Atlantic (Delaware, District of Columbia, Florida, Georgia, Maryland, North Carolina, South Carolina, Virginia, and West Virginia); East South Central (Alabama, Kentucky, Mississippi, and Tennessee); West South Central (Arkansas, Louisiana, Oklahoma, and Texas); Mountain (Arizona, Colorado, Idaho, Montana, Nevada, New Mexico, Utah, and Wyoming); and Pacific (Alaska, California, Hawaii, Oregon, and Washington).

Information available at http://www.cdc.gov/mmwr/preview/mmwrhtml/mm5350a7.htm.

Table 1

TABLE 1. Estimated self-reported influenza vaccination coverage in the 2006–07 influenza season* among adults aged >18 years by region, state/area, and selected age, risk and racial/ethnic subgroups — United States, Behavioral Risk Factor Surveillance System (BRFSS), 2007†
Age, risk, and racial/ethnic subgroup
Region and
state/area
Persons aged
18–49 yrs
at high risk§
Other
persons aged 18–49 yrs
All
persons aged
50–64 yrs
All persons
aged >65 yrs
Non-Hispanic
whites
aged >65 yrs
Persons of all other racial/ethnic groups
aged >65 yrs
%
(95% CI¶)
%
(95% CI)
%
(95% CI)
%
(95% CI)
%
(95% CI)
%
(95% CI)
All states
combined**
35.1
(±1.6)
23.4
(±0.6)
42.0
(±0.7)
72.1
(±0.7)
74.2
(±0.6)
63.2
(±2.3)††
New England
40.4
(±3.6)
24.9
(±1.3)
46.4
(±1.5)
78.2
(±1.2)
78.8
(±1.2)
72.6
(±4.9)††
Connecticut
41.3
(±10.4)
22.7
(±3.0)
46.6
(±3.6)
76.8
(±2.8)
77.5
(±2.9)
70.1
(±10.1)
Maine
38.5
(±8.2)
22.9
(±3.0)
49.1
(±3.1)
77.6
(±2.9)
77.3
(±3.0)
80.9
(±11.7)
Massachusetts
38.6
(±5.3)
26.0
(±2.0)
45.6
(±2.4)
78.8
(±1.8)
79.4
(±1.8)
73.6
(±7.2)
New Hampshire
45.7
(±8.6)
24.7
(±3.0)
45.5
(±3.4)
78.0
(±3.0)
78.5
(±3.1)
70.0
(±15.4)
Rhode Island
42.0
(±10.5)
29.1
(±4.1)
49.7
(±4.2)
81.0
(±3.1)
82.0
(±3.1)
67.9
(±13.6)††
Vermont
43.4
(±8.2)
20.9
(±2.6)
43.1
(±2.9)
76.9
(±2.7)
77.3
(±2.8)
67.9
(±13.9)
Mid-Atlantic
39.3
(±5.1)
22.0
(±1.8)
41.3
(±2.1)
72.5
(±1.9)
74.3
(±1.8)
65.1
(±6.0)††
New Jersey
38.2
(±8.6)
21.1
(±3.0)
40.6
(±4.0)
71.8
(±3.3)
73.2
(±3.4)
67.3
(±9.0)
New York
34.7
(±7.7)
20.8
(±2.8)
40.6
(±3.4)
71.7
(±3.3)
74.0
(±3.1)
64.6
(±9.1)
Pennsylvania
45.4
(±9.0)
24.5
(±3.0)
42.7
(±3.2)
74.1
(±2.6)
75.1
(±2.7)
64.0
(±9.9)††
East North
Central
35.0
(±3.8)
22.6
(±1.3)
42.8
(±1.6)
72.3
(±1.4)
74.2
(±1.4)
60.8
(±5.0)††
Illinois
31.9
(±9.2)
22.0
(±3.2)
41.0
(±3.7)
69.9
(±3.5)
74.1
(±3.3)
52.3
(±10.6)††
Indiana
35.7
(±8.4)
25.0
(±3.1)
46.4
(±3.7)
73.0
(±3.4)
73.9
(±3.6)
64.3
(±11.1)
Michigan
34.9
(±6.8)
22.4
(±2.6)
43.5
(±2.8)
71.1
(±2.6)
72.2
(±2.8)
64.6
(±7.7)
Ohio
33.4
(±7.5)
20.0
(±2.4)
40.6
(±2.9)
74.0
(±2.7)
75.3
(±2.8)
65.1
(±8.5)††
Wisconsin
43.7
(±11.0)
25.4
(±3.1)
45.2
(±3.8)
76.0
(±3.5)
76.1
(±3.7)
74.4
(±10.7)
West North
Central
36.1
(±4.4)
27.3
(±1.5)
47.2
(±1.8)
75.5
(±1.6)
76.2
(±1.6)
63.8
(±8.0)††
Iowa
43.4
(±11.5)
29.7
(±3.3)
52.6
(±3.6)
76.5
(±3.0)
76.8
(±3.0)
— §§
— §§
Kansas
37.6
(±7.3)
23.1
(±2.6)
42.0
(±2.7)
74.2
(±2.4)
74.6
(±2.5)
68.6
(±10.0)
Minnesota
38.3
(±12.1)
30.1
(±3.6)
53.7
(±3.9)
80.9
(±2.9)
81.3
(±2.9)
— §§
— §§
Missouri
30.0
(±8.7)
23.3
(±3.4)
39.5
(±4.5)
69.9
(±4.4)
71.1
(±4.6)
59.8
(±13.6)
Nebraska
35.2
(±10.8)
30.8
(±3.9)
52.6
(±4.0)
78.3
(±3.0)
78.3
(±3.1)
78.4
(±10.9)
North Dakota
33.3
(±10.4)
26.8
(±3.5)
43.3
(±3.7)
73.0
(±3.6)
73.6
(±3.6)
59.8
(±17.6)
South Dakota
45.3
(±10.6)
35.9
(±3.5)
52.3
(±3.2)
77.9
(±2.5)
78.0
(±2.6)
75.4
(±10.0)
South Atlantic
31.8
(±2.7)
22.9
(±1.1)
41.5
(±1.3)
68.8
(±1.2)
72.8
(±1.2)
53.9
(±3.4)††
Delaware
37.4
(±10.4)
27.5
(±4.1)
44.8
(±5.0)
74.7
(±4.6)
76.7
(±4.7)
62.5
(±14.4)
District of
Columbia
45.7
(±10.4)
32.8
(±3.9)
43.3
(±4.7)
62.8
(±5.4)
74.9
(±6.2)
58.1
(±6.9)††
Florida
22.3
(±5.1)
17.5
(±2.0)
34.0
(±2.5)
63.7
(±2.4)
68.3
(±2.3)
45.5
(±6.6)††
Georgia
30.6
(±6.6)
22.8
(±2.8)
40.1
(±3.1)
68.6
(±3.4)
73.5
(±3.1)
56.0
(±8.5)††
Maryland
40.1
(±7.3)
25.5
(±2.7)
45.3
(±3.5)
71.8
(±3.4)
75.2
(±3.3)
61.5
(±9.0)††
North Carolina
39.3
(±6.8)
25.1
(±2.2)
46.6
(±2.5)
72.6
(±2.3)
76.1
(±2.2)
59.5
(±6.6)††
South Carolina
29.3
(±6.9)
21.9
(±2.3)
42.1
(±2.7)
69.6
(±2.7)
74.5
(±2.8)
56.6
(±6.5)††
Virgina
35.4
(±9.5)
29.3
(±3.8)
50.2
(±4.3)
76.5
(±3.8)
78.6
(±4.0)
62.1
(±11.3)
West Virgina
34.2
(±8.8)
22.8
(±3.2)
43.7
(±3.6)
73.2
(±3.5)
73.7
(±3.5)
64.5
(±18.4)
East South
Central
41.6
(±6.2)
25.5
(±1.9)
45.5
(±2.0)
71.8
(±1.8)
73.6
(±2.0)
61.7
(±4.9)††
Alabama
34.4
(±9.2)
25.5
(±3.3)
43.4
(±3.5)
71.0
(±3.3)
72.8
(±3.6)
64.5
(±7.6)
Kentucky
33.4
(±8.6)
21.3
(±3.3)
46.7
(±3.9)
73.9
(±3.2)
76.0
(±3.1)
49.6
(±15.3)††
Mississippi
33.1
(±9.9)
25.5
(±3.1)
40.5
(±3.3)
71.4
(±2.9)
76.0
(±3.1)
59.3
(±6.6)††
Tennessee
54.0
(±11.9)
28.8
(±4.1)
47.4
(±4.1)
71.0
(±3.9)
71.4
(±4.1)
67.0
(±13.1)
West South
Central
35.2
(±4.0)
26.6
(±1.5)
42.5
(±1.8)
70.8
(±1.7)
74.6
(±1.6)
61.8
(±4.1)††
Arkansas
36.4
(±8.3)
27.3
(±3.5)
45.4
(±3.4)
75.0
(±2.9)
77.1
(±2.9)
58.6
(±9.8)††
Louisiana
36.9
(±8.5)
28.8
(±3.1)
43.3
(±3.2)
70.2
(±3.4)
71.2
(±3.8)
67.3
(±7.3)
Oklahoma
38.5
(±7.3)
27.5
(±2.7)
47.6
(±3.2)
77.1
(±2.6)
79.3
(±2.6)
69.0
(±7.4)††
Texas
34.1
(±5.6)
26.0
(±2.1)
40.9
(±2.5)
69.0
(±2.5)
73.8
(±2.4)
59.9
(±5.4)††
See Table 1 footnotes on next page.

TABLE 1. (Continued) Estimated self-reported influenza vaccination coverage in the 2006–07 influenza season among adults aged >18 years by region, state/area, and selected age, risk and racial/ethnic subgroups — United States, Behavioral Risk Factor Surveillance System (BRFSS), 2007
Age, risk, and racial/ethnic subgroup
Region and
state/area
Persons aged
18–49 yrs
at high risk
Other
persons aged 18–49 yrs
All
persons aged
50–64 yrs
All persons
aged >65 yrs
Non-Hispanic
whites
aged >65 yrs
Persons of all other racial/ethnic groups
aged >65 yrs
%
(95% CI)
%
(95% CI)
%
(95% CI)
%
(95% CI)
%
(95% CI)
%
(95% CI)
Mountain
37.2
(±5.1)
24.3
(±1.6)
41.5
(±2.0)
71.6
(±1.9)
72.4
(±2.0)
67.5
(±5.3)
Arizona
32.7
(±13.0)
20.8
(±4.7)
37.5
(±5.6)
71.1
(±5.1)
72.1
(±5.3)
64.4
(±15.0)
Colorado
40.9
(±6.2)
28.6
(±2.1)
46.5
(±2.3)
77.4
(±2.3)
78.0
(±2.4)
74.6
(±7.2)
Idaho
38.0
(±10.7)
19.4
(±3.0)
39.2
(±3.8)
69.5
(±3.7)
70.1
(±3.7)
59.5
(±16.8)
Montana
39.7
(±11.0)
27.8
(±3.8)
45.0
(±3.5)
73.1
(±3.3)
73.0
(±3.5)
75.2
(±10.9)
Nevada
32.7
(±13.5)
22.5
(±4.3)
34.1
(±4.8)
60.8
(±5.5)
61.7
(±6.0)
57.1
(±13.5)
New Mexico
44.9
(±10.1)
22.4
(±2.8)
43.1
(±3.5)
70.8
(±3.3)
71.3
(±3.9)
69.7
(±6.1)
Utah
38.5
(±9.2)
27.9
(±3.2)
47.7
(±4.2)
75.6
(±3.9)
75.8
(±4.0)
72.6
(±17.1)
Wyoming
35.8
(±8.0)
25.3
(±3.0)
45.8
(±2.9)
77.0
(±2.8)
76.6
(±2.9)
82.0
(±9.1)
Pacific
28.2
(±5.8)
20.2
(±2.1)
37.1
(±2.9)
73.7
(±3.1)
73.9
(±2.7)
73.0
(±7.9)
Alaska
40.4
(±15.5)
25.7
(±4.7)
41.4
(±7.2)
62.8
(±10.5)
64.3
(±11.1)
58.4
(±24.5)
California
24.2
(±7.8)
18.6
(±2.8)
34.4
(±4.1)
73.3
(±4.4)
73.4
(±4.3)
73.0
(±9.3)
Hawaii
43.1
(±10.5)
31.4
(±3.3)
47.9
(±3.7)
78.6
(±3.5)
78.2
(±5.6)
78.8
(±4.3)
Oregon
42.8
(±11.1)
21.7
(±3.3)
40.4
(±3.5)
74.9
(±3.3)
75.8
(±3.3)
62.6
(±14.8)
Washington
33.6
(±4.3)
24.1
(±1.6)
43.6
(±1.7)
74.2
(±1.5)
74.5
(±1.6)
70.2
(±6.2)
U.S. territories
21.7
(±8.2)
12.0
(±2.4)
16.3
(±3.0)
33.1
(±3.7)
— §§
— §§
33.0
(±3.8)
Guam
— §§
— §§
32.4
(±7.7)
43.7
(±11.6)
69.6
(±15.2)
— §§
— §§
70.5
(±15.7)
Puerto Rico
21.5
(±8.7)
11.0
(±2.5)
15.1
(±3.1)
32.1
(±3.8)
— §§
— §§
32.2
(±3.8)
U.S. Virgin
Islands
15.4
(±8.8)
16.8
(±3.5)
21.1
(±4.5)
41.9
(±7.6)
67.7
(±13.8)
34.2
(±8.5)††
Median**
37.6
25.1
43.6
73.3
75.1
64.6
Range**
22.3–54.0
17.5–35.9
34.0–53.7
60.8–81.0
61.7–82.0
45.5–82.0
* Coverage estimates are for persons interviewed during February–August.
† Percentages are weighted.
§ Each year BRFSS solicits information regarding identified high-risk conditions for serious complications after influenza infection. In the 2007 survey, those conditions were diabetes, asthma, myocardial infarction, and coronary heart disease.
¶ Confidence interval.
** Excludes U.S. territories.
†† p<0.05. Percentage-point difference between non-Hispanic white persons and persons of all other racial/ethnic groups is statistically significant.
§§ Sample size is insufficient for analysis (sample size <30 or relative standard error >0.3).
Return to top.
Table 2

TABLE 2. Percentage-point change in estimated self-reported influenza vaccination coverage from the 2005–06 influenza season to the 2006–07 season* among adults aged ≥18 years, by region, state/area, and selected age and risk groups — United States, Behavioral Risk Factor Surveillance System (BRFSS)
Region and state/area
Age and risk group
Persons aged 18–49 yrs
at high risk†
Other
persons aged
18–49 yrs
Persons aged 50–64 yrs
at high risk
Other
persons aged
50–64 yrs
All
persons
aged ≥65 yrs
All
persons
aged ≥18 yrs
All states combined§
4.6¶
5.1¶
5.4¶
5.5¶
2.8¶
5.2¶
New England
5.4¶
4.4¶
-0.6
6.5¶
3.5¶
5.0¶
Connecticut
8.6¶
1.4
1.1
6.3¶
4.1
3.9
Maine
6.1
3.9¶
11.9
6.8¶
2.6
5.6¶
Massachusetts
3.1
6.2¶
-5.4¶
6.9¶
3.4
5.8¶
New Hampshire
11.4
4.7¶
5.5
5.1
5.4¶
6.0¶
Rhode Island
-1.0
3.9
-8.2¶
7.5¶
2.2
3.0
Vermont
13.2¶
2.2¶
9.8¶
3.6¶
2.8¶
3.9
Mid-Atlantic
6.9¶
3.3¶
-1.0
7.2¶
3.6¶
5.0¶
New Jersey
10.9¶
4.7¶
0.6
10.0¶
3.9
6.6¶
New York
2.6
1.0
-4.2
5.2¶
2.3
3.0
Pennsylvania
9.6¶
5.8¶
4.0
8.3¶
4.8¶
6.7¶
East North Central
5.1
5.7¶
10.1¶
5.6¶
2.4
5.5¶
Illinois
2.8
7.9¶
14.4¶
10.8¶
1.1
7.9¶
Indiana
8.5
7.2¶
2.9
10.0¶
5.7¶
7.4¶
Michigan
3.4
6.7¶
18.3¶
5.0¶
-0.3
5.8¶
Ohio
4.9
2.4
6.1
-0.1
4.9
2.4
Wisconsin
8.8
3.0
-1.1
6.0
2.0
4.1¶
West North Central
3.0
6.1¶
5.2
4.2
0.6
5.1¶
Iowa
12.8
6.9¶
7.8
8.1¶
0.0
7.1¶
Kansas
8.9¶
3.3¶
1.0
1.3
-0.5¶
2.9
Minnesota
1.7
6.6¶
14.2¶
8.2¶
4.0¶
7.6¶
Missouri
-1.5
6.7¶
-0.1
-1.0
-2.8
3.1
Nebraska
-5.3
6.8¶
18.4¶
7.4¶
3.0
6.3¶
North Dakota
3.1
0.0
4.9
2.4
-0.1
1.0
South Dakota
5.1
5.6¶
-0.1
2.9
2.7
3.9¶
South Atlantic
4.6
4.8¶
7.6¶
7.2¶
2.6
5.1¶
Delaware
-0.4
5.4¶
1.2
1.0
1.8
3.6
Dictrict of Columbia
12.8¶
10.6¶
4.8
3.0
4.4
7.8¶
Florida
0.7
5.7¶
10.6¶
9.8¶
0.6
5.4¶
Georgia
3.9
3.1
-1.6
7.6¶
3.0
3.7¶
Maryland
12.2
3.6
7.0
4.8
3.5¶
4.5
North Carolina
7.2
2.6
8.7¶
3.0
2.1
3.7¶
South Carolina
6.2
2.2
7.2
9.2¶
3.5
4.7¶
Virgina
2.6
7.6¶
11.4¶
6.8¶
6.1
7.4¶
West Virgina
3.0
6.5¶
4.1
-0.5
6.0¶
4.7
See Table 2 footnotes on next page.

TABLE 2. (Continued) Percentage-point change in estimated self-reported influenza vaccination coverage from the 2005–06 influenza season to the 2006–07 season* among adults aged ≥18 years, by region, state/area, and selected age and risk groups — United States, Behavioral Risk Factor Surveillance System (BRFSS)
Region and state/area
Age and risk group
Persons aged 18–49 yrs
at high risk†
Other
persons aged
18–49 yrs
Persons aged 50–64 yrs
at high risk
Other
persons aged
50–64 yrs
All
persons
aged ≥65 yrs
All
persons
aged ≥18 yrs
East South Central
12.9¶
4.6¶
11.6¶
4.8¶
4.4¶
5.9¶
Alabama
8.2
7.6¶
12.8¶
3.6
9.2¶
7.5¶
Kentucky
7.3
1.6
9.2¶
5.2
6.7¶
4.1
Mississippi
3.9
3.5
0.6
6.7¶
2.3
3.0¶
Tennessee
22.2¶
5.6¶
17.2¶
4.0
-0.1
7.3¶
West South Central
-3.1
7.0¶
3.5
4.8¶
2.4
5.7¶
Arkansas
8.6
6.1¶
14.5¶
-0.1
5.2¶
5.1
Louisiana
-4.9
4.4
3.0
6.6¶
3.0
4.0
Oklahoma
0.4
0.6
-2.2
3.8
2.9
1.6
Texas
-4.7
8.1¶
3.1
4.8¶
1.6
6.3¶
Mountain
10.7¶
4.7¶
-0.3
3.3
1.6
4.8¶
Arizona
12.5¶
6.1¶
-11.4
10.4¶
3.5
6.8¶
Colorado
5.2
4.8¶
6.0
-2.1
0.1
3.4
Idaho
15.0
3.3¶
5.7
2.2
4.3
4.6¶
Montana
9.5
4.2
5.4
1.8
-1.0
3.4¶
Nevada
13.4
4.4
6.6
2.2
1.9
4.7¶
New Mexico
12.3¶
2.1
12.4¶
4.4
0.3
3.7
Utah
14.8¶
4.8¶
3.5
2.4
2.2
5.5¶
Wyoming
8.4
1.5¶
4.0
5.0¶
2.2
3.1
Pacific
1.6
5.0¶
4.8
3.3
3.9¶
4.4¶
Alaska
8.6
2.4
-0.2
-3.9
-0.8
1.1
California
-0.3
4.8¶
4.7
2.4
4.5¶
3.9
Hawaii
3.6
2.9
-3.3
8.2
1.5
3.1
Oregon
12.5¶
4.4¶
5.0
3.0¶
3.5¶
5.0
Washington
1.5
5.9¶
2.7
5.3¶
1.8
5.0¶
U.S. territories**
3.7
-2.2
-3.7
3.4
-1.7
-0.9
Puerto Rico
3.5
-3.3
-4.9
2.4
-2.7
-1.8
U.S. Virgin Islands
-4.6
3.7¶
10.3¶
-0.1
2.7
2.6¶
Median§
6.2
4.6
4.8
4.9
2.7
4.6
Range§
-5.3–22.0
0.0–10.6
-11.4–18.4
-3.9–10.8
-2.8–9.2
1.0–7.9
* Coverage estimates are for persons interviewed during February–August.
† Each year BRFSS solicits information regarding identified high-risk conditions for serious complications after influenza infection. In the 2006 and 2007 surveys, those conditions were diabetes, asthma, myocardial infarction, and coronary heart disease.
§ Excludes U.S. territories.
¶ p<0.05. Percentage-point difference between influenza seasons is statistically significant.
** Guam did not report data in 2006.
Return to top.
Figure

FIGURE. Estimated influenza vaccination coverage among persons aged >18 years, by age and risk group — United States, Behavioral Risk Factor Surveillance System (BRFSS), 1992–93 to 2006–07 influenza seasons*
Return to top.

Use of trade names and commercial sources is for identification only and does not imply endorsement by the U.S. Department of Health and Human Services.


References to non-CDC sites on the Internet are provided as a service to MMWR readers and do not constitute or imply endorsement of these organizations or their programs by CDC or the U.S. Department of Health and Human Services. CDC is not responsible for the content of pages found at these sites. URL addresses listed in MMWR were current as of the date of publication.

All MMWR HTML versions of articles are electronic conversions from typeset documents. This conversion might result in character translation or format errors in the HTML version. Users are referred to the electronic PDF version (http://www.cdc.gov/mmwr) and/or the original MMWR paper copy for printable versions of official text, figures, and tables. An original paper copy of this issue can be obtained from the Superintendent of Documents, U.S. Government Printing Office (GPO), Washington, DC 20402-9371; telephone: (202) 512-1800. Contact GPO for current prices.

**Questions or messages regarding errors in formatting should be addressed to mmwrq@cdc.gov.

Date last reviewed: 9/25/2008

HOME  |  ABOUT MMWR  |  MMWR SEARCH  |  DOWNLOADS  |  RSSCONTACT
POLICY  |  DISCLAIMER  |  ACCESSIBILITY

Safer, Healthier People

Morbidity and Mortality Weekly Report
Centers for Disease Control and Prevention
1600 Clifton Rd, MailStop E-90, Atlanta, GA 30333, U.S.A

USA.GovDHHS

Department of Health
and Human Services