 |
|
|
|
|
|
|
| ||||||||||
|
|
|
|
|
|
|
||||
| ||||||||||
|
|
|
|
|
Persons using assistive technology might not be able to fully access information in this file. For assistance, please send e-mail to: mmwrq@cdc.gov. Type 508 Accommodation and the title of the report in the subject line of e-mail. Traumatic Brain Injury-Related Hospital DischargesResults from a 14-State Surveillance System, 1997Jean A. Langlois, Sc.D.1 AbstractProblem/Condition: Previous studies indicate that each year in the United States, approximately 1.5 million Americans sustain a traumatic brain injury (TBI). Of those injured, approximately one quarter million are hospitalized. Approximately one third of adults hospitalized with TBI still need help with daily activities 1 year after their discharge. Reporting Period: This report summarizes surveillance data for TBI in the United States for January--December 1997. Description of the System: Data are from 14 states that participated in an ongoing CDC-funded TBI surveillance system. State health departments used CDC guidelines to identify TBI cases from hospital discharge data or from other statewide injury data systems. Supplementary information was abstracted from medical records. Results: The overall age-adjusted TBI-related live hospital discharge rate was 69.7/100,000 population. Rates were highest for American Indians and Alaska Natives (75.3/100,000) and Blacks (74.4/100,000). The age-adjusted rate for males was approximately twice as high as for females (91.9 versus 47.7/100,000 respectively). For both sexes, the rates were highest among those aged 15--19 years and >65 years. Motor-vehicle crashes, falls, and assaults were the leading causes of injury for TBI-related discharges (27.9, 22.5, and 7.3/100,000 respectively). TBI-related discharge rates for falls were highest among those aged >65 years (82.3/100,000). Black males and American Indian/Alaska Native males had the highest rates of TBI attributable to assault (31.3 and 29.5 per 100,000, respectively), approximately 4 times the rate for white males. An estimated 46% of injured motor-vehicle occupants, 53% of motorcyclists, and 41% of pedal cyclists reportedly were not using personal protective equipment (PPE) (e.g., seat belts or helmets) at the time of their TBI. With regard to outcome assessed before discharge from the hospital, approximately 17% of persons hospitalized with TBI had moderate to severe disability. Interpretation: Data in this report, the most extensive to date from a multistate population-based TBI surveillance system, indicate the importance of TBI as a public health problem. Population-based information regarding TBI hospitalizations can be useful in assessing the effect of prevention efforts and planning for the service needs of persons with TBI. IntroductionApproximately 1.5 million Americans sustain a traumatic brain injury (TBI) each year (1). According to a recent estimate, of those injured, approximately one quarter million are hospitalized and survive (1), which is more than 20 times the number of hospitalizations each year for spinal cord injury (2), another key disabling injury. Unlike spinal cord injury, however, TBI is frequently referred to as the silent epidemic (3) because the problems that result from TBI (e.g., impaired memory) often are not visible. One year after discharge, approximately one third of adults hospitalized with TBI still need help from another person to perform daily activities (4). Estimated lifetime costs of TBI in the United States totaled approximately $56.3 billion in 1995 (5). In 1989, a task force convened by the U.S. Department of Health and Human Services recommended the establishment of TBI as a category in public health reporting systems (6). In response, CDC published Guidelines for Surveillance of Central Nervous System (CNS) Injury (7) and funded four states to apply these population-based TBI surveillance methods(8). In 1996, after the passage of Public Law 104-166, the Traumatic Brain Injury Act, and the appropriation of additional funds for TBI surveillance, 11 more states were funded for a total of 15 states. Unlike the National Hospital Discharge Survey, which uses information from a representative sample of hospitals in the United States (9), this multistate surveillance system includes information from nearly all civilian non-Indian Health Service hospitals, provides state-level data, and for the majority of states, includes supplementary information abstracted from hospital records. This is the first report of data from an ongoing multistate surveillance system to describe TBI-related hospital discharges. MethodsTBI-related hospital discharges from January 1, 1997, through December 31, 1997, were analyzed for this report. Data are from 14 states (Alaska, Arizona, California, Colorado, Louisiana, Maryland, Minnesota, Missouri, Nebraska, New York, Oklahoma, Rhode Island, South Carolina, and Utah) that were funded in 1997 to conduct TBI surveillance; four of these states (Colorado, Oklahoma, Missouri, and South Carolina) were first funded in September 1995 when the surveillance program was initiated. Eleven of the 14 states included in this report (Alaska, Arizona, California, Colorado, Maryland, Minnesota, Nebraska, New York, Oklahoma, South Carolina, and Utah) and one new state (New Jersey) are funded through September 2004. Data from another state were not included because of concerns regarding the completeness of case ascertainment for the year 1997. Because the focus of this report is on the public health importance of persons who are hospitalized and survive a TBI and because another recent report provides detailed information regarding TBI-related mortality (10), deaths, including those occurring in-hospital, were excluded from this report. Case IdentificationStates reported data from any source from which population-based data could be obtained and TBI cases could be identified according to one or both of the CDC TBI case definitions. The majority of states selected cases from administrative data sets (i.e., statewide uniform electronic hospital discharge data [HDD] sets). However, Missouri identified cases from a specific TBI reporting system in which hospitals are required by law to report directly to the state's registry system all TBI cases admitted to acute-care hospitals. Alaska identified cases from a trauma registry supplemented by hospital discharge data; Minnesota identified cases primarily from a specific TBI reporting system supplemented by hospital discharge data and trauma registry data; and Oklahoma's cases were identified from an ICD-9 code-based system in which hospital discharge data are reported directly to the state health department. Case DefinitionTBI was defined according to the Guidelines for Surveillance of Central Nervous System Injury (7). Specifically, cases identified from HDD were included if the patient was alive at discharge and one or more of the following diagnosis codes based on the International Classification of Diseases, Ninth Revision, Clinical Modification (ICD-9-CM) (11) were present in any of the diagnosis fields: codes 800.0--801.9 (fracture of the vault or base of the skull); codes 803.0--804.9 (other and unqualified multiple fractures of the skull); codes 850.0--854.1 (intracranial injury, including concussion, contusion, laceration, and hemorrhage); and code 959.01 (head injury, unspecified [beginning October 1, 1997]). Cases identified from a source other than HDD that did not have ICD-9-CM codes were included if clinical information reviewed soon after admission indicated that the patient had one or more of the following conditions attributed to head injury:
Data Collection and ProcessingAll states collected core (basic) data. These data included demographics, ICD-9-CM diagnosis codes and cause of injury (E codes), according to standards in the CDC Guidelines (7). Legal authority to identify persons with TBI allowed states to abstract supplementary data from medical records, including information regarding personal protective equipment (PPE) use, alcohol use, acute severity, and early indicators of disability. Data for 11 states that successfully abstracted data from medical records are included in this report. Four of these states (Alaska, Nebraska, Oklahoma, and Rhode Island) selected all cases for abstraction. The other seven states (Arizona, Colorado, Louisiana, Minnesota, New York, South Carolina, and Utah) each selected a stratified random sample of approximately 1,000 cases, from three strata defined as preadmission death, admission to small hospitals (<100 acute-care beds), and admission to large hospitals (>100 acute-care beds). In certain of these states the sample of 1,000 cases was allocated across strata in proportion to stratum size, but in other states, the strata were sampled at different rates. Data were successfully abstracted for a total of 9,949 TBI hospital discharge cases. To provide estimates based on abstracted variables, data for the sampled hospital discharge cases were appropriately weighted to represent the total population of hospital discharge cases in each of the hospital strata for each state. For abstracted variables, only weighted estimates are presented in this report (Appendix). Quality AssuranceStates were asked to check and verify the data, correct inconsistencies, and remove duplicate case records (e.g., patients hospitalized in more than one facility for the same injury) and records for out-of-state residents before sending the data to CDC. CDC received a dataset without personal identifying information. The majority of states submitted data within 18 months to 2 years after the end of calendar year 1997. CDC then applied a quality assurance (QA) program to each state's data to assess quality and completeness. Feedback was given to the states, and revision and resubmission of corrected data were requested as needed. This QA process required approximately 6 months to complete. VariablesExternal cause of injury (E code) for the major causes of hospitalized TBI was analyzed by using standard categories (12). These categories are motor-vehicle traffic-related, including motor-vehicle occupant, motorcyclist, pedal cyclist, and pedestrian; falls (unintentional); struck by/against (unintentional); assault (including firearm-related); and self-inflicted. Race was categorized as white, black, American Indian/Alaska Native, Asian/Pacific Islander, other, or unknown. PPE use included documented use of safety belts, child restraints, airbags, or helmets at the time of injury. No PPE use was coded if the record stated that PPE was not used. For cases without any information regarding PPE use, the variable was categorized as "unknown." Evidence of alcohol use before injury was categorized by laboratory-determined blood alcohol content (BAC) if available, or as alcohol used, which included cases with clinical or other evidence of alcohol use (i.e., report of a smell of alcohol on the breath, a description of alcohol use or intoxication at the time of injury, a positive breath test, or a positive saliva dipstick test). This method for measuring BAC has been validated (13,14). Acute brain injury severity was based on the patient's level of responsiveness and categorized by Glasgow Coma Scale (GCS) score (15). Missing GCS scores were replaced with equivalent scores based on information regarding level of consciousness at the time of admission to the hospital for 40% (n = 3,992) of the abstracted cases. Persons with a GCS score in the mild range (>13) were subcategorized by the presence or absence of a documented intracranial lesion determined from neuroimaging tests; those with no intracranial lesion were categorized as mild, uncomplicated, and those with an intracranial lesion as mild, complicated (16). A global measure of disability, the Glasgow Outcome Scale (GOS) score, was assigned retrospectively by medical records abstractors using medical record information, according to criteria adapted from ratings based on patient review and examination (17--19). GOS categorizes TBI patients on the basis of their physical and economic dependence and social reintegration (17). The Glasgow outcome levels used in this report were persistent coma --- unable to interact with the environment; severe disability --- able to follow commands, but unable to live independently; moderate disability --- able to live independently, but unable to return to work or school; and good recovery --- able to return to work or school, but might have certain residual disability. Data AnalysisRates were calculated by using 1997 population estimates from the U.S. Bureau of the Census (20) as denominators. The 14-state TBI surveillance population (n = 90.5 million) had a smaller proportion of persons aged >65 years than the U.S. population (11.9% versus 12.8%, respectively). Race was analyzed for 12 states (Alaska, Arizona, California, Colorado, Louisiana, Maryland, Missouri, Nebraska, New York, Oklahoma, Rhode Island, and South Carolina), each with >80% completeness for reporting of specific race categories (89.3% for the 12 states combined). The 12-state subset was similar to the U.S. population by age and sex but had a smaller proportion of whites than the U.S. population (79.1% versus 82.7%, respectively). The 12-state subset also had larger proportions of Asian/Pacific Islanders (6.5% versus 3.8%) and American Indians and Alaska Natives (1.3% versus 0.9%) than the U.S. population. Selected rates were age-adjusted to the 2000 Census population by using the direct method (Appendix). ResultsAfter exclusion of 4,538 in-hospital deaths, data for 62,771 live TBI-related hospital discharges were available for analysis. The age-adjusted TBI-related hospital discharge rate for the 14 states combined was 69.7/100,000 population (Figure 1; Table 1). The age-adjusted rate per 100,000 population varied widely by state and was highest for Maryland (99.2) and lowest for Rhode Island (52.1). At all ages, TBI-related hospital discharge rates were higher for males than females (Figure 2; Table 2). The overall age-adjusted rate for males was nearly twice that of females. For both sexes, rates were highest for the age groups 15--19 years and >65 years. Overall, age-adjusted rates were highest for American Indians/Alaska Natives and blacks, but substantial variation by age and sex (Figure 3; Figure 4; Table 3) occurred. For the age groups 20--24 years through 35--44 years, American Indians and Alaska Natives had the highest TBI-related hospital discharge rates. Within the age group 0--4 years, blacks had the highest rate, and within the age group >65 years, whites had the highest rate. For whites, blacks, and Asians/Pacific Islanders, the rate for persons aged >65 years was substantially higher than for persons aged 45--64 years. However, for American Indians and Alaska Natives, the rate for persons aged >65 years was substantially lower than for the other adult age groups. Among all races, males had substantially higher rates than females, but the differences were greatest among blacks (male to female ratio: 2.8 to 1) and American Indians and Alaska Natives (male to female ratio: 2.4 to 1). For all ages combined, motor-vehicle traffic-related incidents, falls, and assaults were the leading causes of injury for TBI-related live hospital discharges (27.9, 22.5, and 7.3/100,000, respectively) (Table 4; Table 5). Approximately three fourths of the motor-vehicle traffic-related TBI discharges were motor-vehicle occupants, and 15% were pedestrians (Figure 5). Persons aged 15--19 years had the highest rates of motor-vehicle traffic-related TBI discharges (Figure 6). The rate for motor-vehicle pedestrian-related TBI discharges among black males was approximately 3 times that of white males. Rates for falls were highest for those aged >65 years with an increased rate also among young children aged 0--4 years. TBI discharge rates for injuries caused by assaults were highest among persons aged 15--44 years (Figure 6). Black males had the highest TBI-related hospital discharge rate for assaults, approximately 4 times that of white males, followed closely by American Indian/Alaska Native males with a rate only marginally lower than that for black males (Figure 7). The leading specific causes of TBI-related assaults among males were being struck by a blunt/thrown object (38%), unarmed fighting/brawling (29%), and firearms (6%). This distribution was similar across race groups. Depending on race, the percentage for being struck by a blunt/thrown object was 35%--42%; the percentage for unarmed fighting/brawling was 22%--39%; and the percentage for firearms was 1%--9%. An estimated 46% of motor-vehicle occupants, 53% of motorcyclists, and 41% of pedal cyclists injured in motor-vehicle collisions were reported not to have been using PPE at the time of injury (Table 6). For approximately one half of the pedal cyclists injured in motor-vehicle collisions, information regarding PPE use was not reported. A BAC >0.01 g/dL or an indication of alcohol use was reported for a total of 21% of motor-vehicle occupants hospitalized with a TBI (Table 6); a total of 12% had a reported BAC of >0.10 g/dL. A similar proportion (12.5%) had a BAC of >0.08 g/dL, the current U.S. National Highway Traffic Safety Administration's recommended legal limit for drivers (21). Three fourths of persons hospitalized with a TBI had an acute brain injury severity classified as mild according to GCS (Figure 8; Table 7). Persons aged >65 years were 1.5 times as likely to have had a mild, complicated TBI than the next highest age group (45--64 years) and were more likely than all other age groups to have had a long length of stay (36% were >7 days) (Figure 9) and to have been discharged to another facility than to home, with only approximately one half being discharged to home. They were also 1.4 times as likely as the next highest age group (45--64 years) to be categorized as having severe disability according to GOS. For all ages combined, 17% of TBI-related hospital discharges were reported as having moderate to severe disability (including <1% in persistent coma) based on GOS; approximately three fourths were categorized as good recovery (i.e., able to return to work or school, but might have some some residual disability) (Figure 10). DiscussionIn this report, data from an ongoing TBI surveillance system were used to provide a comprehensive overview of TBI hospitalizations in 14 states. This overview presents date from the first effort to develop a multistate injury surveillance system for tracking and reporting of TBI-related hospital discharges. Youth aged 15--19 years, older adults, blacks, and American Indians and Alaska Natives had the highest rates of TBI resulting in hospitalization. These findings emphasize the importance of TBI as a public health problem by focusing on persons who survive the injury, often with long-term disability (22--24). The results also indicate that TBI prevention programs and services for persons with TBI-related disability are needed. The overall age-adjusted rate of TBI-related hospital discharges from the combined 14-state surveillance data (69.7/100,000) was substantially lower than the average annual U.S. hospital discharge rate for TBI from the National Hospital Discharge Survey for 1995--1998 (88.1/100,000, age-adjusted to the 2000 U.S. population) (25). In-hospital deaths were excluded from both of these rates. Differences in the rates from the National Hospital Discharge Survey and the 14-state surveillance system are likely attributable to methodological differences between the two studies. First, although the demographic characteristics of the surveillance population were similar to those for the U.S. population, the 14 states might not be entirely representative of the TBI incidence for the nation. Second, certain states included in the surveillance system are known to have lower rates because of the exclusion of resident cases injured in-state but hospitalized in another state. These cases would be captured by the National Hospital Discharge Survey. Third, the National Hospital Discharge Survey might have included multiple hospitalizations for the same injury, whereas the surveillance states exclude multiple hospitalizations whenever possible. Among the 14 states, substantial variability was found in the reported rates. Factors contributing to these differences might include differences among states in 1) the actual rate of TBI occurrence, 2) hospital admission practices, 3) the number of diagnosis codes that can be reported in the HDD sets, and 4) other TBI reporting and coding practices. The relative contributions of these factors have not yet been determined. The findings in this report confirm that TBI is a key public health problem among persons aged >65 years. Falls, the leading cause of TBI among older adults, are a growing public health concern. Recent reports indicate that the incidence of TBI among older persons might be increasing (26). Further studies are needed to determine the reasons for these increases and to identify appropriate prevention measures. Implementation of interventions to reduce falls in general among older persons could result in lower fall-related TBI rates (27). The high rates of TBI among American Indians and Alaska Natives and blacks have been reported in additional studies (10,28,29). In this study, a specific race category was not reported for approximately 11% of the TBI hospital discharges analyzed. Thus, the rates by race should be considered conservative, but they still allow comparison across race groups. However, differences by race should be interpreted with caution. Race and ethnicity are not risk factors for TBI but are markers for risk factors for injuries (e.g., socioeconomic status [SES]) (30). SES, which was not studied in this report, might account in part for the higher rate of assault-related TBI for black versus white males (31), but other unmeasured factors might also contribute to differences by race (32). American Indians and Alaska Natives might be at greater risk of injuries including TBI because the population is substantially younger than the total U.S. population (median age: 27.8 years versus 35.8 years) (20). Young persons are at higher risk for injury because of risk-taking behaviors (e.g., drinking and driving, not wearing seatbelts, and especially for Native Americans, abusive alcohol drinking styles, including binge drinking) (33). Further research is needed to better understand the risk factors for TBI indicated by the differences in rates by race so that appropriate prevention measures can be developed. An estimated 40%--50% of those injured as motor-vehicle occupants, motorcyclists, and pedal cyclists reportedly were not using PPE at the time of injury. Seat belts and airbags for motor-vehicle occupants (34,35) and helmets for both motorcyclists (36--38) and bicyclists (39--42) have been demonstrated to substantially reduce the risk of TBI. States can use data regarding TBI and the lack of PPE use to support the need for legislation requiring use of this equipment or better enforcement of existing legislation. An estimated one fourth of persons with TBI discussed in this report had an acute brain injury severity classified as moderate or severe according to GCS. Increased acute TBI severity contributes to an increased likelihood of injured persons needing rehabilitation or discharge to a long-term care facility (43) and impaired functional outcome (44). The South Carolina TBI surveillance system has demonstrated that information regarding the number of cases with severe TBI, in combination with other routinely available surveillance data, can be used to estimate the number of new case-patients each year expected to experience disability (Anbesaw Selassie, Dr.P.H., Medical University of South Carolina, Charleston, South Carolina, personal communication, October 2000). However, acute injury severity might not always be an accurate indicator of long-term outcome for persons classified as having a mild brain injury. Certain persons might have substantial long-term deficits (e.g., memory problems [44--47]) that could prevent them from performing even routine daily activities independently. Thus, a mild brain injury, as determined by acute severity measures, is not always associated with mild consequences. Also of importance is that GCS is not an adequate measure of severity among infants and young children because they are not yet able to follow verbal commands required to assign the score (48--49). Similarly, three fourths of persons hospitalized with a TBI were categorized as good recovery, and 17% had moderate to severe disability based on GOS, a global assessment measure using information regarding patients' abilities recorded while they are still in the hospital. Preliminary analysis of data from the Colorado TBI surveillance and follow-up systems indicated that a GOS score in the severe range was a substantial predictor of physical disability and cognitive disability at 1 year post-TBI, after adjusting for other factors (David Mellick, M.A., Craig Hospital, Englewood, Colorado, personal communication, October 2001). GOS and GCS are variables that states can use to help identify persons likely to experience TBI-related disability. However, because GCS and GOS are early, global measures, more detailed follow-up studies are needed to identify the specific long-term outcomes of TBI and related needs for assistance with daily activities and for other services. Ultimately, this information can be used by states to help ensure that persons at high risk of disability have access to appropriate rehabilitative and community-based services. The information presented in this report has multiple limitations. It includes hospital discharges only. Information regarding the number and causes of TBI-related deaths is a key consideration, especially for planning prevention efforts. The multistate surveillance system includes information concerning deaths that could be analyzed separately. This report provides an incomplete picture of persons who survive a TBI because it does not include information regarding those treated in emergency departments (ED) or doctors' offices only, or those who lack access or do not seek medical care. ED data provide critical information regarding less severe TBI, especially among children for whom the ratio of ED to hospital-treated TBI is approximately 14:1 (50). Surveillance of persons with TBI treated in ED, as well as those who receive care in doctors' offices or do not seek care, is of increasing importance to understanding the true effect of TBI. The availability of 1 year of data did not allow for evaluation of trends. Certain states, including South Carolina, have been able to analyze multiple years of statewide data to investigate trends. The lack of timeliness of the data is a critical limitation. The distributions of TBI by age, sex, and cause of injury tend to remain similar over time; however, because of the trend toward decreased hospital admission rates for TBI (51), the rates in this report, on the basis of 1997 data, are likely to be higher than more current rates. Because the TBI surveillance system relies heavily on use of administrative data sources, flexibility of the surveillance system is limited. Variability among certain states in the sources of TBI data, including trauma registries, might contribute to differences in the data that have not yet been evaluated. The abstraction of supplementary data not routinely reported in administrative data sets increases the potential to collect other data, including clinical information; however, abstracted data are limited because health professionals might not consistently record this information in the medical record. Lack of completeness for certain abstracted variables, including the Abbreviated Injury Scale score, precluded their inclusion in this report. On the other hand, use of statewide administrative HDD helps ensure that the data are representative and also reduces the cost, resulting in a system that is inexpensive to operate. Certain unexpected challenges were encountered in establishing a low-cost surveillance system that yields high-quality data. At the state level, lags of >1 year in receiving HDD are routine. After receiving the data, the majority of states needed another 18 months--2 years to abstract medical records, process and reformat the data according to the CDC Guidelines (7), and send the data to CDC. Certain states required additional time. At CDC, the resources and planning required to evaluate the quality of the data, provide feedback to states to make corrections, and to combine the revised data from different states exceeded original expectations. This included the need for development of detailed QA guidelines, QA report formats to communicate feedback to the states, and computer programs to generate these reports. However, as a result of efforts to evaluate the completeness and quality of the data received at CDC, the TBI Surveillance Program has developed and implemented multiple innovations. First, the CDC Guidelines for Surveillance of Central Nervous System Injury (7) have been revised and updated. The new document, the CDC Annual Data Submission Standards for Central Nervous System Injury Surveillance (52), was first produced in 2000. The majority of the changes were made to the guidance for collecting and submitting data abstracted from medical records. Multiple variables that were duplicative, determined not to be useful, or that were not well documented in medical records, were dropped. For other variables, more detailed categories were created (e.g., for sports and recreation-related causes). Certain new sampling variables were also added. Since then, the Standards has been revised each year to incorporate changes needed to respond to issues discovered from the previous year's review of submitted data. This document has been requested by multiple states that are not funded by CDC but are interested in applying the recommended methods to collecting and processing their own statewide TBI data. Detailed sample weighting programs and methods were also developed and applied to the abstracted data to allow the merging of data from varied states. These programs can be modified annually and more efficiently applied to new years of data. Because of ongoing surveillance efforts and analyses of data at the state level, CDC has been alerted to ICD-9 coding concerns that affected the accuracy of the TBI surveillance data. The South Carolina TBI Surveillance Program was among the first to note that the addition of a new code to the ICD-9-CM resulted in a substantial shift in TBI coding. Specifically, after the addition of the code 959.01 in 1997 (head injury unspecified), many cases that were previously coded by using the specific code 850 (concussion) were now being assigned the new less-specific code. After other states confirmed this pattern, CDC added 959.01 to the TBI case definition, and made a formal request to CDC's National Center for Health Statistics that more detailed coding guidance accompany this code in future versions of the ICD-9-CM. Also, the New York State TBI Surveillance Program conducted more in-depth medical-record abstraction of cases with possible shaken infant syndrome. Their findings indicated that the code for shaken infant syndrome (995.55) was not routinely applied to cases where evidence in the record indicated that the code might be appropriate. This finding alerted CDC and other states to the need to interpret cautiously data on the basis of this code. Further investigation is needed to understand why this code was not applied. The data from the surveillance system have been useful for other purposes. At the state level, they have been used to increase awareness of TBI as a public health problem, to target interventions (e.g., bicycle helmet use), to develop policy, to support prevention legislation, to expand surveillance by using HDD to include other injuries, and to obtain funding for prevention programs and services for persons with TBI (53). State service agencies have successfully used TBI surveillance data for their needs assessments. These assessments include those by Health Resources and Services Administration (HRSA)-funded TBI projects aimed at improving access to services for persons with TBI. At the national level, the data have been used to supplement information from national data sets to describe the effect of TBI on the nation. Specifically, the 14-state TBI surveillance data for American Indians and Alaska Natives are more complete than the data recently published from the Indian Health Service data system (28). These data were inlcuded in a recent brief report on TBI among American Indians and Alaska Natives that was requested by staff of the White House, Office on Disability. Additional uses for the surveillance system have also been demonstrated. States that have legal authority to identify and contact state residents who were hospitalized with TBI can build additional functions into their existing system. First, they can help link persons with TBI to available services by increasing their awareness of resources in the community. A pilot linkage project in Colorado contacted a sample of persons identified from surveillance by mail to inform them of a statewide 800 number that they could access for information regarding services. Preliminary data indicated that as a result of the project, the number of calls increased fourfold overall, and sixfold among persons with TBI living in rural settings (Pat Sample, Ph.D., Colorado State University, Fort Collins, Colorado, personal communication, July 2002). Second, states can follow up persons initially identified from surveillance to collect information regarding TBI outcomes. The Colorado Department of Health and the Environment, in collaboration with Craig Hospital and CDC, developed methods for tracking and interviewing by telephone a sample of persons identified from surveillance to determine their TBI-related disability and service needs (54). A similar project is ongoing in South Carolina. National TBI organizations including the Brain Injury Association of American and the National Association of State Head Injury Administrators agree that all states could benefit from having their own TBI data to plan prevention efforts and estimate the number of state residents needing TBI-related services. In collaboration with our state partners, CDC is working to identify the most useful state-based surveillance methods. Based on experiences to date, TBI surveillance needs to better balance the needs for quality data and timely reporting. For the majority of routine reporting of national estimates of TBI, use of existing national datasets (e.g., the National Hospital Discharge data) might be the most cost- effective, allowing for more effort to be focused on expanding state-based TBI surveillance. Development of simplified methods that allow for timely reporting regarding TBI at state and national levels is a priority for future planning. Communication of lessons learned from pilot projects designed to indicate how surveillance systems can be used to help persons with TBI get needed services is also important. These efforts will make it possible for an increasing number of states to apply these methods. Acknowledgments The authors acknowledge J. Lee Annest, Ph.D., Marcie-jo Kresnow, M.S., Richard W. Sattin, M.D., National Center for Injury Prevention and Control, and Joseph E. Sniezek, M.D., National Center for Chronic Disease Prevention and Health Promotion, for their helpful comments on the manuscript, and Wes Rutland-Brown, M.P.H., National Center for Injury Prevention and Control, for his valuable assistance, including preparation of the figures and tables. References
Table 1 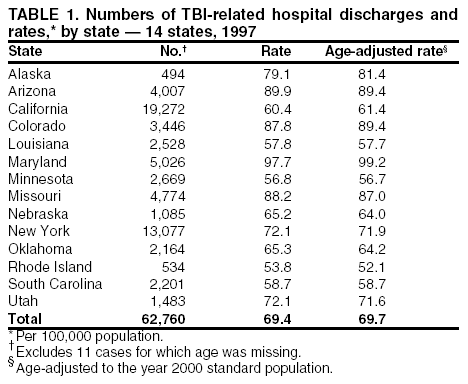 Return to top. Figure 1 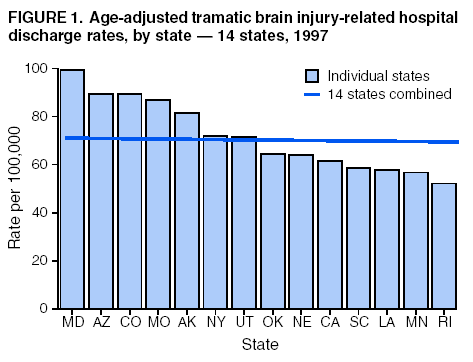 Return to top. Table 2 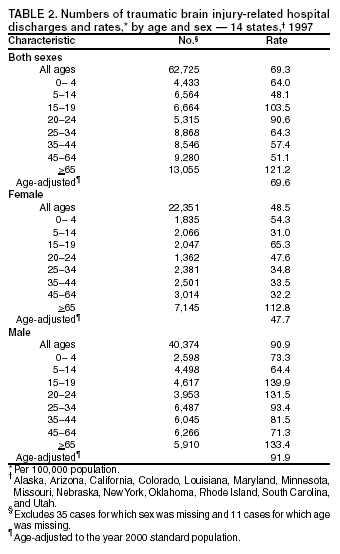 Return to top. Figure 2 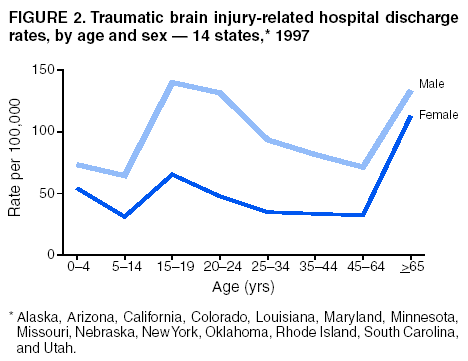 Return to top. Table 3 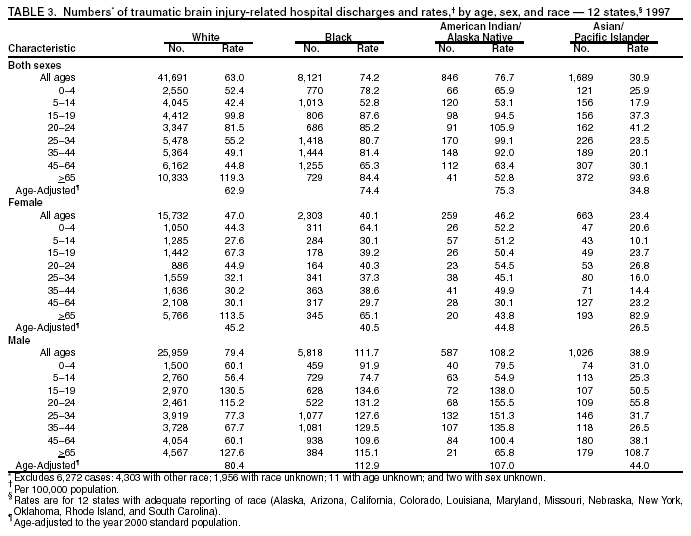 Return to top. Figure 3 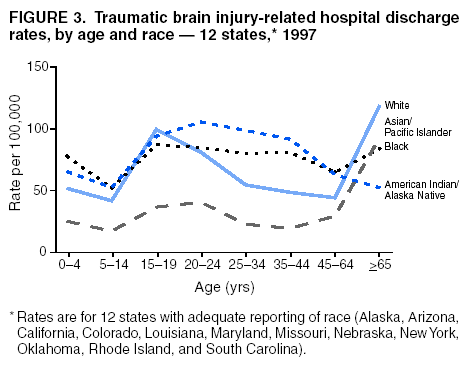 Return to top. Table 4 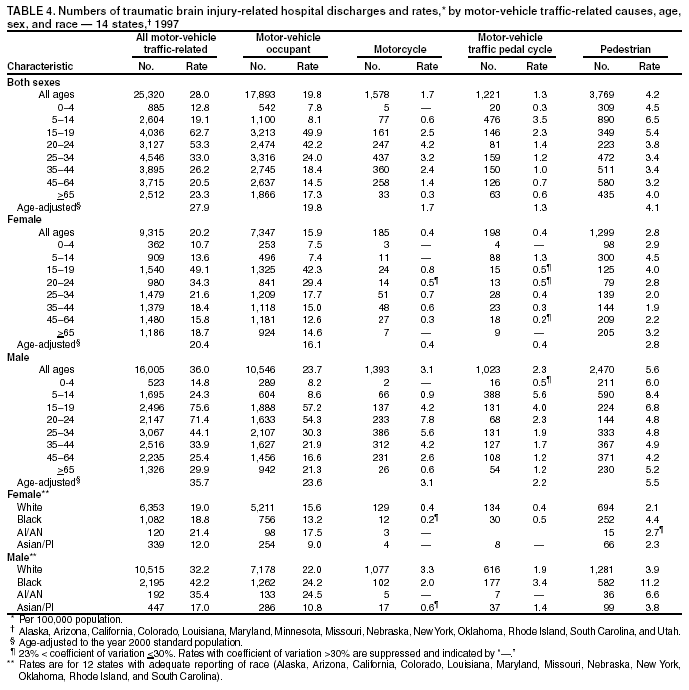 Return to top. Figure 4 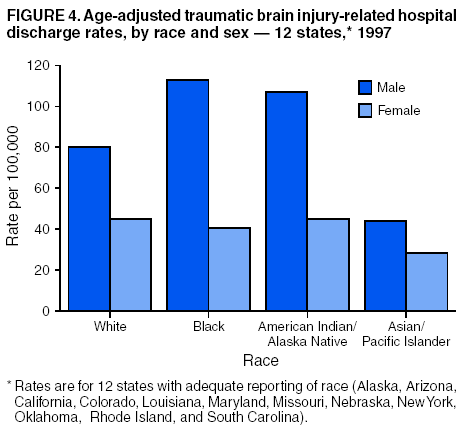 Return to top. Table 5 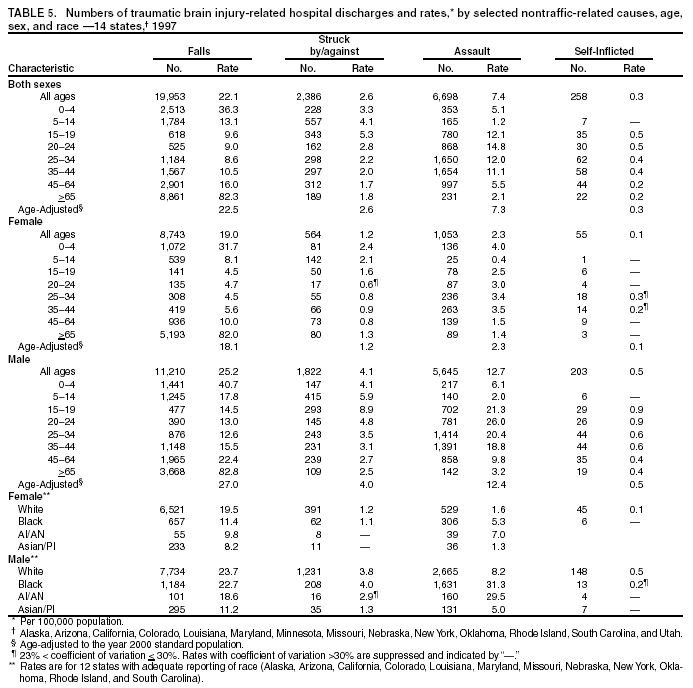 Return to top. Figure 5 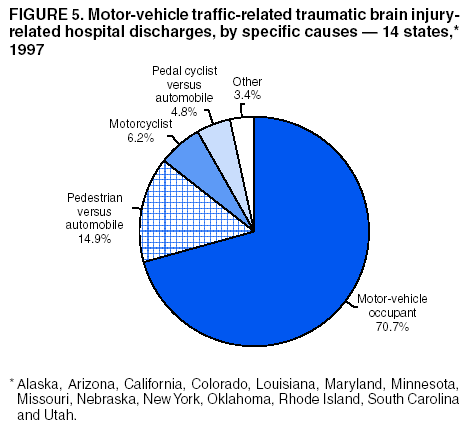 Return to top. Table 6 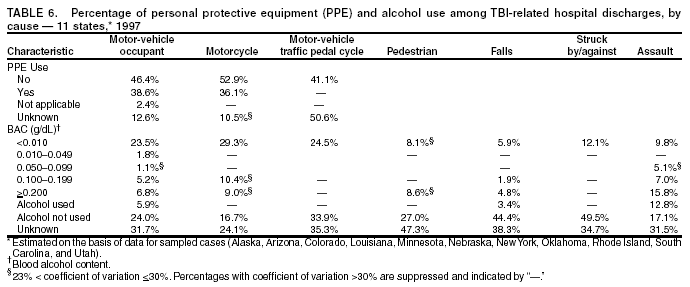 Return to top. Figure 6 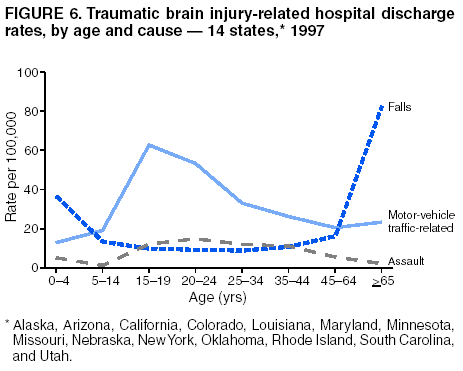 Return to top. Table 7 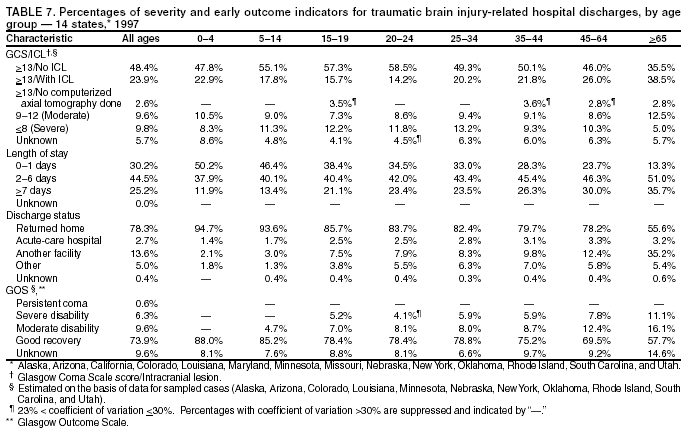 Return to top. Figure 7 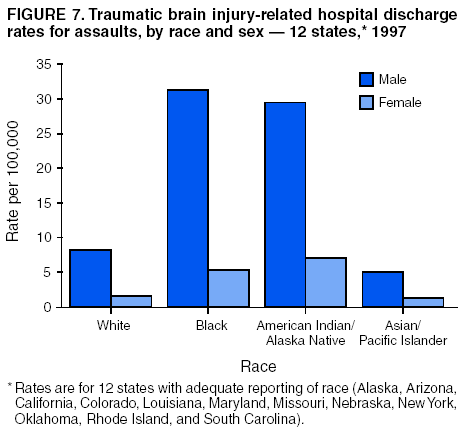 Return to top. Figure 8 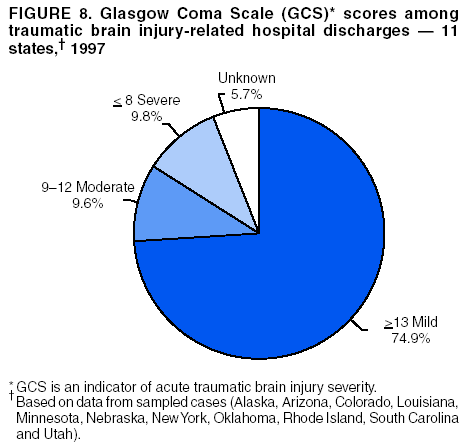 Return to top. Figure 9 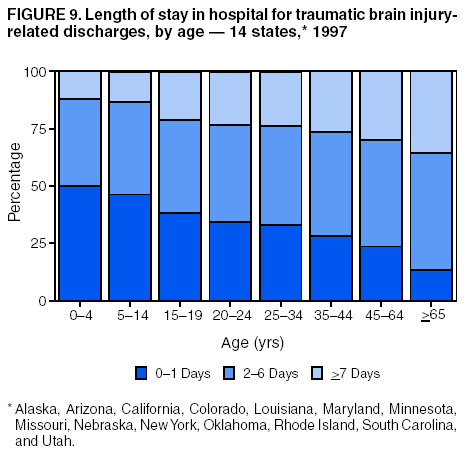 Return to top. Figure 10 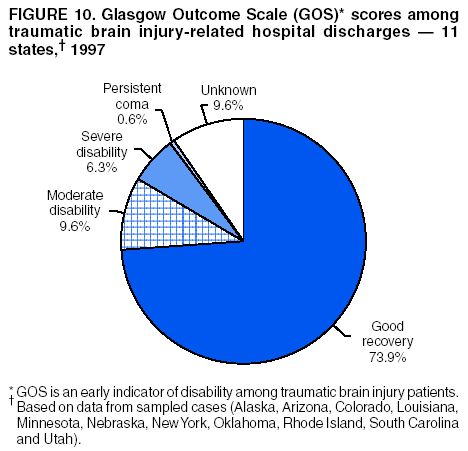 Return to top. CDC Traumatic Brain Injury Surveillance Working Group Nelson Adekoya, Dr.P.H., Clinton Alverson, M.S., Jacqui A. Butler, Richard A. Byrd, Victor G. Coronado, M.D., Megan Davies, M.D., Cliff Dunaway, Kathleen A. Dunn, M.D., Karen E. Gotsch, M.P.H., Edward L. Husting, Ph.D., Renee L. Johnson, M.S.P.H., Bruce Jones, M.D., Scott R. Kegler, Ph.D., Marcie-jo Kresnow, M.S., Jean A. Langlois, Sc.D., Angela L. Marr, M.P.H., Audrey A. Reichard, M.P.H., Joseph E. Sniezek, M.D., Robert G. Thomas, Jr., M.S.I.M., David J. Thurman, M.D., and Kevin W. Webb, National Center for Injury Prevention and Control.
State TBI Surveillance Participants Martha A. Moore, M.S., Diane M. Sallee, M.S., Alaska Department of Health and Social Services, Juneau, Alaska; Ardis A. Decker, M.P.H., Barbara A. Hathaway, Christina M. Menor, Arizona Department of Health Services, Phoenix, Arizona; Gilbert M. Gonzales, Barbara L. Johnson, Pima County Health Department, Tucson, Arizona. Jennifer S. Harper, M.S.P.H., Roger B. Trent, Ph.D., California Department of Health Services, Sacramento, California; Barbara A. Gabella, M.S.P.H., Holly B. Hedegaard, M.D., Shelli A. Marks, Elizabeth A. Price, M.S.M., Colorado Department of Public Health and Environment, Denver, Colorado; Alicia D. Batchelder, M.P.H., Heather B. Kutinac, M.P.H., Louisiana Office of Public Health, Baton Rouge, Louisiana; Lori A. Demeter, Ph.D., Tracey B. Serpi, M.S., Maryland Department of Health and Mental Hygiene, Baltimore, Maryland; Kimberly M. Auman, M.S., Patricia C. Dischinger, Ph.D., Shiu Ho, M.S., Jane Scott, Sc.D., University of Maryland Baltimore, Baltimore, Maryland; Mark R. Kinde, M.P.H., Jon S. Roesler, M.S., Minnesota Department of Health, St. Paul, Minnesota; Cindy J. Kapilla, Paula G. Kempf, Mark Van Tuinen, Ph.D., Missouri Department of Health and Senior Services, Jefferson City, Missouri; Victor Filos, Stephen R. Frederick, Patricia A. Fredrickson, Nebraska Department of Health and Human Services, Regulation, and Licensure, Lincoln, Nebraska; Julie A. Eisele, Ph.D., Susan B. Hardman, Melissa M. Kelly, Janel J. Pokorny, M.P.H., New York State Department of Health, Albany, New York; Pam J. Archer, M.P.H., Sue Mallonee, M.P.H., Sandy L. Van Patten, Oklahoma State Department of Health, Oklahoma City, Oklahoma; M. Eleanor Alger, Jay S. Buechner, Ph.D., Janice A. Fontes, M.A., David E. Hamel, M.P.A., Diane F. Lawhead, Mary C. Speare, M.A., Rhode Island Department of Health, Providence, Rhode Island; Leroy Frazier, Jr., M.S.P.H., Georgette Demian, M.P.H., South Carolina Department of Health and Environmental Control, Columbia, South Carolina; Mary Tyrell, M.S., South Carolina Budget and Control Board, Columbia, South Carolina; Anbesaw W. Selassie, Dr.P.H., Medical University of South Carolina, Charleston, South Carolina; Partha V. Gandhi, M.S., Patricia Keller, M.P.H., Utah Department of Health, Salt Lake City, Utah.
Disclaimer All MMWR HTML versions of articles are electronic conversions from ASCII text into HTML. This conversion may have resulted in character translation or format errors in the HTML version. Users should not rely on this HTML document, but are referred to the electronic PDF version and/or the original MMWR paper copy for the official text, figures, and tables. An original paper copy of this issue can be obtained from the Superintendent of Documents, U.S. Government Printing Office (GPO), Washington, DC 20402-9371; telephone: (202) 512-1800. Contact GPO for current prices. **Questions or messages regarding errors in formatting should be addressed to mmwrq@cdc.gov.Page converted: 6/11/2003 |
|||||||||
This page last reviewed 6/11/2003
|