
|
|
Volume
7: No. 1, January 2010
ORIGINAL RESEARCH
Ethnic and Regional Differences in Prevalence and Correlates of Chronic Diseases and Risk Factors in Northern Canada
Joykrishna Sarkar, MSc; Lisa M. Lix, PhD; Sharon Bruce, PhD; T. Kue Young, MD, PhD
Suggested citation for this article: Sarkar J, Lix LM, Bruce S, Young TK. Ethnic and regional differences in prevalence and correlates of chronic diseases and risk factors in northern Canada. Prev Chronic Dis 2010;7(1):A13.
http://www.cdc.gov/pcd/issues/2010/
jan/09_0001.htm.
Accessed [date].
PEER REVIEWED
Abstract
Introduction
We investigated ethnic and geographic variations in major chronic diseases and risk factors in northern Canada, an area that is undergoing rapid changes in its social, cultural, and physical environments.
Methods
Self-report data were obtained from the population-based Canadian Community Health Survey in 2000-2001 and 2005-2006 for Aboriginal and non-Aboriginal respondents from the 3 regions of northern Canada: Yukon, Northwest Territories, and Nunavut. Crude prevalence estimates, adjusted odds ratios (AORs), and confidence intervals were calculated for multiple chronic diseases and risk factors.
Results
The percentage of Aboriginal respondents who reported having any chronic health condition increased between the 2 cycles of data collection, but did not change for non-Aboriginal respondents. AORs for heart disease, arthritis, and asthma varied by ethnicity or region. AORs for overweight, obesity, daily smoking, regular and binge drinking, and infrequent physical/leisure activity were also substantially different for Aboriginal and non-Aboriginal respondents or among respondents from the 3
northern regions.
Conclusion
The changing profile of health in northern Canada suggests a need for action on health policy about the delivery of community-based primary prevention interventions and further research about the determinants of health and health care use.
Back to top
Introduction
People in circumpolar regions of Canada are experiencing rapid changes in their social, cultural, and physical environments. Scientists are increasingly concerned about the effects of these changes on population health, particularly the health of Aboriginal populations, which includes First Nations, Inuit, and Métis groups. The
increasing prevalence of “diseases of modernization,” such as diabetes and
high blood pressure, is already being observed (1). In northern Canada, more than half of the population is composed of Aboriginal people, primarily First Nations and Inuit, unlike most other circumpolar regions where Aboriginal people are a minority (2).
Although northern Canada is sparsely populated and communities are geographically disparate, this region has experienced rapid growth in some areas in recent years. The total population recently exceeded 100,000 (3); the largest increase occurred in the Northwest Territories (NWT) and in Nunavut. The Canadian north enjoys a higher per capita gross domestic product (GDP) than Canada as a whole, and the GDP of the NWT is about 2.5 times that of Canada’s GDP, primarily
attributable to increased
activity associated with the extraction of natural resources (4). However, this wealth is not evenly distributed; socioeconomic indicators show that Aboriginal people in the region are disadvantaged (2).
Across Canada, Aboriginal populations experience substantial variability in living conditions and lifestyles. Some illness and death patterns at the population level are drawing increased attention. For example, the prevalence of some chronic diseases, including diabetes, heart disease, and high blood pressure, is higher among the First Nations population than among the rest of the Canadian population; the prevalence of some risk factors, such as smoking and infrequent physical activity, is
also substantially higher among the First Nations population than among the rest of the Canadian population (5). Although the prevalence of many chronic diseases is lower among the Inuit than among the rest of the Canadian population, the prevalence of smoking is higher and obesity is also increasing (2). However, not enough research has been conducted that explores the variation of these chronic diseases and their risk factors within the populations of northern Canada.
Back to top
Methods
Study design and data source
We conducted a cross-sectional analysis for 2 time periods by using data from the population-based Canadian Community Health Survey (CCHS) (http://www.statcan.gc.ca/concepts/hs-es/index-eng.htm). CCHS
is a national health survey conducted by Statistics Canada to provide regular
and timely information about health status, determinants of health, and health
system use for 136 health regions in Canada, including the 3 regions of northern
Canada: Yukon, NWT, and Nunavut. The survey covers approximately 98% of the
Canadian population aged 12 years or older; excluded are people living on
Indian reserves and other government-owned land, institutional residents, and full-time members of the Canadian Forces.
The first cycle of data collection, cycle 1.1, occurred over a 14-month period from September 1, 2000, through November 2, 2001. A total of 131,535 respondents participated in the study, and the overall response rate was 84.7%. Since the first cycle, data collection has occurred at regular 2-year intervals (22). The most recent available data are from cycle 3.1, which were collected
from January 4, 2005, through January 8, 2006. The number of respondents was 132,947, and the overall
response rate was 78.9% (22). In northern Canada, the response rate for cycle 3.1 was 81.6% in Yukon, 81.7% in NWT, and 87.7% in Nunavut (24).
All respondents to cycle 1.1 or cycle 3.1 who self-reported Yukon, NWT, or Nunavat as their region of residence were included in the study. We focused on the adult population, so people younger than
aged 20 years were excluded.
The University of Manitoba Health Research Ethics Board approved this research. We obtained permission to access the data from Statistics Canada and conducted all analyses within the secure environment of the Statistics Canada Research Data Centre located at the University of Manitoba.
Study measures
We selected the outcome measures for investigation from the following CCHS modules: chronic conditions, height and weight, smoking, alcohol use, and physical activity. Module content and question wording changed over time; therefore, we carefully selected questions common to both survey cycles.
In the chronic disease module, respondents were asked if they had ever been diagnosed with each of several chronic health conditions by a health professional. In the first cycle, only physical health conditions were included. In the second cycle, both physical and mental health conditions were investigated. Dichotomous response variables (ie, presence/absence) that were common to both survey cycles were defined for the following conditions: asthma, arthritis/rheumatism, bowel disorders,
cancer, diabetes, emphysema/chronic obstructive pulmonary disease (COPD), heart disease, high blood pressure, and stroke. In addition, a dichotomous variable developed by CCHS methodologists to indicate the presence of any chronic condition was included. The following conditions were used to define this indicator of health status: food allergies, other allergies, asthma, fibromyalgia, arthritis/rheumatism, high blood pressure, back problems, migraine headaches, chronic bronchitis, emphysema,
COPD, diabetes, epilepsy, heart disease, cancer, stomach or intestinal ulcers, urinary incontinence, bowel disorders, cataracts, glaucoma, thyroid condition, chronic fatigue syndrome, multiple chemical sensitivities, and any other long-term condition diagnosed by a health professional.
Body mass index (BMI) was calculated from weight and height data. Two categories were defined according to Canadian guidelines (6):
1) overweight, BMI between 25.0 and 29.9; and 2) obese, BMI of 30.0 or more.
In the smoking module, respondents were asked whether they smoked daily, occasionally, or not at all. Using these results, we formed a single dichotomous variable of daily smoking (yes/no).
We used questions about the frequency of alcohol consumption to define the following mutually exclusive categories of drinkers: regular, occasional, former, and never. Regular drinkers were respondents who had in the past 12 months, consumed alcoholic beverages at least once a month. Occasional drinkers were defined as respondents who consumed alcohol less than once a month in the past 12 months. Former drinkers were respondents who had not consumed alcoholic beverages in the last 12 months,
but who reported having ever consumed alcohol. The data were used to form a single dichotomous variable defined as regular drinker (yes/no). To define binge drinking, respondents were asked about the quantity of alcohol consumed, specifically, whether they had ever consumed 5
or more drinks on a single occasion (7).
We calculated the average monthly frequency of all physical activities lasting 15 minutes or more by using the responses about physical activities lasting 15 minutes or more for the 3-month period before the date of the interview. Respondents were classified as participating in regular physical activity if the average monthly frequency of physical activity was 12 occasions or more (ie, 3 or more times per week), occasional physical activity if the average monthly frequency was between 4 and
11 occasions, and infrequent physical activity if the average monthly frequency was fewer than 4 occasions. These response categories were grouped to form a dichotomous variable with the categories of infrequent and regular/occasional. Levels of leisure physical activity were derived
from each respondent’s total daily energy expenditure during leisure time activities (8). Respondents were initially categorized as active (≥3.0 kcal/kg/day), moderate (1.5-2.99
kcal/kg/day), or inactive (0-1.49 kcal/kg/day); the former 2 categories were combined. Leisure physical activities included individual pursuits such as walking, running, swimming, fishing, and gardening and also team sports such as ice hockey, basketball, volleyball, and soccer.
Aboriginal and non-Aboriginal respondents were distinguished by a question about cultural or racial background. In the CCHS, the term Aboriginal encompasses North American Indians, Métis, and Inuit/Eskimo groups.
Statistical analyses
Data from cycles 1.1 and 3.1 were analyzed separately. Survey weights were used in all analyses; these weights ensure that the final estimates are representative of the total population within each of the 3 regions of northern Canada.
The percentage of respondents reporting each of the chronic diseases and risk factors was calculated, along with 95% confidence intervals. Weighted multiple logistic regression was used to test for an association between each chronic disease or risk factor and ethnicity and region. Each model included the covariates of age group (20-44 y, 45-54 y, 55-64 y, 65-74 y, and ≥75 y) and sex. The reference category for ethnicity was non-Aboriginal, and for region, it was NWT. The
latter was chosen because geographically this region is between the other 2 northern regions, and its population contains approximately the same proportion of Aboriginal and non-Aboriginal residents.
We used a bootstrap method to calculate 95% confidence intervals (CIs) for the estimated adjusted odds ratios (AORs) and P values (9-11). The bootstrap method randomly samples with replacement from the original set of observations to obtain a sampling distribution for a population parameter (eg, AOR). SAS software, version 9.1
(SAS Institute, Inc, Cary, North Carolina), was used to conduct all analyses. We
used a SAS macro that was developed by methodologists at Statistics Canada to calculate the bootstrap 95% CIs; these were based on 500 samples, as recommended by the
macro developers.
Back to top
Results
There were 2,074 respondents from northern Canada in cycle 1.1 and 2,166 respondents in cycle 3.1. Approximately one-quarter (26.7%) of respondents in cycle 1.1 were from Nunavut, one-third (33.6%) were from Yukon, and the remainder were from NWT (39.8%)
(Table 1). The geographic distribution of respondents was similar in cycle 3.1. Approximately 40% of respondents in each cycle were of Aboriginal ethnicity, although ethnic composition varied across the 3 regions.
In the first cycle, the percentage of Aboriginal respondents who reported having any chronic health condition was lower compared with the percentage of non-Aboriginal respondents
(Table 2). However, there was a large increase between the 2 cycles for Aboriginal respondents (8.8 percentage point difference), but not for non-Aboriginal respondents (0.6 percentage point difference). This increase was observed for both younger (20-54 years) and older (≥55 years) age groups (Figure). In the first
cycle, Yukon respondents reported the highest crude prevalence of any chronic condition, and prevalence estimates were similar for NWT and Nunavut respondents. Prevalence estimates for any chronic condition were similar for all regions between cycles 1.1 and 3.1, with the exception of NWT, where an increase was observed.
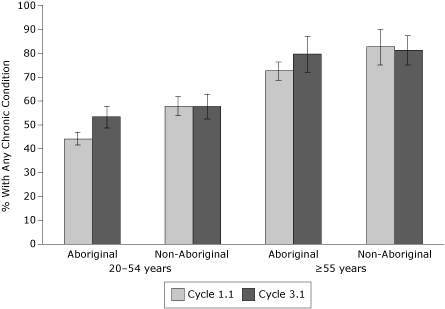
Figure. Percentages of any chronic condition by ethnicity and age, Canadian Community Health Survey,
cycle 1.1 (2000-2001) and cycle 3.1 (2005-2006) (error bar = 95% confidence
interval).
[A tabular version of this figure is also available.]
The prevalence of all of the investigated chronic diseases was similar in cycles 1.1 and 3.1. Arthritis was the most common chronic condition reported; it was reported by 13% of northern Canada respondents, followed by high blood pressure (approximately 10%) and asthma (approximately 8%)
(
Table 2). Prevalence estimates were slightly higher for respondents from Yukon than for respondents from the other 2 regions. Data for some diseases and risk factors were not included in our analyses because
of low frequencies. Specifically, data for bowel disorders, cancer, emphysema/COPD, and stroke were not reported.
Approximately one-quarter of Aboriginal and non-Aboriginal respondents were
classified as overweight, and approximately 20% were classified as obese in
Cycle 1.1 (Table 2). Between the 2 cycles of data collection, there was an increase
(5.3 percentage point difference) in overweight for non-Aboriginal respondents, but not
for Aboriginal respondents. There was an increase in obesity for Aboriginal (5.2 percentage point
difference) and non-Aboriginal
(2.6 percentage point difference) respondents. Approximately one-third of NWT respondents were classified as overweight in cycle 1.1; prevalence was lower in the other 2 regions.
More than one-half of Aboriginal respondents were identified as daily smokers in both cycle 1.1 (52.5%) and cycle 3.1 (50.2%), compared with less than one-third (29.9%) of non-Aboriginal respondents in the first cycle and less than one-quarter (23.5%) of the latter group in the second cycle. Daily smoking rates were highest in Nunavut (50.2%) and lowest in Yukon (27.8%) in cycle 3.1. Regular drinking and binge drinking were more common among non-Aboriginal and Yukon respondents. Higher
prevalence of infrequent physical activity and inactivity during leisure time was observed among non-Aboriginal and Nunavut respondents (Table 2).
The adjusted odds of having any chronic health condition were significantly lower and the odds of heart disease were significantly higher for Aboriginal respondents in cycle 1.1, but the AORs for these 2 variables were not significant (any chronic condition, P
= .61; heart disease, P = .78) in cycle 3.1
(Table 3). Among Aboriginal respondents, in both survey cycles, odds of daily smoking and infrequent physical activity were
higher than for non-Aboriginal respondents, but odds of regular drinking and binge drinking were lower. Moreover, the ORs for daily smoking and infrequent physical activity were larger in cycle 3.1 than in cycle 1.1.
By region, the odds of having any chronic condition were highest for Yukon respondents in cycle 1.1 (Table 3). The odds of arthritis were lowest for Nunavut respondents in cycle 1.1. The odds of asthma were lower for Nunavut respondents in both cycles. There were no regional differences for other chronic diseases.
For Yukon respondents, although there were
a number of significant differences in the AORs for risk factors, those for
obesity and inactivity during leisure time (lower odds) were observed in both
cycles (Table 3). For Nunavut respondents, the odds of daily smoking were higher
than for respondents from the other regions in both cycles, and the odds of regular drinking were significantly lower in cycle 1.1.
Back to top
Discussion
These population-based health survey data suggest that chronic diseases and risk factors are not uniformly distributed across ethnic groups and geographic regions of northern Canada and that some negative shifts have occurred in their distribution in a relatively short period of time.
Some of the findings of this study are consistent with previous research comparing Aboriginal and non-Aboriginal populations in southern Canada or in other countries, but others are not. For example, smoking rates are reported elsewhere to be higher among Aboriginals compared with non-Aboriginals (8,12). A previous study that compared chronic disease and risk factors between northern and southern Canadian populations found that the Aboriginals had a higher prevalence of overweight and
obesity, daily smoking, and physical inactivity than the non-Aboriginals (13). However, we found that these risk factors among northern Canadian populations varied substantially. In addition, with respect to overweight, recent studies suggest that Canadian Aboriginals have substantially higher rates of overweight than non-Aboriginals with self-reported white ethnicity (14,15), which contradicts our findings. The difference may arise, in part, because the non-Aboriginal group in this study was
not limited to whites.
Overweight, obesity, smoking, binge drinking, and inactivity threaten the long-term health of northern Canadian populations. Excess weight and smoking increase the risk of cardiovascular disease (16), smoking is associated with an increase in certain forms of cancer, and excess weight can also contribute to the development of chronic musculoskeletal conditions.
A recent study, which reviewed the literature on self-reported cancer screening behaviors and race, found greater bias in self-reported behaviors for racial and ethnic minority groups, including North American Indians; it suggested that a variety of factors, including motivation, cognition (ie, health literacy and knowledge of screening techniques), and the health care environment, may contribute to bias in estimates from self-reported data (17). Chronic disease prevalence estimates may not
agree with estimates obtained from other population-based sources. For example, 1 study found that agreement between survey and administrative data was highest for diabetes and
high blood pressure, but much lower for arthritis and heart disease (18).
There are several limitations to our study. We relied on self-reported data,
which may have underestimated the prevalence of overweight, obesity, smoking,
and binge drinking and overestimated the prevalence of physical activity (19).
Health care services and screening programs for Aboriginal people in northern
Canada may be less accessible than for non-Aboriginal people; this may result in
biased self-reporting about chronic diseases because the survey questions in
this study focused on conditions diagnosed by a health professional (8).
Measures of overweight and obesity developed in European populations may not be
appropriate for Aboriginal populations (20), especially the Inuit, whose
ancestors came from Asia (21); in general, people of Asian descent have more risk factors and
higher body fat than people of European descent with the same BMI. Leisure time physical activity does not include activities performed at work
(eg, work-related labor activity), at school (eg, physical education class), or at home (eg, household chores). The measure of any chronic condition used in this study provides an overall indicator of health status but obscures changes in individual conditions; an increase in this indicator
does not necessarily represent an increase in the prevalence of all chronic conditions. The CCHS covers 90% of the Yukon population and 97% of the NWT population, but only 71% of the
Nunavut population (22) (data were only collected in the 10 largest communities in Nunavut). Thus, the results for the latter region may not be as representative of the entire population as results for the other 2 regions. Finally, we used cross-sectional data to estimate change in chronic diseases and risk factors instead of using repeated measurements on the same cohort of respondents to study the progression of health.
Although these survey results can provide snapshots of health status and its determinants, further analyses and other population-based data sources
are needed to obtain a more complete picture of chronic disease in northern Canada, its association with health care use, and the effect of community-based interventions on changes in health status. Not enough information exists about different Aboriginal groups, particularly Inuit and First Nations groups, who do not have identical
disease burden or risk factor distribution. Data from multiple cycles of the CCHS may be combined to achieve sufficient sample size to enable comparisons of First Nations and Inuit groups within northern Canada. Administrative data, including hospital and physician records, are 1 source of routinely collected data that can be used to further study ethnic and regional variations in chronic disease and their association with health care use (18). The Aboriginal Peoples Survey, which was initiated
by the federal government in 2001, addresses gaps in other sources, including the lack of data about some determinants of Aboriginal health (eg, housing, employment, residential mobility). More health policies are needed that are culturally sensitive and that focus on the delivery of preventive interventions (23).
The findings of our study, which suggest an overall increasing prevalence of chronic disease in Aboriginal populations and negative shifts in the distribution of risk factors, underscore the importance of community-based primary preventive interventions at the community and primary care level in northern communities.
Back to top
Acknowledgments
This research was supported by the Canadian Institutes of Health Research (CIHR) Team Grant “CIHR Team in Circumpolar Health Research”
(CTP-79853) and the Canadian Arthritis Network (07-NAARI-04).
Back to top
Author Information
Corresponding Author: Lisa M. Lix, PhD, School of Public Health, University of Saskatchewan, 107 Wiggins Rd, Saskatoon, SK Canada S7N 5E5. Telephone: 306-966-1617. E-mail:
lisa.lix@usask.ca.
Author Affiliations: Joykrishna Sarkar, Sharon Bruce, University of Manitoba, Winnipeg, Canada; T. Kue Young, University of Toronto, Toronto, Canada.
Back to top
References
- Bjerregaard P, Young TK, Dewailly E, Ebbesson SOE.
Indigenous health in the Arctic: an overview of the circumpolar Inuit population. Scand J Public Health 2004;32:390-95.
- Young TK, Bjerregaard P, editors. Health transitions in Arctic populations. Toronto,
Ontario
(CA): University of Toronto Press; 2008.
- Statistics Canada. Census trends: 2006 census [homepage on the Internet]. Ottawa: Government of Canada; Catalogue no. 92-596-XWE. http://www12.statcan.ca/english/census06/data/trends/. Accessed November 4, 2008.
- Duhaime G, Andrée C. The economy of the circumpolar Arctic. In: Glomsrød S, Aslaksen I, editors. The economy of the
North. Oslo (NO): Statistics Norway; 2006. p. 16-25.
- Waldram JB, Herring DA, Young TK. Aboriginal health in Canada: historical, cultural, and epidemiological perspectives. 2nd edition. Toronto,
Ontario (CA): University of Toronto Press; 2006.
- Office of Nutrition Policy and Promotion. Canadian guidelines for body weight classification in adults. Ottawa
(ON): Health Canada; 2003. Catalogue no. H49-179/2003E.
- Reynolds DL, Chambers LW, DeVillaer MR.
Measuring alcohol abuse in the community: consumption, binge-drinking, and alcohol-related consequences (“alcoholism”). Can J Public Health 1992;83:441-7.
- Tjepkema M.
Adult obesity. Health Rep 2006;17:9-25.
- Rao JNK, Wu CFJ, Yue K. Some recent work on resampling methods for complex surveys. Survey Methodol 1992;18:209-17.
- Rust KF, Rao JN.
Variance estimation for complex surveys using replication techniques.
Stat Methods Med Res 1996;5(3):283-310.
- Yeo D, Mantel H, Liu TP. Bootstrap variance estimation for the National Population Health Survey. Proceedings of the Annual Meeting of the American Statistical Association, survey research methods section; August 8-12, 1999; Baltimore,
Maryland. Alexandria (VA): American Statistical Association; 1999. p. 778-83.
- Shields M, Tremblay S. The health of Canada’s communities. Health Rep 2002;13:1-24.
- Deering KN, Lix LM, Bruce S, Young TK.
Chronic diseases and risk factors in Canada’s northern populations: longitudinal and geographic comparisons. Can J Public Health 2009;100:14-7.
- Tremblay MS, Perez CE, Ardern CI, Bryan SN, Katzmarzyk PT.
Obesity, overweight and ethnicity. Health Rep 2005;16:23-34.
- Garriguet D.
Obesity and the eating habits of the Aboriginal population. Health Rep 2008;19:21-35.
- Tanuseputro P, Manuel DG, Leung M, Nguyen K, Johansen H.
Risk factors for cardiovascular disease in Canada. Can J Cardiol 2003;11:1249-59.
- Burgess DJ, Powell AA, Griffin JM, Partin MR.
Race and validity of self-reported cancer screening behaviors: development of a conceptual model. Prev Med 2009;48:99-107.
- Lix LM, Yogendran MS, Shaw SY, Burchill C, Metge C, Bond R. Chronic disease case ascertainment from administrative data: agreement with survey data. Chronic Dis Can 2008;29:31-8.
- Gorber SC, Shields M, Tremblay MS, McDowell I.
The feasibility of establishing correction factors to adjust self-reported estimates of obesity. Health Rep 2008;19:71-82.
- Lear SA, Humphries KH, Frohlich JJ, Birmingham CL.
Appropriateness of current thresholds for obesity-related measures among Aboriginal people. CMAJ 2007;177:1499-505.
- Young TK, Bjerregaard P, Dewailly E, Risica PM, Jørgensen ME, Ebbesson SEO.
Prevalence of obesity and its metabolic correlates among the circumpolar Inuit in three countries. Am J Public Health 2007;97:691-5.
- Statistics Canada. Canadian community health survey cycle 3.1: public user microdata file user guide. 2006. http://www.statcan.gc.ca/imdb-bmdi/document/3226_D20_T1_V1-eng.pdf. Accessed November 8, 2008.
- Wardman D, Quantz D, Tootoosis J, Khan N.
Tobacco cessation drug therapy among Canada’s Aboriginal people. Nicotine Tob Res 2007;9:607-11.
- Statistics Canada. Response rates by province, territory, and health region, Canadian community health survey cycle 3.1, January to December 2005. 2006. http://www.statcan.gc.ca/imdb-bmdi/document/3226_D19_T9_V1_B.pdf. Accessed August 23, 2009.
Back to top
|
|
