
|
|
Volume 6: No. 3, July 2009
ESSAY
A Socioeconomic Analysis of
Obesity and Diabetes in New York City
Jonathan B. Wallach; Mariano J. Rey, MD
Suggested citation for this article: Wallach JB, Rey
MJ. A socioeconomic analysis of obesity and diabetes in New York City. Prev Chronic Dis
2009;6(3):A108.
http://www.cdc.gov/pcd/issues/2009/
jul/08_0215.htm. Accessed [date].
PEER REVIEWED
New York City is getting healthier by almost all measures, but the twin
epidemics of obesity and diabetes are getting worse by the year (1).
— New York City Health Commissioner
Thomas R. Frieden, MD, MPH
Back to top
The Epidemic of Obesity and Diabetes
Surging obesity rates throughout the United States have rapidly changed the
face of diabetes mellitus, spawning a type 2 diabetes epidemic. Whereas
in the past the most prevalent form of the disease was type 1, today more than 90%
of cases are type 2 (2). From 1991 to 2001, obesity grew nationwide by 74%
(2); correspondingly, the prevalence of type 2 diabetes increased 61% during the same
period (3). Researchers have calculated that each kilogram increase in body mass
increases the risk for developing diabetes by 4.5% (4). Indeed, because of
the increasing number of children developing the disease, type 2 is no longer
referred to as “adult onset.” Because of the obesity epidemic, more than 7.8% of
adult Americans have diabetes today (4). The problem is particularly severe in
New York City, despite its reputation as a city of fit pedestrians; the prevalence
of diabetes among New Yorkers has doubled during the past decade to 12.5%,
mirroring surging obesity rates citywide (5). Indeed, uncontrolled diabetes is
the leading cause of blindness, end-stage renal disease, and nontraumatic
lower-extremity amputations for adult New Yorkers (6).
The somatic consequences of diabetes — including a greatly increased risk of
cardiovascular disease, stroke, blindness, renal failure, and amputations — are
well-known and documented. Researchers are now also focusing on its devastating
effects on mental health, as diabetic New Yorkers are 1.9 times more likely than nondiabetic residents to suffer from depression, anxiety, and other
psychological disorders (6).
Back to top
Socioeconomics of the Epidemic in New York City
According to New York City Health Commissioner Thomas R. Frieden, MD, MPH,
“Of all diseases New Yorkers suffer, diabetes and HIV have the greatest
disparities of race and class” (1). Indeed, throughout the United States, poorer
people are more likely to become obese because of factors such as less
healthy nutritional habits (healthy foods tend to be more expensive) and lack of
time to exercise. They are thus more likely to develop not only obesity but also
type 2 diabetes, following a predictable pathway in which poverty leads to
obesity, and obesity in turn leads to type 2 diabetes. Furthermore, poorer people are
more likely to have severe, uncontrolled disease because of their limited access
to health care and health education; regular monitoring and patient
self-management reduce diabetes-related morbidity and mortality. Wide income
disparities exist in New York City, and the poorest areas (which include the
South Bronx, northern Manhattan, and the Brooklyn/Queens border) have the highest
levels of obesity and diabetes (Figure 1).
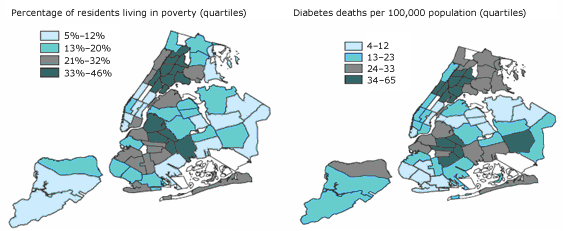
Figure 1. Maps of New York City showing percentages
of residents living in poverty and diabetes deaths per 100,000 population,
by borough and neighborhood.
Map at left: Percentages are age-adjusted.
Source: US Census 2000/New York City Department of City Planning
Map at right: Rates are age-adjusted.
Source: Bureau of Vital Statistics, New York City Department of Health and Mental Hygiene, 2002; US Census 2000/New York City Department of City Planning
[A text description of this figure
is also available.]
An ethnic component characterizes and contributes to the city’s diabesity
epidemic, even beyond household income discrepancies. New York City is
racially diverse, consisting of about 35% whites, 25% blacks, 27% Hispanics,
10% Asians, and 3% mixed-race or other ethnicity in 2003 (7). Although the entire
city’s adult population has a diabetes prevalence of 12.5%, it is highest
among Asians (16.0%), followed by blacks (14.3%), Hispanics (12.3%), and
whites (10.8%). These estimated statistics include undiagnosed cases (5).
Racial economic demographics tell us that whites are the least likely to be
living in a household with an income less than $25,000 (27%), followed by
Asians (32%), blacks (42%), and Hispanics (46%) (7). Yet even among
households with similar levels of income, whites have consistently lower
rates of obesity and, correspondingly, diabetes than blacks and Hispanics
(Figures 2 and 3).
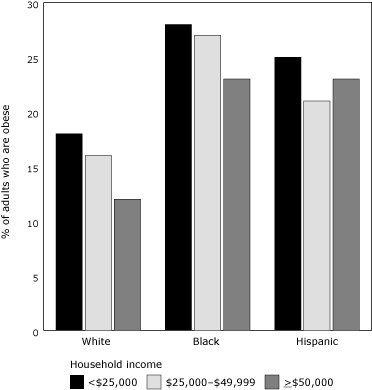
Figure 2. Percentage of
New York City residents who are obese and their household income, by racial/ethnic
group.
Percentages are age-adjusted.
Source: New York City Community Health Survey, 2002.
Obesity was defined as body mass index >30 kg/m2, calculated from respondents' height and weight.
Complete information was unavailable for Asian household incomes.
[A tabular version of this figure is also
available.]
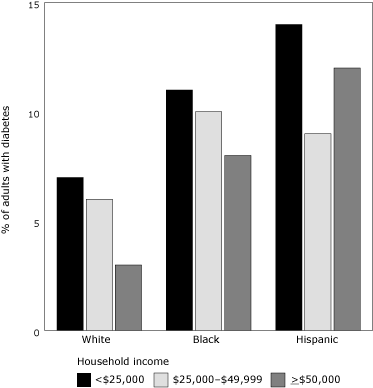
Figure 3. Percentage of
New York City adults with diabetes and their household income, by
racial/ethnic group.
Percentages are age-adjusted.
Source: New York City Community Health Survey, 2002.
Survey respondents were asked: Have you ever been told by a doctor that you have diabetes?
Complete information was unavailable for Asian household incomes.
[A tabular version
of this figure is also available.]
Back to top
Deviations From the Predicted Pathway
The development of diabesity usually follows the predictable pattern
in which the poorest income groups are the most likely to be obese and thus develop
diabetes. However, for New York City’s Hispanics, the trend is unexpectedly
U-shaped. Unlike whites and blacks, for Hispanics the highest household income
group (≥$50,000) has a higher rate of both obesity and diabetes than does the
middle-income group ($25,000-$49,999). This trend occurs even though exercise
rates for all ethnic groups consistently increase as household income rises (7).
Additional socioeconomic research is needed to elucidate this phenomenon,
particularly regarding the dietary habits of the 26% of Hispanic households
constituting the wealthiest tier (7).
Asian New Yorkers also deviate from the poverty/obesity/type 2 diabetes
pathway when their obesity and diabetes rates are compared with those of other
ethnicities. Asian households have incomes slightly below those of white
households, and only 5% of adult Asians are obese (far lower than for any other
ethnicity) and 24% are overweight (8). Nonetheless, Asians have the highest
adult diabetes prevalence (16%) (5). A genetic etiology probably accounts for
this discrepancy: a recent major study among women demonstrated that, after
adjusting for both age and BMI, compared with whites, blacks were 34% more
likely to have diabetes, Hispanics were 86% more likely, and Asians were 126%
more likely (9). Even taking into consideration their low BMIs, Asians are
still the most likely to develop type 2 diabetes.
Back to top
Citywide Efforts to Combat the Epidemic
Health officials are increasingly alarmed by the high rates of obesity and
diabetes. In 2002, the municipal
government formed the Diabetes Prevention and Control Program with the stated
goals of preventing new cases of diabetes, decreasing complications associated
with the disease, and increasing quality of life for diabetic residents. Its
official 5-point plan consists of professional, community, and patient
education; surveillance and evaluation; advocacy; primary prevention of obesity
and diabetes; and targeting at-risk youth.
The 2004 New York City Health and Nutrition Examination Survey revealed that
more than half of all diabetic adult New Yorkers had hemoglobin A1c levels
greater than 7%, indicating poor compliance with recommended self-care measures
(5). In 2006, New York City initiated the A1C Registry Program to monitor the
blood glucose levels of its diabetic residents, requiring laboratories to report
diabetics’ hemoglobin A1c results directly to the Health Department. In turn,
health officials analyze the data to monitor the quality of care and the extent
of the epidemic in various neighborhoods. They are also planning to intervene
directly in individual patients’ treatments. A program currently being tested in
the South Bronx requires city officials to alert doctors to patients who are not
adequately controlling their glucose levels. These patients are also personally
contacted by city officials and reminded of the medical consequences that can
result from poor compliance. Indeed, this program marks the first time any
American government has tracked patients who have a chronic, noncommunicable
disease (10).
The municipal government is also tightening its regulations on New York
City’s 22,000 restaurants to promote serving healthier meals. In a nationally
publicized move, in July 2007 it limited artificial trans fat content to 0.5 g
per serving and issued an additional deadline of July 2008 to stop use of the
ingredient entirely. McDonald’s and Burger King, the city’s largest restaurant
chains, have replaced trans fats with somewhat healthier nonhydrogenated
soybean, corn, and canola oils and are gradually implementing this change
nationally. Philadelphia, Pennsylvania; San Francisco, California; Albany
County, New York; and many other governments have followed New York City’s lead
or are considering the ban.
In February 2006, the city government also began the Gestational Diabetes
Initiative to identify and educate mothers who developed gestational diabetes.
Studies have shown that approximately 50% of these women will develop diabetes within 6
years, particularly if they are and remain obese (11). This program uses birth
certificate records to identify mothers who developed gestational diabetes and
then sends resource packets to them describing their potential health risks and
how to recognize the symptoms of diabetes. A letter is also sent to tens of
thousands of health care providers, reminding them to discuss the risks of
gestational diabetes, screen for diabetes before and after delivery, and
recommend healthy lifestyle changes.
Back to top
Sociodemographic Groups to Target
The municipal government’s efforts have been mostly citywide, despite the
socioeconomic discrepancies that exist in the diabesity epidemic. To enhance the
efficiency and effectiveness of its efforts, New York City needs to begin
primary and secondary prevention programs that target populations
most at risk.
Hispanic schoolchildren, particularly boys
A recent study of 2,681 New York City elementary schoolchildren revealed that
24% are obese and another 19% are overweight (12). Wide discrepancies exist in
the prevalence of diabetes among ethnicities and also by sex among Hispanics;
Hispanic boys have obesity rates that are significantly higher than
those for Hispanic girls (36% vs 26%) (Figure 4) (12). Further aggravating this
situation, Hispanic schoolchildren, who make up 40% of the students, have
experienced the most rapid rise in obesity (12). These findings necessitate
focused intervention with school-based nutritional and physical activity
education programs in predominantly Hispanic schools. If such efforts are not
undertaken, the 31% obesity rate among Hispanic schoolchildren is likely to
cause the current 12.3% diabetes prevalence among Hispanic adults to rise
in coming years (5,7).
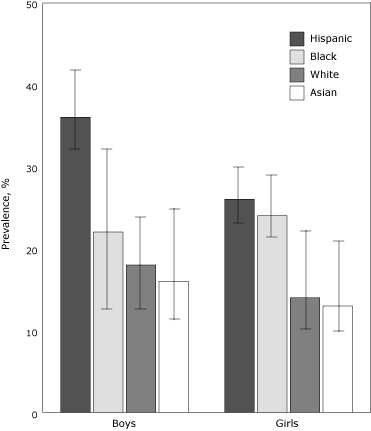
Figure 4. Prevalence (with 95% confidence interval
bars) of obesity among New York City public elementary schoolchildren, by
sex and
race/ethnicity, 2003.
Source: Thorpe LE, List DG, Marx T, May L, Helgerson SD, Frieden TR.
Childhood obesity in New York City elementary school students. Am J Public Health 2004;94(9):1496-1500.
[A tabular version of this
figure is also available.]
Asian communities, particularly schoolchildren
The high diabetes prevalence among Asian New Yorkers is surprising, given
their relatively low adult obesity rate of 5% and overweight rate of 24%, and is
most likely due to an increased genetic susceptibility at any given BMI. For
this reason, Asian communities should be educated about their susceptibility and
encouraged to be more vigilant in maintaining a healthy weight and having their
blood glucose checked regularly even if they are not overweight.
Particular attention should be focused on educating Asian schoolchildren. In
New York City today, an Asian adult obesity rate of 5% correlates with an adult
diabetes rate of 16%; because nearly 15% of Asian schoolchildren are obese (3
times the current adult obesity rate), the diabetes rate among Asian adults can
be expected to increase as these obese children become adults.
Back to top
Conclusions
The New York City government has arguably become the nation’s most
aggressive municipal government in enacting administrative policies to
combat the development and progression of diabetes. Many of its policies,
particularly eliminating artificial trans fats from its restaurants, have
attracted national headlines and have been copied in other cities. However,
diabetes in the city varies widely among different socioeconomic groups.
Therefore, more focused efforts need to be undertaken to intervene in the
demographic segments at highest risk to tackle more efficiently and
effectively the only major health problem that is worsening in the city.
Back to top
Author Information
Corresponding Author: Jonathan B. Wallach, New York University Medical Center
School of Medicine, 545 First Ave, Ste 2H, New York, NY 10016. Telephone:
973-477-4989. E-mail:
Wallach.Jonathan@gmail.com.
Author Affiliation: Mariano J. Rey, New York University School of Medicine,
New York, New York.
Back to top
References
- Steinhauer J. Diabetes rate has doubled, city reports. New York Times.
January 25, 2003: B1.
http://www.nytimes.com/2003/01/25/nyregion/diabetes-rate-has-doubled-city-reports.html?sec=health.
Accessed March 26, 2009.
- Mokdad AH, Ford ES, Bowman BA, Dietz WH, Vinicor F, Bales VS, et al.
Prevalence of obesity, diabetes, and obesity-related health risk factors,
2001. JAMA 2003;289(1):76-9.
- Ford ES, Williamson DF, Liu S.
Weight change and diabetes incidence:
findings from a national cohort of US adults. Am J Epidemiol
1997;146:214-22.
- National diabetes fact sheet: general information and national estimates
on diabetes in the United States, 2007. Atlanta (GA): Centers for Disease
Control and Prevention; 2008.
http://www.cdc.gov/diabetes/pubs/pdf/ndfs_2007.pdf. Accessed March 27, 2009.
- Health and Nutrition Examination Survey. New York (NY): New York City
Department of Health and Mental Hygiene; 2004.
https://a816-health3ssl.nyc.gov/NYCHANES/index.html. Accessed June 6, 2008.
- New York City community health survey. New York (NY): New York City
Department of Health and Mental Hygiene; 2003.
https://a816-health3ssl.nyc.gov/CHS/index2003.html. Accessed June 6, 2008.
- Health disparities in New York City. New York (NY): New York City
Department of Health and Mental Hygiene; 2004.
http://nyc.gov/html/doh/downloads/pdf/epi/disparities-2004.pdf. Accessed
June 6, 2008.
- One in 6 New York City adults is obese. New York City Department of
Health and Mental Hygiene. NYC Vital Signs 2003;2(7).
http://nyc.gov/html/doh/downloads/pdf/survey/survey-2003obesity.pdf.
Accessed March 27, 2009.
-
Shai I, Jiang R, Manson JE, Stampfer MJ, Willett WC, Colditz GA, et al.
Ethnicity, obesity, and risk of type 2 diabetes in women. Diabetes Care
2006;29:1585-90.
- Stein R. New York City starts to monitor diabetics. The Washington Post.
January 11, 2006:AO3.
http://www.washingtonpost.com/wp-dyn/content/article/2006/01/10/AR2006011001625.html.
Accessed March 27, 2009.
- Kim C, Newton KM, Knopp RH. Gestational diabetes and the incidence of
type 2 diabetes: a systematic review. Diabetes Care 2002;25(10):1862-8.
http://care.diabetesjournals.org/cgi/content/abstract/25/10/1862?etoc.
Accessed March 27, 2009.
- Thorpe LE, List DG, Marx T, May L, Helgerson SD, Frieden TR.
Childhood
obesity in New York City elementary school students. Am J Public Health
2004;94(9):1496-1500.
Back to top
|
|
