
|
|
Volume 4: No.
4, October 2007
ORIGINAL RESEARCH
Binge Drinking and Occupation, North Dakota, 2004–2005
Dwayne W. Jarman, DVM, MPH, Timothy S. Naimi, MD, MPH, Stephen P. Pickard, MD, Walter Randolph Daley, DVM,
MPH, Anindya K. De, PhD
Suggested citation for this article: Jarman DW, Naimi TS, Pickard SP, Daley WR, De AK. Binge drinking and occupation, North Dakota, 2004–2005. Prev Chronic Dis
2007;4(4). http://www.cdc.gov/pcd/issues/2007/
oct/06_0152.htm. Accessed [date].
PEER REVIEWED
Abstract
Introduction
Binge drinking is a leading cause of preventable death and results in employee absenteeism and lost productivity. Knowledge about the prevalence of binge drinking among employees of different occupations is limited.
Methods
We assessed the prevalence of binge drinking (i.e., consuming five or more drinks per occasion during the previous 30 days) by primary occupation using data from the 2004–2005 North Dakota Behavioral Risk Factor Surveillance System. We used logistic regression to assess the association between binge drinking and primary occupation.
Results
Overall, 24.1% (95% confidence interval [CI], 22.5–25.7) of North Dakota workers reported binge drinking. The prevalence was highest among farm or ranch employees (45.3%; 95% CI,
28.3–63.4), food or drink servers (33.4%; 95% CI, 23.9–44.4), and farm or ranch owners (32.5%; 95% CI, 26.3–39.4). The prevalence was lowest among health care workers (13.2%; 95% CI,
10.3–16.8). Compared with health care workers, the adjusted odds of binge drinking were highest among farm or ranch employees (adjusted odds ratio [AOR], 2.2; 95% CI, 0.9–5.5), food or drink servers (AOR, 2.1; 95% CI, 1.1–4.0), and farm or ranch owners (AOR, 1.7; 95% CI, 1.1–2.6). Health insurance coverage was lowest among employees in occupations with the highest
prevalence of binge
drinking.
Conclusion
We found occupational differences in the prevalence of binge drinking among employees in North Dakota. Many occupational categories had a high prevalence of binge drinking. We recommend the implementation of both employer-sponsored and population-based interventions to reduce binge drinking among North Dakota workers, particularly
because employees in occupations with the highest rates of binge
drinking had the lowest rates of health insurance coverage.
Back to top
Introduction
Excessive drinking, including high per-occasion alcohol consumption (e.g.,
binge drinking) and high average daily alcohol consumption, is the third leading
cause of preventable death in the United States (1). In 2001, excessive alcohol
consumption accounted for 75,000 deaths (2). In 1998, the direct and indirect
economic cost of excessive alcohol consumption was $185 billion (3).
Binge drinking, defined as consuming five or more drinks on one or more occasions during the previous 30 days (4), is the most common type of excessive drinking and accounts for more than half of all alcohol-related deaths (2). Binge drinking
is an important risk factor for unintentional injury, interpersonal violence, suicide, and adverse reproductive outcomes (2,5-11).
Work-related consequences of binge drinking include unintentional injuries, elevated health care costs, poor job performance, and absenteeism as a result of alcohol-induced hangover or other alcohol-related problems (12-16). Furthermore, lost productivity accounts for more than 70% of all costs attributable to excessive drinking (3). However, despite the
substantial effects of binge drinking
on employers and their employees, knowledge about the association between occupation and binge drinking is limited. Assessment of occupation-specific risk for binge drinking can provide information for guiding efforts to reduce binge drinking among workers (17-19).
North Dakota consistently has one of the highest rates of binge drinking in the nation (20). The purpose of this study was to assess rates of binge drinking and frequent binge drinking among occupational groups in North Dakota. Because occupation may determine health care coverage and therefore
affect the availability of effective clinical interventions (e.g., brief counseling,
intervention), we assessed health care access among North Dakota workers who reported binge drinking.
Back to top
Methods
The Behavioral Risk Factor Surveillance System (BRFSS) is an ongoing, state-based, random-digit–dialed telephone survey coordinated by the Centers for Disease Control and Prevention (CDC).
The survey uses a disproportionate stratified sampling method and is conducted annually by all states (4). Information on health risk behaviors and preventive health practices
related to the leading causes of death among the U.S. civilian, noninstitutionalized population aged 18 years or older is obtained from BRFSS data (21). Details of the BRFSS sampling methods, purpose, and method of analysis
are published elsewhere (4,21,22). We conducted a population-based cross-sectional study of the association between binge drinking and primary occupation in North Dakota
using 2004–2005 BRFSS data.
To our knowledge, North Dakota is the only state that collects information on occupation and binge drinking using the BRFSS. The BRFSS survey assesses employment status with the following question: “Are you currently: employed for wages, self-employed, out of work for more than 1 year, out of work for less than 1 year, a homemaker, a student, retired, or unable to work?” We defined
people as “employed” if they reported their employment status as either “employed for wages” or “self-employed.” Respondents not meeting criteria for being employed were defined as “not employed.”
The North Dakota BRFSS began collecting information on occupation in 2004.
Data on primary occupation were collected using the following question: “Which of the following most accurately describes the type of work or business you currently work in most often?” Occupational categories selected from the largest known employment categories in the state included state government employee, other
government employee, farmer or rancher (i.e., farm or ranch owner), other farm or ranch worker (i.e., farm or ranch employee), manufacturing, health care, food or drink server (e.g., waiter, waitress, bartender), wholesale or retail sales, financial sales, and other. We defined “workers” as all employed respondents
who selected one of nine occupation responses or the
“other” occupation response. Employed respondents who did not provide their occupation were excluded from all occupation-related subanalyses.
We defined binge drinkers as adults who had consumed alcohol during the previous month and who answered “one”
or a higher number to the following question: “Considering all types of alcoholic beverages, how many times during the past 30 days did you have five or more drinks on an occasion?” We defined frequent binge drinkers as those who reported binge drinking three or more
times during the previous 30 days; we reported this number of frequent binge drinkers as a proportion of total binge drinking workers. Nonbinge drinkers were defined as either respondents who had not drunk alcohol during the previous 30 days (i.e., nondrinkers) or respondents who had drunk alcohol during the previous 30 days but who did not binge drink.
We also assessed health insurance coverage and usage among binge drinkers. We defined “having health care” as a yes response to the following question: “Do you have any kind of health care coverage, including health insurance, prepaid plans such as HMOs, or government plans such as Medicare?” Inability to access a doctor was defined as any respondent answering no to the
following question: “Was there a time in the past 12 months when you needed to see a doctor but could not because of the cost?” (23).
We calculated both the crude and age group– and sex-standardized prevalence of binge drinking by occupation; we standardized the prevalence of binge drinking for age group and sex covariates to the North Dakota adult population aged 18 years or older to remove the effects of these factors on the prevalence of binge drinking by occupation in North Dakota (24).
We used logistic regression to calculate the crude and adjusted odds of binge drinking by occupation; we used health care workers as the referent group. We controlled for sex, age group, marital status, annual income, and education as potential confounders when measuring the adjusted odds of binge drinking by occupation. We weighted the analysis to generalize results to the population of North Dakota.
We conducted analyses using SAS callable SUDAAN version 9.0 (Research Triangle Institute, Research Triangle Park, North Carolina) to account for the complex sample design. We report crude measures unless otherwise noted.
Back to top
Results
A total of 7055 North Dakota adults aged 18 years or older participated in the BRFSS for 2004–2005. The total response rate was 62% in 2004 and 58% in 2005. On weighted analysis, 67.5% of North Dakotans were employed, and 93.8% of those who were employed provided information about their primary occupation. Of those who gave information on their occupation, 66.2%
were classified into one of nine occupations, and the remaining 33.8% were classified as “other.”
Overall, 19.8% of all North Dakota adults reported binge drinking on at least one occasion during the previous 30 days (Table 1). The prevalence of binge drinking among employed respondents was higher (24.1%) than the prevalence among nonemployed respondents (10.8%) (odds ratio [OR], 2.6; 95% confidence interval [CI], 2.1–3.3). The odds of binge drinking remained higher
among the employed respondents even after adjusting for age group and sex (OR, 1.6; 95% CI, 1.3–2.0) (data not shown). Compared with nonemployed respondents, employed respondents had a higher prevalence of binge drinking in every stratum of each variable assessed in the study (Table 1).
Among employed respondents, the prevalence of binge drinking varied by occupation, ranging from 13.2% among health care workers to 45.3% among farm or ranch employees (Table 2, Figure 1). Overall, the prevalence of binge drinking exceeded 20% among 7 of the 10 occupational categories, and exceeded 25% in 5 of the 10. The prevalence of binge drinking exceeded 30% for farm or ranch employees,
food or drink servers, and farm or ranch owners, which comprise approximately 14% of the employed
people in North Dakota. After standardizing by age group and sex, the prevalence of binge drinking remained the highest among farm or ranch employees and lowest among health care workers.
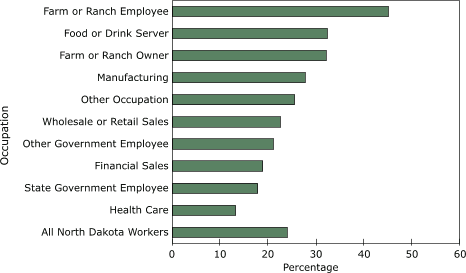
Figure 1. Prevalence of binge drinking by occupation, North Dakota, 2004–2005. Binge drinking was defined as having consumed five or more drinks on one or more occasions during the previous 30 days.
[A tabular version of this graph is also
available.]
Farm or ranch employees, food or drink servers, farm or ranch owners, manufacturing employees, employees who selected “other” occupation, wholesale or retail sales employees, and other government employees had significantly higher odds of binge drinking compared with health care workers (Table 3). We found that marital status, age group, and sex accounted for most of the difference
in the crude and adjusted odds among participants in many occupations. Even after adjusting for multiple potential confounders, the odds of binge drinking remained significantly higher among food or drink servers, farm or ranch owners, and among people employed in the “other” occupation category compared with health care workers.
More than one-third (37.6%; 95% CI, 33.7–41.6) of binge drinking workers reported frequent binge drinking (three or more binge drinking occasions during the past 30 days) (data not shown). Among binge drinkers, the prevalence of frequent binge drinking was generally more common among
participants in occupations that also had a high prevalence of binge drinking (Figure 2). For example, half of all
binge-drinking farm or ranch owners, their employees, and food or drink servers (the three occupations with the highest prevalence of binge drinking) were frequent binge drinkers.
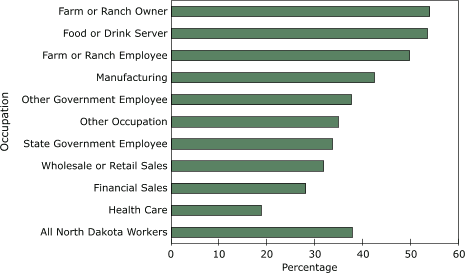
Figure 2. Prevalence of frequent binge drinking by occupation among workers who reported binge drinking, North Dakota, 2004–2005. Binge drinking was defined as having consumed five or more drinks on one or more occasions during the previous 30 days. Frequent binge drinking was defined as binge drinking on three or more occasions during the previous 30 days.
[A tabular version of this graph is also
available.]
Among workers who reported binge drinking, 81.3% had some form of health care coverage (Table 4), and occupational groups with the lowest levels of coverage were the most likely to binge drink (Table 3). Although only 8.4% of workers who binge drink reported cost as a barrier to seeking medical care, workers who binge drink and who lack health insurance were more likely to report cost as
a barrier to health care than were workers with health care coverage (26.6% vs 4.2%) (data not shown). Among workers who binge drink, similar proportions of frequent (three or more binge drinking occasions per month) and nonfrequent binge drinkers reported having health
care coverage (75.9% vs 84.5%) and that cost was a barrier to seeking medical care (10.0% vs 7.4%) (data not shown).
Back to top
Discussion
Excessive alcohol consumption, including binge drinking, has enormous implications for business and the economy. Lost productivity accounts for approximately three-quarters of the costs of excessive drinking in the United States (3). In this study, we found that approximately one-quarter of all employed people in North Dakota reported binge drinking at least once in the past month, and that
employed people were more likely to report binge drinking than those who were nonemployed, even after adjusting for age and sex. One-third of employed people who binge drink reported frequent binge drinking. Furthermore, people employed
in occupations with the highest adjusted odds of binge drinking also had the lowest rates of health care coverage.
To our knowledge, this is the first population-based study to examine the relationship between binge drinking and occupation. Although no other study has focused on binge drinking, other studies support our findings that
people in certain occupational groups (e.g., food or drink servers, agricultural workers) have higher rates of alcohol-related diagnoses compared with
people in other occupational
groups (e.g., health care workers) (25-27). Further work should be done to confirm
whether these findings are similar in other states or nationally and to examine binge drinking rates
for people in other occupations that we were unable to assess.
Although we did not establish a temporal relationship between work and binge drinking, binge drinking among workers can negatively
affect the employer, regardless of when the binge drinking occurs. Binge drinking is associated with adverse occupational outcomes (7,12,28), and the presence and frequency of binge drinking is a strong predictor of occupational or industrial-related
injuries (14). In addition, medical- and lost productivity–related costs are incurred by employers, regardless of the fact that most alcohol consumption occurs outside typical working hours (27).
It was impossible to establish a causal association between occupation and binge drinking during this cross-sectional study. Furthermore, even after controlling for established risk factors for binge drinking, some occupation-specific differences in binge drinking are probably due to characteristics of employees in certain occupations rather than the occupations themselves. Examples of key
factors that we could not assess included familial country of origin, religious affiliation,
history of alcohol use before employment, and coworker attitudes toward risk-taking behaviors (29).
Employment in certain occupations may be a risk factor for binge drinking. Mandell
et al found a cause-and-effect relationship between occupation and alcohol
dependence (26), which might indicate a causal relationship between occupation
and binge drinking. For example, workers employed in settings where alcohol is
sold typically have easy access to alcohol and might work in social climates
that are accepting of excessive drinking. In addition, workers who are
self-employed or whose jobs are socially isolating might be at risk for excessive drinking as a result of a lack of peer feedback that discourages excessive drinking or drinking on the job. Additionally, during off-season times when less work is available among workers employed in seasonal
occupations (i.e., winter for farm or ranch owners and employees), boredom and inactivity might contribute to binge drinking.
This study has some limitations. Our prevalence estimates of binge drinking are
probably conservative, because alcohol use is typically underreported by respondents (30) and because nonrespondents
may drink more excessively than survey respondents. However, whether underreporting differs between employed respondents and nonemployed respondents or if certain occupational
groups might be more likely to underreport compared with other groups is unknown (26).
Furthermore, because our sample size required us to combine certain occupations into relatively broad categories and because other occupations are not common in North Dakota and therefore not represented among North Dakota BRFSS respondents, we might have omitted occupations with a high prevalence of
binge drinking. Finally, our sample and conclusions are restricted to North Dakota; an analysis of data collected in other states might have produced different results.
We recommend the aggressive implementation of effective population-based policy interventions to reduce excessive drinking,
because binge drinking was common among most occupational groups and because a substantial proportion of workers in some occupations with particularly high rates of binge drinking were most likely to lack health insurance or report cost as a barrier to
health care. Examples of
effective policy interventions include increasing alcohol excise taxes, limiting
the density of alcohol outlets and hours of sale, and enforcing laws prohibiting the sale of alcohol to
people already intoxicated
(31-35). Employer-based programs (e.g., employee assistance programs, employee wellness programs) are additional strategies that can be effective in reducing binge drinking among employees (17,18). However, self-employed workers or workers in small businesses often do not have such programs available to them.
Although many employed people might lack access to worksite health programs, the majority of workers in this analysis reported having health insurance coverage, and only one-tenth of workers reported that cost was a barrier to accessing health care. The U.S. Preventive Services Task Force recommends routine screening and brief counseling interventions (SBI) in primary-care settings for alcohol
“misuse” (i.e., excessive drinking) (36). In controlled trials, SBI typically
reduces total alcohol consumption by 20% and also reduces the number of binge-drinking episodes (36,37). However, despite the fact that a recent report by the Partnership for Prevention determined that SBI for alcohol misuse is one of the most valuable of the recommended clinical preventive
services, SBI is one of the least commonly performed of these services, and less than 20% of employer-sponsored health plans cover SBI (38). The National Business Group on Health, a coalition of large businesses that purchase health care coverage for their employees, recently called for parity in coverage between physical problems (e.g., diabetes) and mental health and substance abuse
problems (39). Efforts to work with businesses to negotiate SBI coverage when purchasing health insurance for their employees will be another important way
to help prevent and reduce binge drinking among employed people.
Back to top
Acknowledgments
We acknowledge Hannah L. Gould with CDC, Epidemic Intelligence Service, assigned to Coordinating Center for Infectious Diseases, National Center for Zoonotic, Vector-Borne, and Enteric Diseases, Fort Collins, Colorado.
Back to top
Author Information
Corresponding Author: Dwayne W. Jarman, DVM, MPH, Centers for Disease Control
and Prevention (CDC), Epidemic Intelligence Service Officer assigned to the North Dakota Department of Health. Dr Jarman currently works with
CDC as a Preventive Medicine Fellow and can be contacted at the following address: Alcohol Team, Emerging Investigations and Analytic Methods Branch, Division of Adult and Community Health, National Center for Chronic Disease Prevention and Health Promotion, CDC, 4770 Buford Highway, NE, Mailstop K-67, Atlanta, GA 30341-3717. E-mail: dnj8@cdc.gov. Telephone: 770-488-2401.
Author Affiliations: Timothy S. Naimi, Division of Adult and Community Health, National Center for Chronic Disease Prevention and Health Promotion,
CDC, Atlanta, Georgia; Stephen P. Pickard, Division of Emergency Preparedness and Response, National Center for Public Health Informatics,
CDC, CDC Career Field Officer, North Dakota Department of
Health, Bismarck, North Dakota; Walter W. Randolph Daley, Anindya K. De, Office of Workforce and Career Development, Career Development Division,
CDC, Atlanta, Georgia.
Back to top
References
- Mokdad AH, Marks JS, Stroup DF, Gerberding JL.
Actual causes of death in the United States, 2000.
[Published erratum in: JAMA 2005;293(3):293-4; JAMA 2005;293(3):298]. JAMA 2004;291(10):1238-45.
- Centers for Disease Control and Prevention.
Alcohol-attributable deaths and years of potential life lost — United States, 2001. MMWR Morb Mortal Wkly Rep 2004;53(37):866-70.
- Harwood H. Updating estimates of the economic costs of alcohol abuse in the United States:
estimates, update methods, and data. Bethesda (MD): National Institute on Alcohol Abuse and Alcoholism; 2000. http://www.alcoholcostcalculator.org/business/about/?page=1.*
Updated December 2000. Accessed December 21, 2006.
- Jiles R, Hughes E, Murphy W, Flowers N, McCracken M, Roberts H, et al.
Surveillance for certain health behaviors among states and selected local areas — Behavioral Risk Factor Surveillance System, United States, 2003. MMWR Surveill Summ 2005;54(8):1-116.
- Neuner B, Miller P, Maulhardt A, Weiss-Gerlach E, Neumann T, Lau A, et al.
Hazardous alcohol consumption and sense of coherence in emergency department patients with minor trauma. Drug Alcohol Depend 2006;82(2):143-50.
- Lipsky S, Caetano R, Field CA, Larkin GL.
Is there a relationship between victim and partner alcohol use during an intimate partner violence event? Findings from an urban emergency department study of abused women. J Stud Alcohol 2005;66(3):407-12.
- Tenth special report to the U.S. Congress on alcohol and health. Bethesda (MD):
U.S. Department of Health and Human Services, Public Health Service,
National Institutes of Health, National Institute on Alcohol Abuse and
Alcoholism. http://pubs.niaaa.nih.gov/publications/10report/intro.pdf.
Updated June 2000. Accessed December 21, 2006.
- Corrao G, Bagnardi V, Zambon A, La Vecchia C.
A meta-analysis of alcohol consumption and the risk of 15 diseases. Prev Med 2004;38(5):613-9.
- Iyasu S, Randall LL, Welty TK, Hsia J, Kinney HC, Mandell F, et al.
Risk factors for sudden infant death syndrome among northern plains Indians.
[Published erratum in: JAMA 2003;289(3):303]. JAMA 2002;288(21):2717-23.
- Naimi TS, Lipscomb LE, Brewer RD, Gilbert BC.
Binge drinking in the preconception period and the risk of unintended pregnancy: implications for women and their children. Pediatrics 2003;111(5 Part 2):1136-41.
- Floyd RL, Sidhu JS.
Monitoring prenatal alcohol exposure. Am J Med Genet C Semin Med Genet 2004;127(1):3-9.
- Frone MR.
Prevalence and distribution of alcohol use and impairment in the workplace: a U.S. national survey. J Stud Alcohol 2006;67(1):147-56.
- Wiese JG, Shlipak MG, Browner WS.
The alcohol hangover. Ann Intern Med 2000;132(11):897-902 .
- Conrad KM, Furner SE, Qian Y.
Occupational hazard exposure and at risk drinking. AAOHN J 1999;47(1):9-16.
- Finnigan F, Schulze D, Smallwood J, Helander A.
The effects of self-administered alcohol-induced ‘hangover’ in a naturalistic setting on psychomotor and cognitive performance and subjective state. Addiction 2005;100(11):1680-9.
- Veazie MA, Smith GS.
Heavy drinking, alcohol dependence, and injuries at work among young workers in the United States labor force. Alcohol Clin Exp Res 2000;24(12):1811-9.
- Deitz D, Cook R, Hersch R.
Workplace health promotion and utilization of health services: follow-up data findings. J Behav Health Serv Res 2005;32(3):306-19.
- Spicer RS, Miller TR.
Impact of a workplace peer-focused substance abuse prevention and early intervention program. Alcohol Clin Exp Res 2005;29(4):609-11.
- Millstein SG, Marcell AV.
Screening and counseling for adolescent alcohol use among primary care physicians in the United States. Pediatrics 2003;111(1):114-22.
- Behavioral Risk Factor Surveillance System Survey Data. Atlanta (GA): U.S.
Department of Health and Human Services, Centers for Disease Control and
Prevention. http://apps.nccd.cdc.gov/brfss/index.asp. Updated July 17, 2000.
Accessed December 21, 2006.
- Behavioral Risk Factor Surveillance System publication and research. Atlanta (GA):
U.S. Department of Health and Human Services, Centers for Disease Control
and Prevention. http://www.cdc.gov/brfss/pubs/index.htm. Updated July 17,
2000. Accessed December 21, 2006.
- Naimi TS, Brewer RD, Mokdad A, Denny C, Serdula MK, Marks JS.
Binge drinking among U.S. adults. JAMA 2003;289(1):70-5.
- 2005 CDC Behavioral Risk Factor Surveillance System Survey Questionnaire
Codebook. Atlanta (GA): U.S. Department of Health and Human Services,
Centers for Disease Control and Prevention. http://ftp.cdc.gov/pub/data/brfss/Codebook_05.rtf.
Updated July 17, 2000. Accessed December 21, 2006.
- SUDAAN example manual, release 9.0. Research Triangle Park (NC): Research
Triangle Institute; 2004. p. 116-9.
- Medhi GK, Hazarika NC, Mahanta J.
Correlates of alcohol consumption and tobacco use among tea industry workers of Assam. Subst Use Misuse 2006;41(5):691-706.
- Mandell W, Eaton WW, Anthony JC, Garrison R.
Alcoholism and occupations: a review and analysis of 104 occupations. Alcohol Clin Exp Res 1992;16(4):734-46.
- The alcohol cost calculator for business. Washington (DC): Ensuring solutions to
alcohol problems; 2005. http://www.alcoholcostcalculator.org/business/about/?page=1.*
Accessed March 1, 2005.
- Kaner EF, Heather N, Brodie J, Lock CA, McAvoy BR.
Patient and practitioner characteristics predict brief alcohol intervention in primary care. Br J Gen Pract 2001;51(471):822-7.
- Neumark YD, Rahav G, Jaffe DH.
Socio-economic status and binge drinking in Israel. Drug Alcohol Depend 2003;69(1):15-21.
- Midanik LT.
Validity of self-reported alcohol use: a literature review and assessment. Br J Addict 1988;83(9):1019-30.
- Hollingworth W, Ebel BE, McCarty CA, Garrison MM, Christakis DA, Rivara FP.
Prevention of deaths from harmful drinking in the United States: the potential effects of tax increases and advertising bans on young drinkers. J Stud Alcohol 2006;67(2):300-8.
- Stout EM, Sloan FA, Liang L, Davies HH.
Reducing harmful alcohol-related behaviors: effective regulatory methods. J Stud Alcohol 2000;61(3):402-12.
- Lenk KM, Toomey TL, Erickson DJ.
Propensity of alcohol establishments to sell to obviously intoxicated patrons. Alcohol Clin Exp Res 2006;30(7):1194-9.
- Wallin E, Andreasson S.
Public opinion on alcohol service at licensed premises: a population survey in Stockholm, Sweden 1999–2000. Health Policy 2005;72(3):265-78.
- Babor TF, Caetano R, Casswell S, Edwards G, Giesbrecht N, Graham K, et al. Alcohol:
no ordinary commodity. Research and public policy. New York
(NY): Oxford University Press; 2003.
- U.S. Preventive Services Task Force.
Screening and behavioral counseling interventions in primary care to reduce alcohol misuse: recommendation statement. Ann Intern Med 2004;140(7):554-6.
- Fleming MF, Mundt MP, French MT, Manwell LB, Stauffacher EA, Barry KL.
Brief physician advice for problem drinkers: long-term efficacy and benefit-cost analysis. Alcohol Clin Exp Res 2002;26(1):36-43.
- Maciosek MV, Coffield AB, Edwards NM, Flottemesch TJ, Goodman MJ, Solberg LI.
Priorities among effective clinical preventive services: results of a systematic review and analysis. Am J Prev Med 2006;31(1):52-61.
- Finch RA, Phillips K. An employer's guide to behavioral health services: a
roadmap and recommendations for
evaluating, designing, and implementing behavioral health services. Washington
(DC): Center for Prevention and Health Services; 2005. http://www.businessgrouphealth.org/pdfs/ executivesummarymentalhealthreport.pdf.*
Accessed March 1, 2005.
Back to top
|
|
