 |
|
|
|
|
|
|
| ||||||||||
|
|
|
|
|
|
|
||||
| ||||||||||
|
|
|
|
|
Persons using assistive technology might not be able to fully access information in this file. For assistance, please send e-mail to: mmwrq@cdc.gov. Type 508 Accommodation and the title of the report in the subject line of e-mail. Monitoring Over-The-Counter Medication Sales for Early Detection of Disease Outbreaks --- New York CityDebjani Das, K. Metzger, R. Heffernan, S. Balter, D. Weiss, F. Mostashari Corresponding author: Debjani Das, New York City Department of Health and Mental Hygiene, 125 Worth St., Box No. CN22A, New York, NY 10013. Telephone: 212-788-4318; Fax: 212-788-5470; E-mail: ddas@health.nyc.gov. Disclosure of relationship: The contributors of this report have disclosed that they have no financial interest, relationship, affiliation, or other association with any organization that might represent a conflict of interest. In addition, this report does not contain any discussion of unlabeled use of commercial products or products for investigational use. AbstractIntroduction: Over-the-counter (OTC) medications are frequently used during the initial phase of illness, and increases in their sales might serve as an early indicator of communitywide disease outbreaks. Since August 2002, the New York City (NYC) Department of Health and Mental Hygiene (DOHMH) has tracked OTC medication sales to enhance detection of natural and intentional infectious disease outbreaks. Objectives: This report describes the surveillance system and presents results from retrospective analyses and a comparison between citywide trends in OTC medication sales and emergency department (ED) visits. Methods: Sales data transmitted daily to DOHMH are categorized into two groups: influenza-like illness (ILI), which includes cough and influenza medications, and gastrointestinal illness (GI), which includes major brand and generic antidiarrheals. Cyclical, linear regression models were used to identify significant (p<0.05) increases in the daily ratio of ILI to analgesics sales (analgesics are used as a denominator in the absence of total sales). Daily and weekly average ratios of GI to analgesic sales were analyzed. Citywide trends in OTC ILI and GI medication sales were compared with ED visits for fever/influenza and diarrhea syndromes. Results: Citywide ILI drug sales were highest during annual influenza epidemics and elevated during spring and fall allergy seasons, similar to trends in the ED fever/influenza syndrome. ILI sales did not consistently provide earlier warning than the ED system of communitywide influenza. GI drug sales increased during the fall and peaked during early winter and after the blackout of August 2003. Unlike ED diarrheal visits, GI medication sales did not substantially increase during late winter (February-March). Conclusion: Citywide OTC medication sales can provide indications of communitywide illness, including annual influenza epidemics. Antidiarrheal medication sales were more sensitive to increases in GI caused by norovirus and influenza than illness caused by rotavirus. OTC medication sales can be considered as an adjunct syndromic surveillance system but might not be as sensitive as ED systems. IntroductionOver-the-counter (OTC) medications are commonly taken before or instead of seeking medical care (1--3). OTC medication sales, therefore, might be an early indicator of communitywide illness. One of the first signs of a large waterborne cryptosporidiosis outbreak in Milwaukee in 1993 was newspaper reports that local pharmacies had sold out of antidiarrheal medications (4,5). A retrospective report confirmed that increases in sales of Immodium® (McNeil Consumer and Specialty Pharmaceuticals, Fort Washington, Pennsylvania), Pepto Bismol® (Proctor and Gamble, Cincinnati, Ohio), and Kaopectate® (Pfizer, New York, New York) were the earliest indicators of widespread illness, suggesting that prospective monitoring of OTC medication sales might have resulted in earlier detection of the outbreak (4). In England, increases in electronic-point-of-sale pharmacy sales occurred 2 weeks before an increase in emergency department (ED) visits during the winter (6), and correlations between OTC antinausea and antidiarrhea medication sales and ED admissions have been reported (7). New York City (NYC) began monitoring OTC medication sales in 1996 as part of its waterborne disease surveillance program. Aggregate, weekly counts of OTC antidiarrheal medications sold were transmitted from one large pharmacy chain to the Department of Environmental Protection and reviewed weekly (8). In 2000, the New York City Department of Health and Mental Hygiene (DOHMH) asked pharmaceutical retailers to establish daily, automatic data transmission to improve timeliness and expand the system to cover medications for influenza-like illness (ILI). This report describes the methods developed during the first 32 months of operation, presents results from a retrospective analysis of data from that period, and compares citywide trends in OTC medication sales with comparable syndromes from the DOHMH ED syndromic surveillance system (9). Materials and MethodsSince August 2002, OTC medication sales data have been transmitted daily by file transfer protocol (FTP) from a central pharmacy database. Each daily file contains information on the previous day's sales of the following medications: cold drugs, analgesics, vapor rubs (for colds), vitamins, stomach aids, and first aid materials. Data elements include the number of units sold, drug name, department and subdepartment, store location, whether or not the item was on promotion, and the number of units in stock (an indication of whether the item was available for sale that day). Data are checked for completeness, duplicate records, and other errors before being appended to an archive for analysis. Baseline data were obtained beginning in August 2001. Because of the multiple possible names and formulations for each drug and because new items are frequently introduced into the market, a simple and flexible method was sought to categorize drugs into syndrome groups. For the ILI category, the estimated 400 drug names in the cold subdepartment, which accounted for 47% of the total drug sales reported to DOHMH, were examined. To identify the subset of these drug names that was most closely associated with influenza activity, the ratio was calculated of sales during peak influenza season (November 2001--January 2002) to nonpeak season (August 2001--October 2001). These periods were based on the number of positive influenza isolates identified by the World Health Organization (WHO) sentinel laboratories serving NYC (Figure 1). A review of the 50 drugs with the highest ratios suggested that selecting any drug with text strings "flu" or "tussin" in the name would capture most influenza-associated sales. Drugs not included in the ILI category because their sales were not highly correlated with influenza activity included 1) multicold symptom relievers (e.g., Alka Seltzer Plus® [Bayer, Morristown, New Jersey] and Nyquil® [Proctor and Gamble, Cincinnati, Ohio]); 2) decongestants (e.g., Sudafed® [Pfizer, New York, New York]); 3) analgesic brand name cold products (e.g., Tylenol Cold® [McNeil Consumer and Specialty Pharmaceuticals, Fort Washington, Pennsylvania]), and 4) chest rubs (e.g., Vicks Vaporub® [Proctor and Gamble, Cincinnati, Ohio]). For citywide temporal ILI analysis, the outcome was the daily ratio of ILI drug sales to sales of analgesics. When the ratio was used, rather than just the number of ILI sales, noise was reduced in the data by partially controlling for variation in total OTC medication sales volume as a result of store hours, consumer behavior, and other unmeasured factors. Analgesics were chosen as the denominator, because total sales data were not available. Analgesics sales were relatively stable throughout the year and accounted for approximately 26% of sales reported to DOHMH. The analgesic category included the following brand names and their generic equivalents: Advil® (Wyeth Consumer Healthcare, Madison, New Jersey); Aleve® (Bayer, Morristown, New Jersey); Bayer® (Bayer, Morristown, New Jersey); Bufferin® (Bristol-Myers, New York, New York); Ecotrin® (GlaxoSmithKline, Brentford, Middlesex, UK); Excedrin® (Bristol-Myers, New York, New York); Motrin® (McNeil Consumer and Specialty Pharmaceuticals, Fort Washington, Pennsylvania); and Nuprin® (Bristol-Myers, New York, New York). In this report, prospective, daily analyses of the citywide ratio of ILI to analgesics sales for each day during August 1, 2002--March 31, 2005, were mimicked. A cyclical linear regression model computed the difference between the expected and the observed ratios. The model was based on the classic Serfling influenza model as applied previously to NYC ambulance dispatch data (10,11). For each daily analysis, the most recent 7 days of data were censored to ensure that recent increases or decreases in sales would not affect the model. Terms in the model included sine and cosine to capture seasonal cycles, day-of-week (dummy variables with Sunday as reference), holidays, postholidays, promotional sales (the proportion of total sales that were on promotion), and the weekly number of positive influenza A and B isolates identified by NYC's three WHO influenza reference laboratories. Influenza isolate data were censored for the previous 14 days to ensure that recent increases could be attributed to communitywide influenza outbreaks when needed. Holidays were categorized into major winter holidays (Thanksgiving, Christmas, and New Year's Day) and other national holidays (Martin Luther King Day, President's Day, Memorial Day, Independence Day, and Labor Day). If a holiday was on a weekend, the official government work holiday (Friday or Monday) was coded as a holiday. Days after holidays were coded as postholidays. The model also included a measure of recent increases in allergy medication sales to partially control for increases in ILI drug sales associated with the spring and fall allergy seasons. The measure found to be most useful was a zscore recalculated daily as z = (mean daily sales during previous week) -- (mean daily sales during the period 4--10 weeks before date being analyzed)/(standard deviation of daily sales during the period 4 to 10 weeks before date being analyzed). The model-adjusted ratio and confidence limits generated from each daily analysis were plotted (Figure 1). A signal was defined as any observation that exceeded the 95% upper confidence limit of the model. These results were compared with trends in the day-of-week adjusted ratio of ED fever/influenza-like syndrome (Figure 2) (9). To characterize the relative timing of influenza-associated trends in the ED and OTC medication time series, the ED time series was limited to influenza season (October--April), and the correlation was examined between 1) the weekly average ratio of OTC ILI to analgesics and 2) the weekly average ratio of fever/influenza-like syndrome visits to other syndrome visits (for various lag periods ranging from -14 days to +14 days). For the antidiarrheal GI category, common antidiarrheal drugs were identified, including Immodium®, pink bismuth formulas, Kaopectate, Maalox® (Novartis, Basel, Switzerland), and generic antidiarrheals (12). Immodium accounted for the highest volume (51%) of sales in this category. Kaopectate was removed from the GI category because its weekly sales indicated low correlation with weekly sales of Immodium during peak diarrhea season (November 2002--February 2003; Spearman correlation coefficient r2 = 0.46). The ratio of OTC GI sales to analgesics sales and 7-day moving average have been plotted (Figure 3) along with the ratio of ED diarrhea syndrome to other ED visits (9). ResultsDuring the reporting period, August 1, 2002--March 31, 2005, the mean daily total sales reported to DOHMH was 34,883 (standard deviation [SD] = 9,475). Mean daily sales for ILI, GI, and analgesics were 2,383 (SD = 1,229); 1,132 (SD = 231); and 6,638 (SD = 1,249), respectively. A total of 99% of sales were reported to DOHMH by the next calendar day. Citywide trends in the ratio of ILI to analgesic sales followed a consistent cyclical pattern with highs in the winter and lows in the summer (Figure 1). Within these annual cycles, observed increases were associated with epidemic influenza and the spring and fall allergy seasons. A series of 31 signals over 38 days occurred during the 2003--04 peak influenza season. Similarly, 48 signals occurred over 57 days during the 2004--05 peak influenza season. Ten additional signals occurred during April--June 2003 (Figure 1). ILI trends were compared with ED visits classified under the fever/influenza-like syndrome (Figure 2). Overall, the weekly ratio of ILI to analgesics sales was highly correlated with the weekly ratio fever/influenza-like syndrome visits to other syndrome visits (r2 = 0.60; p<0.001). Slightly lower correlations were identified by moving the OTC time series forward and backward in time by 7 and 14 days in relation to the ED fever/influenza time series (14 days before, r2 = 0.55; 7 days before, r2 = 0.59; 7 days after, r2 = 0.54; and 14 days after, r2 = 0.44). The arrival of communitywide influenza for the 2004--05 season was signaled by ED fever/influenza surveillance in late November 2004, whereas the first series of OTC signals began 6 days later. During the 2003--04 peak influenza season, the ILI ratio doubled and the ED fever-influenza ratio tripled. The series of consecutive ED signals associated with this increase began 2--3 weeks earlier than the first ILI signals (Figure 2). No overlapping signals occurred during the mild 2002--03 influenza season (Figure 2). Trends in the ratio of GI sales to analgesic sales are plotted against the ratio of ED GI visits to other visits (Figure 3). The weekly ratio of GI to analgesics sales was a substantially lower correlation with the weekly ratio ED GI to other visits (r2 = 0.24; p<0.005). Increases in both systems were detected in late autumn (coinciding with documented institutional norovirus outbreaks and suspected communitywide norovirus activity), during peak influenza, and during the blackout in August 2003. Although the most significant increases in ED GI visits occurred annually during late winter (February--March), no corresponding increase in GI sales was observed. Increases during the summer in GI sales were not accompanied by increases in ED GI visits. DiscussionIn the first 32 months of OTC surveillance in NYC, the system served as an adjunct to other indications of citywide illness. Sustained, statistically significant increases in ILI drug sales were observed during annual influenza epidemics, and increases in GI drug sales occurred during fall norovirus season and immediately after the August 2003 blackout. No localized disease outbreaks were detected with the system in any syndrome. In addition, although the purchase of OTC medications is hypothesized to occur earlier in the course of illness than visits to a health provider, a consistent pattern was not observed when OTC sales were compared with ED visits. Multiple factors might contribute toward the challenges of OTC syndromic surveillance. The high rate of background sales unrelated to illness, which might include consumer "stockpiling" of OTC medicines, obscures purchases for acute illness. Differences in store hours and local consumer behavior add to the variance in sales, posing challenges to data modeling and spatial analysis to detect local clustering in OTC sales. Drugs comprise multiple formulations, and new drugs enter the market regularly, making syndrome categorization difficult. Perhaps the most challenging problem of routine OTC surveillance is how to respond to signals. No information is available concerning the person purchasing the medication, and direct investigation is not possible either with individual pharmacies or consumers. Despite these challenges in multiple syndromic surveillance systems, in the United States, OTC sales data are used. The Electronic Surveillance for the Early Notification of Community-based Epidemics (ESSENCE II) project is based on an electronic medical chart system that captures both medical visits and OTC and prescription sales (13). A key advantage of the system is that it links OTC sales, prescription sales, and medical visit information in one system, allowing for patient-level follow-up. Drugs were categorized into syndromes by correlating discharge diagnoses with drugs purchased or prescribed. A limitation of the system is that it is restricted to military personnel and their families. Another system, the National Retail Data Monitor (NRDM) operated by the University of Pittsburgh, receives data daily from >15,000 retail stores nationwide (14,15). Drugs are grouped into 18 categories (e.g., antidiarrhea, antifever, and cold relief) and can be viewed through a website interface by public health authorities for aberrations in sales within their region. NRDM has detected both communitywide influenza and at least one localized GI outbreak, which was identified based on increases in electrolyte sales, which NYC does not track (16). ConclusionOTC syndromic surveillance might be useful as an early indicator of disease outbreaks. To date in NYC, however, the system has served primarily to corroborate large-scale illness trends detected in other syndromic disease outbreak systems. Future possible enhancements include obtaining the total number of transactions, by store by day, for use as a denominator to better control for unmeasured consumer behavior. In addition, to improve coverage, the feasibility of integrating local systems with data received from the NRDM system is being evaluated (14). DOHMH has requested to expand the list of drugs to include pediatric formulations, including electrolyte products; the current ILI and GI categories focus on adult formulations. The use of OTC surveillance for disease outbreak detection in NYC should be increased as these improvements are implemented. References
Figure 1 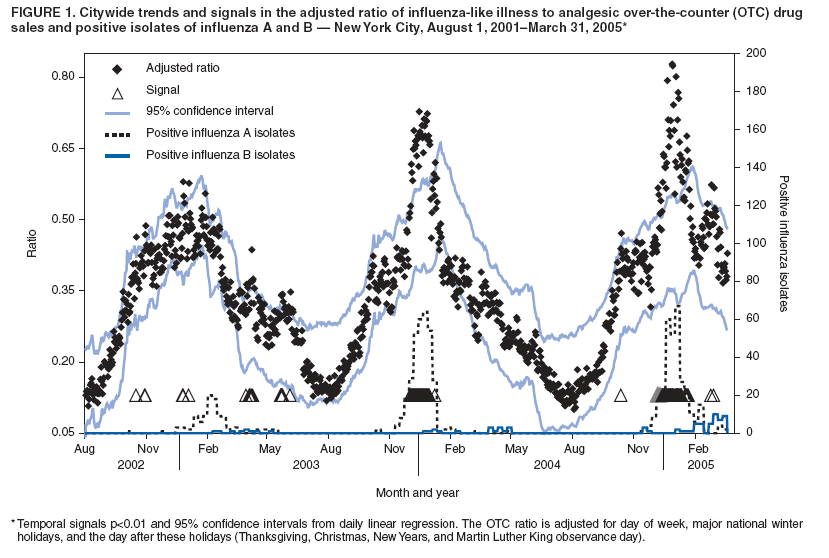 Return to top. Figure 2 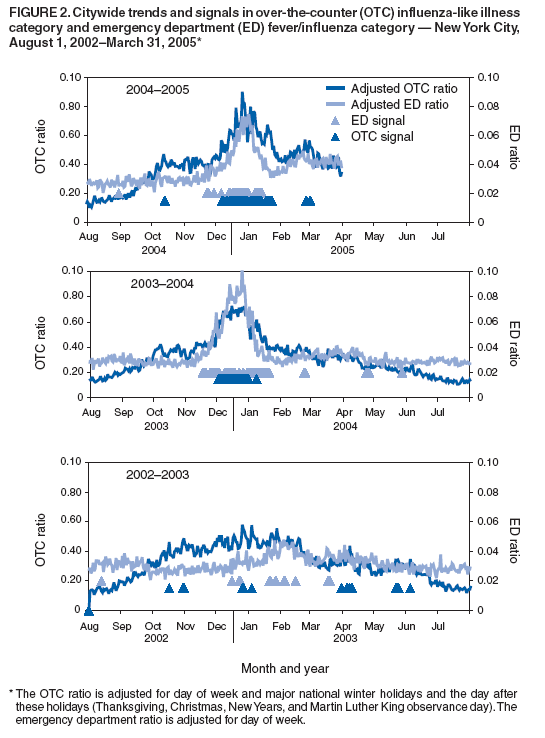 Return to top. Figure 3 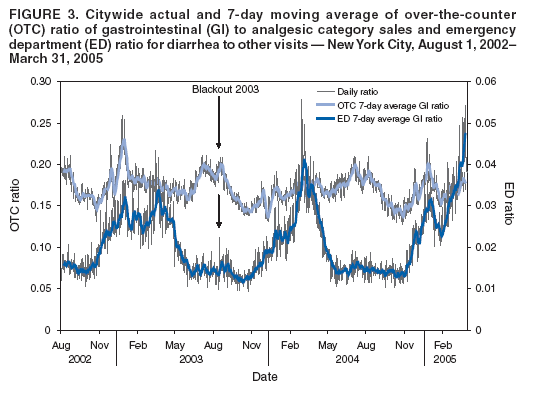 Return to top.
Disclaimer All MMWR HTML versions of articles are electronic conversions from ASCII text into HTML. This conversion may have resulted in character translation or format errors in the HTML version. Users should not rely on this HTML document, but are referred to the electronic PDF version and/or the original MMWR paper copy for the official text, figures, and tables. An original paper copy of this issue can be obtained from the Superintendent of Documents, U.S. Government Printing Office (GPO), Washington, DC 20402-9371; telephone: (202) 512-1800. Contact GPO for current prices. **Questions or messages regarding errors in formatting should be addressed to mmwrq@cdc.gov.Date last reviewed: 8/5/2005 |
|||||||||
|