Skip Navigation LinksSkip Navigation Links
Centers for Disease Control and Prevention
Safer Healthier People
Blue White
Blue White
bottom curve
CDC Home Search Health Topics A-Z spacer spacer
spacer
Blue curve MMWR spacer
spacer
spacer

Persons using assistive technology might not be able to fully access information in this file. For assistance, please send e-mail to: mmwrq@cdc.gov. Type 508 Accommodation and the title of the report in the subject line of e-mail.

Prevalence of Selected Risk Behaviors and Chronic Diseases --- Behavioral Risk Factor Surveillance System (BRFSS), 39 Steps Communities, United States, 2005

Fred Ramsey, MS1
Ann Ussery-Hall, MPH2
Danyael Garcia, MPH3
Goldie McDonald, PhD1
Alyssa Easton, PhD1
Maisha Kambon, MPH3
Lina Balluz, ScD1
William Garvin 1
Justin Vigeant3
1
Division of Adult and Community Health, National Center for Chronic Disease Prevention and Health Promotion
2Ginn Group, Atlanta, Georgia
3Northrop Grumman, Atlanta, Georgia

Corresponding author: Ann Ussery-Hall, MPH, Division of Adult and Community Health, National Center for Chronic Disease Prevention and Health Promotion, CDC, 4770 Buford Hwy, N.E., MS K-93, Atlanta, GA 3041-3717. Telephone: 770-488-8636; Fax: 770-488-8488; E-mail: aussery@cdc.gov.

Abstract

Problem: Behavioral risk factors (e.g., tobacco use, poor diet, and physical inactivity) can lead to chronic diseases. In 2005, of the 10 leading causes of death in the United States, seven (heart disease, cancer, stroke, chronic lower respiratory diseases, diabetes, Alzheimer's disease, and kidney disease) were attributable to chronic disease. Chronic diseases also adversely affect the quality of life of an estimated 90 million persons in the United States, resulting in illness, disability, extended pain and suffering, and major limitations in daily living.

Reporting Period Covered: 2005.

Description of the System: CDC's Steps Program funds 40 selected U.S. communities to address six leading causes of death and disability and rising health-care costs in the United States: obesity, diabetes, asthma, physical inactivity, poor nutrition, and tobacco use. In 2005, a total of 39 Steps communities conducted a survey to collect adult health outcome data. The survey instrument was a modified version of the Behavioral Risk Factor Surveillance System (BRFSS) survey, a community-based, random-digit--dialing telephone survey with a multistage cluster design. The survey instrument collected information on health risk behaviors and preventive health practices among noninstitutionalized adults aged >18 years.

Results: Prevalence estimates of risk behaviors and chronic conditions varied among the 39 Steps communities that reported data for 2005. The proportion of the population that achieved Healthy People 2010 (HP 2010) objectives also varied among the communities. The estimated prevalence of obesity (defined as having a body mass index [BMI] of >30.0 kg/m² as calculated from self-reported weight and height) ranged from 15.6% to 44.0%. No communities reached the HP2010 objective of reducing the proportion of adults who are obese to 15.0%.

The prevalence of diagnosed diabetes (excluding gestational diabetes) ranged from 4.3% to 16.6%. Eighteen communities achieved the HP2010 objective to increase the proportion of adults with diabetes who have at least an annual foot examination to 75.0%; five communities achieved the HP2010 objective to increase the proportion of adults with diabetes who have an annual dilated eye examination to 75.0%.

The prevalence of reported asthma ranged from 7.0% to 17.6%. Among those who reported having asthma, the prevalence of having no symptoms of asthma during the preceding 30 days ranged from 15.4% to 40.3% for 10 communities with sufficient data for estimates. The prevalence of respondents who engaged in moderate physical activity for >30 minutes at least five times a week or who reported vigorous physical activity for >20 minutes at least three times a week ranged from 42.0% to 62.2%. The prevalence of consumption of fruits and vegetables at least five times a day ranged from 15.6% to 30.3%.

The estimated prevalence among respondents aged >18 years who reported having smoked >100 cigarettes in their lifetime and who were current smokers on every day or some days at the time of the survey ranged from 11.0% to 39.7%. One community achieved the HP2010 objective to reduce the proportion of adults who smoke to 12.0%. Among smokers, the prevalence of having stopped smoking for >1 day as a result of trying to quit smoking during the previous 12 months ranged from 47.8% to 63.3% for 31 communities. No communities reached the HP2010 objective of increasing smoking cessation attempts by adult smokers to 75%.

Interpretation: The findings in this report indicate variations in health risk behaviors, chronic conditions, and use of preventive health screenings and health services. These findings underscore the continued need to evaluate intervention programs at the community level and to design and implement policies to reduce morbidity and mortality caused by chronic disease.

Public Health Action: Steps BRFSS data can be used to monitor the prevalence of specific health behaviors, diseases, conditions, and use of preventive health services. Steps Program staff at the national, state, local, and tribal levels can use BRFSS data to demonstrate accountability to stakeholders, monitor progress in meeting program objectives, focus programs on activities with the greatest promise of results, identify opportunities for strategic collaboration, and identify and disseminate successes and lessons learned.

Introduction

Behavioral risk factors (e.g., tobacco use, poor diet, and physical inactivity) can lead to chronic diseases (e.g., diabetes, asthma, and obesity) (1). In 2005, of the 10 leading causes of death in the United States, seven (heart disease, cancer, stroke, chronic lower respiratory diseases, diabetes, Alzheimer's disease, and kidney disease) were attributable to chronic diseases, and chronic diseases affect the quality of life of an estimated 90 million U.S. residents (2). The estimated direct and indirect annual costs of diabetes, asthma, and obesity are $132 billion for diabetes (2,3), $16.1 billion for asthma (4), and $118 billion for obesity (5). Diabetes, asthma, and obesity largely can be prevented and controlled through the modification of certain interrelated risk behaviors (e.g., exercising regularly, eating a healthy diet, and avoiding tobacco use and exposure). To respond to the chronic disease burden, CDC's Steps Program uses a population-based approach that addresses multiple determinants of health. Key elements of this approach include implementing evidence-based interventions, responding to community needs, reaching diverse population groups, working across multiple sectors (e.g., schools, work sites, health care, and the community), and creating nontraditional partnerships (e.g., with transportation and cooperative extension services). All of these elements serve to accelerate positive health changes in communities and reduce chronic disease.

CDC's Steps Program operates a cooperative agreement that provides funding to 40 communities nationwide to support evidence-based community interventions. Interventions focus on six priority areas, comprising three health conditions or diseases (obesity, diabetes, and asthma) and three related risk behaviors (physical inactivity, poor nutrition, and tobacco use). Communities were selected as part of a Request for Funding announcement (RFA) designed to ensure inclusion of populations disproportionately affected by chronic disease and associated risk factors; inclusion of geographic areas with high age-adjusted rates of chronic disease and associated risk factors; geographic distribution of Steps programs nationwide; and inclusion of communities of varying sizes, including rural, suburban, and urban communities. Steps sites include small cities and rural communities (with sites coordinated at the state level), large cities and urban communities, and tribal communities. As part of the RFA, grantees participate in the Steps Behavioral Risk Factor Surveillance System (BRFSS) to collect data on health conditions and diseases and on related risk factors at the community level and track Steps Program health outcomes and behaviors over time. This report provides baseline data for Steps communities; additional years of data will be used to make community to community, national, and HP2010 comparisons. Data are reported for 39 Steps communities* that reported data for 2005 on the six priority areas.

Methods

The Steps BRFSS survey instrument is a modified version of the 2005 BRFSS national survey and includes standardized questions related to the three Steps-specific disease outcomes (diabetes, asthma, and obesity) and the three related risk factors (physical inactivity, poor nutrition, and tobacco use). A multistage cluster design based on random-digit--dialing methods was used to select a representative sample of the civilian, noninstitutionalized population aged >18 years. To ensure coordinated efforts and efficient use of resources, 39 Steps communities used BRFSS infrastructure and capacity already in place at the national, state, and local levels to collect data. The survey instrument included standard 2005 BRFSS questions (available at http://www.cdc.gov/brfss) related to the six priority areas. Data collection procedures or processes varied by community because of each community's particular characteristics. For example, certain Steps communities conducted a stand-alone survey whereas others coordinated data collection with the state or local BRFSS. Several Steps communities adapted their data collection methods to respond to local cultural needs. For the majority of Steps communities, CDC provided technical assistance, data cleaning, weighting, and analysis of surveillance data.

Questionnaire

The 2005 Steps BRFSS questionnaire comprised three parts: 1) core questions, 2) optional supplemental modules containing sets of questions on specific topics (e.g., diabetes, health-related-quality of life, and arthritis management), and 3) state-added questions. The 2005 Steps BRFSS questionnaire asked core and optional questions related to risk factors associated with obesity, diabetes, and asthma and the accompanying underlying risk factors of physical inactivity, poor nutrition, and tobacco use. Questions from the following Core Sections of the 2005 BRFSS National Survey were used: Healthy Days, Health Care Access, Diabetes, Asthma, Tobacco Use, Demographics, Fruits, Vegetables, and Physical Activity. In addition, certain questions from the following Optional Modules were part of the survey: Diabetes Self-Management, Adult Asthma History, and Smoking Cessation. Additional information about the national BRFSS standard questions is available at http://www.cdc.gov/brfss/questionnaires.

Data Collection and Processing

A total of 39 Steps communities* collected data in 2005 using trained interviewers to administer the survey via a computer-assisted telephone interviewing (CATI) system; 30 communities forwarded their data to CDC for data reliability checks and preparation for analyses, and nine communities conducted individual analyses and reported the results to CDC. Six of the nine communities that conducted their own analysis sent weighted data to CDC to produce estimates. For each community, data were collected either monthly or at a single point in time.

Data Weighting and Analysis

Upon completion of data collection, 30 communities submitted data to CDC, which edited and aggregated the data files to create a sample for each community. For this analysis, each sample was weighted to the respondent's probability of selection and to the age- and sex-specific population or to the age-, sex-, and race-specific population data, using current population estimates provided by the community or 2005 intercensal estimates provided by Claritas, Inc. (San Diego, California), a private data vendor that uses census projections as part of its process for developing yearly population estimates. These sampling weights then were used to calculate community-level prevalence estimates. Detailed weighting and analytic methodologies used for BRFSS have been documented previously (6).

Statistical Analyses

SAS® (release 9.1.3) and SUDAAN® were used in the analyses to account for the complex sampling design and to calculate prevalence estimates, standard errors, and 95% confidence intervals (CIs) (7,8). Statistics for selected communities were reported as "not available" if the unweighted sample size for the denominator was <50 or the CI half width was >10. Because those data are not included in this report, the number of communities represented for each indicator varies (range: 20--39).

Data Presented

The tables in this report contain the weighted percentage, sample size, standard error, and CIs. Data for three of the communities that conducted their own data analysis are reported without standard errors. Standard errors are reported for the six communities that conducted their own data analysis and sent their data to CDC to produce estimates from the weighted data set that they provided. When comparable, national BRFSS median prevalence estimates and Healthy People 2010 (HP2010) goals are presented (9,10). National prevalence estimates are not available for questions from BRFSS optional modules. For several questions, comparative HP2010 goals are not available because the results cannot be compared with the BRFSS indicators.

Results

Overweight and Obesity

Prevalence of Overweight and Obesity Among Adults Aged >18 Years

Self-reported weight and height were used to calculate body mass index (BMI) (weight [kg]/height [m2]). Being overweight or obese was defined as having a BMI of >25.0 kg/m2; obesity alone was classified as BMI of >30.0 kg/m2. The estimated prevalence of respondents aged >18 years being overweight or obese ranged from 35.4% (95% CI = 33.0--37.9) in Cleveland, Ohio, to 75.5% (95% CI = 64.7--83.9) in Colville Confederated Tribes, Washington (median: 60.8%) (Table 1). The 2005 nationwide BRFSS median was 61.3%; this median was exceeded by 19 Steps communities.

Prevalence of Obesity Among Adults Aged >18 Years

Overall, the estimated prevalence of obesity (BMI >30.0 kg/m2) among respondents aged >18 years ranged from 15.6% (95% CI = 13.5--17.6) in Teller County, Colorado, to 44.0% (95% CI = 36.3--51.6) in Inter-Tribal Council, Michigan (median: 24.6%) (Table 2). The HP2010 objective is to reduce the proportion of adults who are obese to 15.0%. The 2005 nationwide BRFSS median was 24.4%; this median was exceeded by 20 communities, and no communities achieved the HP2010 objective (objective no. 19.2) to reduce the proportion of adults who are obese to 15.0%.

Diabetes

Overall Rate of Diabetes

Overall, the estimated prevalence of diabetes among respondents aged >18 years who reported ever having been told by a doctor that they have diabetes (other than during pregnancy) ranged from 4.3% (95% CI = 2.4--6.2) in St. Paul-Ramsey County, Minnesota, to 16.6% (95% CI = 10.1--23.1) in Inter-Tribal Council, Michigan (median: 8.1%) (Table 3). The nationwide 2005 BRFSS median was 7.3%; this median was exceeded by 25 Steps communities.

Foot Examination Among Adults Aged >18 Years with Diabetes

Among 25 Steps communities, the estimated prevalence among respondents aged >18 years who reported having ever been told by a doctor that they have diabetes (excluding women who were told only when pregnant) and who reported having a clinical foot examination during the preceding 12 months ranged from 60.4% (95% CI = 50.8--70.0) in Santa Clara County, California, to 93.6% (95% CI = 88.7--98.6) in Inter-Tribal Council, Michigan (median: 79.7%) (Table 4). The HP2010 objective (objective no. 5-14) is to increase the proportion of adults with diabetes who have at least an annual foot examination to 75.0%.

Dilated Eye Examination Among Adults Aged >18 Years with Diabetes

Among 21 Steps communities, the estimated prevalence among respondents aged >18 years who reported having ever been told by a doctor that they have diabetes (excluding women who were told only when pregnant) and who reported having received a dilated eye examination during the preceding 12 months ranged from 63.2% (95% CI = 53.5--72.9) in Cleveland, Ohio, to 81.9% (95% CI = 74.2--89.7) in Boston, Massachusetts (median: 72.0%) (Table 5). The HP2010 objective (objective no. 5.13) is to increase the proportion of adults with diabetes who have an annual dilated eye examination to 75.0%.

Glycosylated Hemoglobin Measurement at Least Twice a Year Among Adults Aged >18 Years with Diabetes

Among 22 Steps communities, the estimated prevalence among respondents aged >18 years who reported having ever been told by a doctor that they have diabetes (other than during pregnancy) and who reported having received a glycosylated hemoglobin measurement ("A1c") at least twice a year ranged from 54.8% (95% CI = 45.8--63.8) in Cleveland, Ohio, to 89.8% (95% CI = 83.5--96.0) in Inter-Tribal Council, Michigan (median: 69.8%) (Table 6).

Self--Blood Glucose Monitoring Among Adults Aged >18 Years with Diabetes

Among 22 Steps communities, the estimated prevalence among respondents aged >18 years who reported ever having been told by a doctor that they have diabetes (other than during pregnancy) and who reported self--blood glucose monitoring at least twice daily ranged from 28.2% (95% CI = 19.2--37.1) in Austin, Texas, to 46.8% (95% CI = 37.5--56.1) in Philadelphia, Pennsylvania (median: 40.2%) (Table 7).

Self--Foot Examination Among Adults Aged >18 Years with Diabetes

Among 20 Steps communities, the estimated prevalence among respondents aged >18 years who reported ever having been told by a doctor that they have diabetes (other than during pregnancy) who reported checking their feet at least once daily for any sores or irritations ranged from 61.7% (95% CI = 52.7--70.7) in Chautauqua County, New York, to 79.2% (95% CI = 72.5--85.9) in Southeast Alabama (median: 74.6%) (Table 8).

Asthma

Symptom-Free Days Among Adults Aged >18 Years with Asthma

Among 35 Steps communities, the prevalence of reported asthma ranged from 7.0% (95% CI = 4.3--9.7) in Santa Cruz County, Arizona, to 17.6% (95% CI = 15.2--20.0) in Philadelphia, Pennsylvania (Table 9). The Steps communities' median was 12.4%. The national BRFSS median was 12.6%; this median was exceeded by 18 Steps communities. Of persons with asthma who reported having had an episode of asthma or an asthma attack during the preceding 12 months, the prevalence of persons reporting having had no symptoms in the previous 30 days ranged from 15.4% (95% CI = 9.1--21.7) in Pueblo County, Colorado, to 40.3% (95% CI = 30.5--50) in St. Petersburg-Pinellas County, Florida. Among 10 communities, the median was 20.9% (Table 10).

Physical Activity Among Adults Aged >18 Years

Overall, the estimated prevalence among respondents aged >18 years who reported engaging in moderate physical activity for >30 minutes at least five times a week or who reported engaging in vigorous physical activity for >20 minutes at least three times a week ranged from 42.0% (95% CI = 38.7--45.3) in New Orleans, Louisiana, to 62.2% (95% CI = 59.0--65.3) in Jefferson County, New York (median: 51.1%) (Table 11). The nationwide 2005 BRFSS median was 49.1%; this median was exceeded by 22 Steps communities.

Fruit and Vegetable Consumption Among Adults Aged >18 Years

Overall, the percentage of respondents aged >18 years who reported eating fruits and vegetables at least five times a day ranged from 15.6% (95% CI = 13.7--17.5) in Cherokee Nation, Oklahoma, to 30.3% (95% CI = 27.6--33.0) in Salinas-Monterey County, California (median: 24.9%) (Table 12). The nationwide 2005 BRFSS median of 23.2% was exceeded by 27 Steps communities.

Tobacco Use

Cigarette Smoking Among Adults Aged >18 Years

The estimated prevalence among respondents aged >18 years who reported having smoked at least 100 cigarettes in their lifetime and who were current smokers on every day or some days ranged from 11.0% (95% CI = 7.6--14.4) in Rochester-Olmstead County, Minnesota, to 39.7% (95% CI = 28.8--51.6) in Colville Confederated Tribes, Washington (median: 21.7%) (Table 13). The national 2005 BRFSS median was 20.6%; this median was exceeded by 24 Steps communities. The HP2010 objective (objective no. 27-1a) is to reduce the proportion of adults who smoke to 12.0%.

Tobacco Use Cessation Attempts by Smokers Aged >18 Years

Among 31 communities, the estimated prevalence among smokers aged >18 years who reported having stopped smoking for >1 day during the preceding 12 months because they were trying to quit smoking ranged from 47.8% (95% CI = 41.7--54.0) in Teller County, Colorado, to 63.3% (95% CI = 55.0--71.6) in DeKalb County, Georgia (median: 55.9%) (Table 14). The HP2010 objective (objective no. 27.5) is to increase smoking cessation attempts by adult smokers to 75.0%.

Discussion

The CDC Steps Program responds to community needs and works to affect change at the population level using a community-based approach. The program funds communities across the country to demonstrate how local initiatives across sectors (e.g., community, school, worksite, and health care) in collaboration with traditional and nontraditional partners (e.g., media outlets and departments of, transportation) can reduce the burden of chronic conditions such as obesity, chronic diseases such as diabetes and asthma, and the underlying risk factors of physical inactivity, poor nutrition, and tobacco use. The Steps Program's focus of joining the resources and perspectives of a wide range of sectors and entities dedicated to collaboration for health improvement draws on common interests and accelerates progress toward health promotion efforts. Such efforts create measurable improvements in community health through the selection, implementation, and evaluation of programmatic activities.

The findings in this report indicate variations in the estimated prevalence of chronic conditions and diseases, health-risk behaviors, and use of preventive screening practices across Steps communities. With respect to achieving HP2010 objectives, 18 communities achieved the HP2010 objective to increase the proportion of adults with diabetes who have at least an annual foot examination to 75.0%; five communities achieved the HP2010 objective to increase the proportion of adults with diabetes who have an annual dilated eye examination to 75.0%; one community achieved the HP2010 objective to reduce the proportion of adults who smoke to 12.0%. No communities achieved the HP2010 objective to reduce the proportion of adults who are obese to 15.0% or achieved the HP2010 objective to increase smoking cessation attempts by adult smokers to 75.0%.

Steps communities' use of BRFSS questions for community-specific surveys permits useful collection of data at the local level. The data presented in this report indicate that communities vary widely in prevalence rates of important chronic disease indicators. In part, this variability might reflect differences in state and local laws and policies, enforcement practices, availability of effective community interventions, prevailing behavioral and social norms, demographic and adult practices, characteristics of the population, and other social determinants of health.

Going forward, collection of Steps BRFSS data will provide trend estimates that will permit making community-to-community, national, and HP2010 comparisons. These data also will provide useful information for programmatic decision-making at the community, local, and state levels and guide local health officials and decision-makers in program planning and evaluation. Steps Program staff and other public health and education practitioners can use these data to assess changes in these behaviors over time and assist in evaluating the effectiveness of Steps community programs. An examination of the variations among communities can identify which communities would benefit from additional targeted technical assistance related to effective community interventions and policies. Differences between communities also can alert program managers to the opportunity to learn from each other by taking advantage of the national network they have established within the Steps Program. Communities can use these data to identify, prioritize, and develop community-specific activities to further reduce obesity, diabetes, and asthma by increasing physical activity, encouraging healthy eating, and reducing tobacco use.

Limitations

The findings in this report are subject to at least five limitations. First, the Steps BRFSS survey queries only persons with landline telephone access and excludes persons who reside in households that lack telephone access or persons who use only cellular telephones; therefore, the data might not reflect the characteristics of persons who reside in households without landline telephones. Second, prevalence estimates are self-reported and thus the reported estimates might be subject to recall bias. Third, each Steps community has the option to modify BRFSS data collection methodology, which might preclude standardization in some cases. Fourth, the number of interviews varied widely (range: 490--2,247). Therefore, estimates for some communities are based on smaller sample sizes and might yield unstable estimates for rare events. Finally, Steps BRFSS does not collect information from institutionalized persons, thereby excluding persons residing in nursing homes, long-term--care facilities, and correctional institutions.

Conclusion

Steps BRFSS data enable public health authorities to monitor health risk behaviors over time and support focused prevention and intervention programs. Steps Program staff at the national, state, local, and tribal levels will use these data for decision-making, program planning, and enhancing technical assistance. The Steps Program works to achieve HP2010 objectives by using BRFSS data to enhance existing program activities, focus existing programs on activities with the greatest promise of results, identify opportunities for strategic collaboration, and disseminate lessons learned.

References

  1. Mokdad A, Marks J, Stroup D, Gerberding J. Actual causes of death in the United States, 2000. JAMA 2004;291:1238--45.
  2. CDC. The burden of chronic diseases and their risk factors: national and state perspectives 2004. Atlanta, GA: U.S. Department of Health and Human Services, CDC; 2004. Available at: http://www.cdc.gov/nccdphp/burdenbook2004.
  3. Colditz GA. Economic costs of obesity and inactivity. Med Sci Sports Exerc 1999;31:S663--7.
  4. American Lung Association. Trends in asthma morbidity and mortality 2007. New York, NY: American Lung Association; 2007. Available at http://www.lungusa.org/site/pp.asp?c=dvLUK9O0E&b=33347.
  5. CDC. Beh Flegal KM, Graubard BI, Williamson DF, Gail MH. Excess deaths associated with underweight, overweight, and obesity. JAMA 2005;293:1861--7.
  6. CDC. Behavioral Risk Factor Surveillance System operational and user's guide, version 3.0. Atlanta, GA: US Department of Health and Human Services, CDC; 2004.
  7. SAS Institute, Inc. SAS® version 8.02 [software and documentation]. Cary, NC: SAS Institute; 2001.
  8. Research Triangle Institute. SUDAAN®, version 9 [software and documentation]. Triangle Park, NC: Research Triangle Institute; 2004.
  9. US Department of Health and Human Services. Healthy people 2010: national health promotion and disease prevention objective---full report with commentary. Washington, DC: US Department of Health and Human Services, US Public Health Service; 2000. Available at http://www.cdc.gov/nchs/about/otheract/hpdata2010/abouthp.htm.
  10. CDC. Surveillance of certain health behaviors among states and selected local areas---United States, 2005. In: CDC Surveillance Summaries, May 11, 2007. MMWR 2007;56(No.SS-4).

* One Steps community, the Tohono O'odham Tribe, did not report data because BRFSS does not include persons residing in households without telephones, and this community's low telephone coverage precluded reaching the numbers required for standard sampling methodology.

The HP2010 objective refers to adults aged >20 years whereas Steps data are collected for adults aged >18 years.


Table 1

TABLE 1. Estimated prevalence of respondents aged >18 years who have a body mass index (BMI) of >25.0 kg/m² calculated from self-reported weight and height, by community — United States, Behavioral Risk Factor Surveillance Steps Communities, 2005
Community
Sample Size
Weighted %
SE*
95% CI†
River Region, Alabama
1,197
64.4
1.9
60.7–68.0
Southeast Alabama, Alabama
1,295
71.3
1.7
68.0–74.7
Southeast Alaska Regional Health Consortium, Alaska
538
70.8
2.4
66.1–75.5
Cochise County, Arizona
459
58.1
3.0
52.3–63.9
Santa Cruz County, Arizona
479
67.5
2.5
62.7–72.3
Yuma County, Arizona
459
66.6
2.8
61.0–72.1
Salinas-Monterey County, California
1,556
69.5
1.4
66.7–72.2
Santa Clara County, California
1,557
61.5
1.6
58.5–64.6
Mesa County, Colorado
1,400
59.0
1.5
56.1–62.0
Pueblo County, Colorado
1,415
58.5
1.7
55.2–61.7
Teller County, Colorado
1,470
52.5
1.5
49.6–55.4
Weld County, Colorado
1,376
60.7
1.6
57.6–63.9
Hillsborough, Florida
1,521
61.5
1.6
58.4–64.5
St. Petersburg-Pinellas County, Florida
1,510
56.9
1.5
53.9–59.9
DeKalb County, Georgia
1,839
56.9
1.7
53.5–60.3
New Orleans, Louisiana
1,421
59.8
1.6
56.6–63.0
Boston, Massachusetts
1,533
55.1
§
51.7-58.6
Inter-Tribal Council, Michigan
581
73.3
3.7
66.0–80.5
St. Paul-Ramsey County, Minnesota
465
59.2
2.9
53.5–64.9
Minneapolis, Minnesota
514
55.4
2.8
49.8–60.9
Rochester-Olmstead County, Minnesota
459
59.0
2.8
53.5–64.4
Willmar, Minnesota
475
60.6
2.9
55.0–66.2
Broome County, New York
1,469
61.4
1.7
58.1–64.7
Chautauqua County, New York
1,407
60.7
1.8
57.2–64.2
Jefferson County, New York
1,453
63.4
1.7
60.1–66.7
Rockland County, New York
1,380
59.3
1.8
55.9–62.7
Cleveland, Ohio
1,056
35.4
§
33.0-37.9
Cherokee Nation, Oklahoma
2,138
65.5
1.3
62.9–68.1
Philadelphia, Pennsylvania
1,455
60.2
1.6
57.0–63.4
Fayette County, Pennsylvania
1,493
69.7
1.4
67.1–72.4
Luzerne County, Pennsylvania
1,445
63.2
1.4
60.4–66.0
Tioga County, Pennsylvania
1,478
66.6
1.4
63.9–69.2
Austin, Texas
1,418
59.8
2.0
55.8–63.7
San Antonio, Texas
486
66.0
2.8
60.6–71.4
Chelan-Douglas-Okanogan Counties, Washington
1,507
63.1
1.5
60.1–66.1
Clark County, Washington
1,503
62.0
1.5
59.0–64.9
Colville Confederated Tribes, Washington
150
75.5
§
64.7-83.9
Seattle-King, County, Washington
1,494
56.6
1.5
53.6–59.6
Thurston County, Washington
1,574
60.9
1.6
57.8–63.9
Range
35.4–75.5
Median
60.8
National range
18.2–31.8
National median
24.4%
* Standard error.
† Confidence interval.
§ Data analysis conducted by the community; SE not reported.
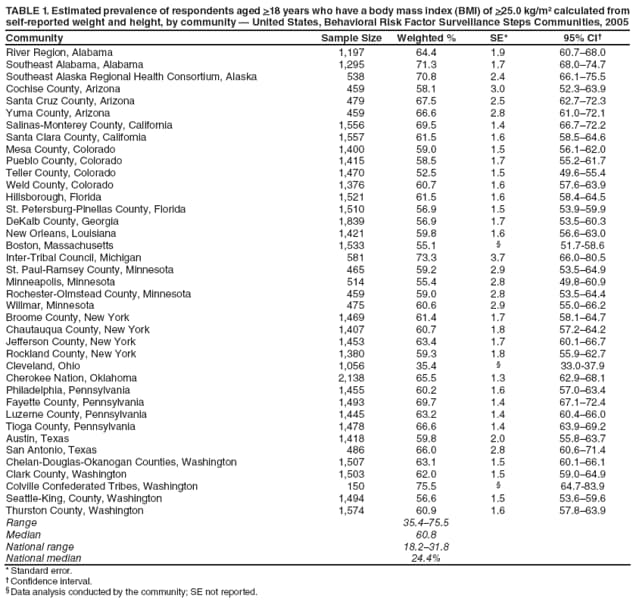
Return to top.
Table 2

TABLE 2. Estimated prevalence of respondents aged >18 years who have a body mass index (BMI) of >30.0 kg/m² calculated from self-reported weight and height, by community — United States, Behavioral Risk Factor Surveillance Steps Communities, 2005
Community
Sample Size
Weighted %
SE*
95% CI†
River Region, Alabama
1,197
28.7
1.7
25.4–32.1
Southeast Alabama, Alabama
1,295
33.5
1.7
30.2–36.8
Southeast Alaska Regional Health Consortium, Alaska
538
30.8
2.4
26.1–35.5
Cochise County, Arizona
459
27.6
2.7
22.4–32.8
Santa Cruz County, Arizona
479
23.2
2.3
18.7–27.7
Yuma County, Arizona
459
30.6
2.7
25.4–35.9
Salinas-Monterey County, California
1,556
28.5
1.4
25.7–31.2
Santa Clara County, California
1,557
20.6
1.3
18.0–23.1
Mesa County, Colorado
1,400
20.3
1.3
17.8–22.8
Pueblo County, Colorado
1,415
22.6
1.4
19.8–25.3
Teller County, Colorado
1,470
15.6
1.0
13.5–17.6
Weld County, Colorado
1,376
24.0
1.4
21.3–26.8
Hillsborough, Florida
1,521
27.0
1.5
24.0–29.9
St. Petersburg-Pinellas County, Florida
1,510
22.0
1.2
19.5–24.4
DeKalb County, Georgia
1,839
20.6
1.3
18.1–23.2
New Orleans, Louisiana
1,421
24.9
1.4
22.2–27.7
Boston, Massachusetts
1,533
21.4
§
18.7–24.1
Inter-Tribal Council, Michigan
581
44.0
3.9
36.3–51.6
St. Paul-Ramsey County, Minnesota
465
22.4
2.6
17.3–27.5
Minneapolis, Minnesota
514
20.8
2.3
16.4–25.2
Rochester-Olmstead County, Minnesota
459
20.8
2.3
16.3–25.2
Willmar, Minnesota
475
23.6
2.3
19.2–28.0
Broome County, New York
1,469
25.6
1.5
22.7–28.5
Chautauqua County, New York
1,407
23.7
1.5
20.9–26.6
Jefferson County, New York
1,453
24.2
1.5
21.3–27.0
Rockland County, New York
1,380
17.9
1.4
15.2–20.7
Cleveland, Ohio
1,056
33.1
§
30.7–35.5
Cherokee Nation, Oklahoma
2,138
27.8
1.2
25.5–30.1
Philadelphia, Pennsylvania
1,455
28.6
1.4
25.9–31.4
Fayette County, Pennsylvania
1,493
31.0
1.4
28.3–33.7
Luzerne County, Pennsylvania
1,445
25.6
1.3
23.0–28.1
Tioga County, Pennsylvania
1,478
28.1
1.3
25.5–30.6
Austin, Texas
1,418
24.1
1.7
20.7–27.4
San Antonio, Texas
486
31.0
2.5
26.1–35.9
Chelan-Douglas-Okanogan Counties, Washington
1,507
25.3
1.3
22.7–27.9
Clark County, Washington
1,503
25.4
1.3
22.8–28.0
Colville Confederated Tribes, Washington
150
33.3
§
23.1–45.4
Seattle-King, County, Washington
1,494
21.7
1.3
19.3–24.2
Thurston County, Washington
1,574
23.7
1.3
21.1–26.3
Range
15.6–44.0
Median
24.5
National range
18.2–31.8
National median
24.4%
Healthy People 2010 (HP 2010) objectiveΆ
15.0
* Standard error.
† Confidence interval.
§ Data analysis conducted by the community; SE not reported.
Ά The HP2010 objective refers to adults aged >20 years whereas Steps data are collected for adults aged >18 years.
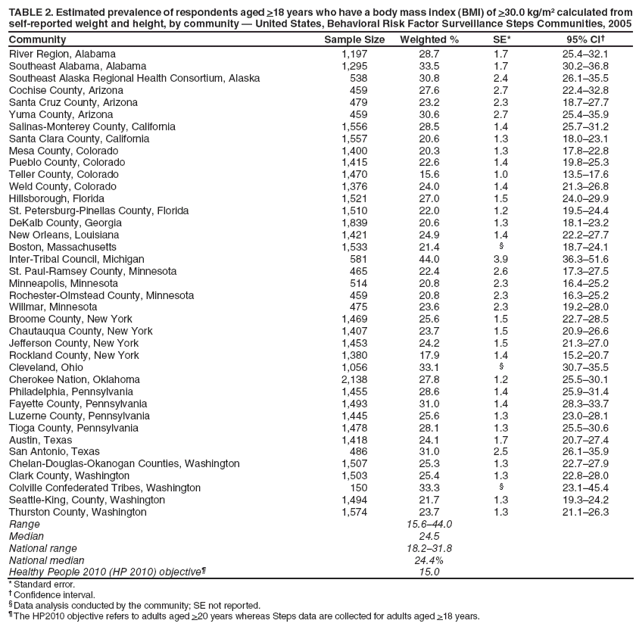
Return to top.
Table 3

TABLE 3. Estimated prevalence of respondents aged >18 years who reported ever having been told by a doctor that they have diabetes (other than during pregnancy), by community — United States, Behavioral Risk Factor Surveillance System, 39 Steps Communities, 2005
Community
Sample Size
Weighted %
SE*
95% CI†
River Region, Alabama
1,249
10.3
1.0
8.3–12.3
Southeast Alabama, Alabama
1,351
11.4
1.0
9.4–13.3
Southeast Alaska Regional Health Consortium, Alaska
562
8.3
1.4
5.5–11.1
Cochise County, Arizona
490
12.8
1.9
9.2–16.5
Santa Cruz County, Arizona
513
10.8
1.6
7.8–13.8
Yuma County, Arizona
507
9.4
1.4
6.6–12.1
Salinas-Monterey County, California
1,696
8.3
0.7
6.9–9.7
Santa Clara County, California
1,701
8.2
0.8
6.6–9.7
Mesa County, Colorado
1,465
6.9
0.7
5.5–8.3
Pueblo County, Colorado
1,489
8.0
0.8
6.6–9.5
Teller County, Colorado
1,520
4.5
0.6
3.4–5.6
Weld County, Colorado
1,483
5.8
0.7
4.4–7.3
Hillsborough, Florida
1,568
9.2
0.9
7.5–10.9
St. Petersburg-Pinellas County, Florida
1,551
11.0
1.0
9.1–12.9
DeKalb County, Georgia
1,949
6.4
0.6
5.2–7.6
New Orleans, Louisiana
1,495
8.5
0.8
6.9–10.0
Boston, Massachusetts
1,616
7.6
§
6.2–9.0
Inter-Tribal Council, Michigan
610
16.6
3.3
10.1–23.1
St. Paul-Ramsey County, Minnesota
487
4.3
1.0
2.4–6.2
Minneapolis, Minnesota
536
5.2
1.1
3.1–7.3
Rochester-Olmstead County, Minnesota
477
5.8
1.0
3.8–7.8
Willmar, Minnesota
499
6.5
1.1
4.3–8.7
Broome County, New York
1,528
7.6
0.7
6.2–8.9
Chautauqua County, New York
1,486
6.9
0.6
5.7–8.1
Jefferson County, New York
1,524
7.5
0.7
6.2–8.8
Rockland County, New York
1,455
5.8
0.6
4.6–7.0
Cleveland, Ohio
1,107
11.1
§
9.8–12.5
Cherokee Nation, Oklahoma
2,243
9.6
0.7
8.2–10.9
Philadelphia, Pennsylvania
1,516
10.2
0.9
8.4–12.0
Fayette County, Pennsylvania
1,557
11.2
0.8
9.6–12.9
Luzerne County, Pennsylvania
1,516
8.9
0.8
7.3–10.4
Tioga County, Pennsylvania
1,552
11.0
0.9
9.3–12.8
Austin, Texas
1,588
6.8
0.8
5.3–8.3
San Antonio, Texas
527
12.3
1.5
9.4–15.3
Chelan-Douglas-Okanogan Counties, Washington
1,594
7.4
0.7
6.0–8.8
Clark County, Washington
1,594
5.5
0.6
4.4–6.5
Colville Confederated Tribes, Washington
153
10.4
§
5.7–18.5
Seattle-King, County, Washington
1,592
7.0
0.7
5.7–8.2
Thurston County, Washington
1,639
6.9
0.7
5.6–8.1
Range
4.3–16.6
Median
8.1
National range
4.4–12.5
National median
7.3
* Standard error.
† Confidence interval.
§ Data analysis conducted by the community; SE not reported.
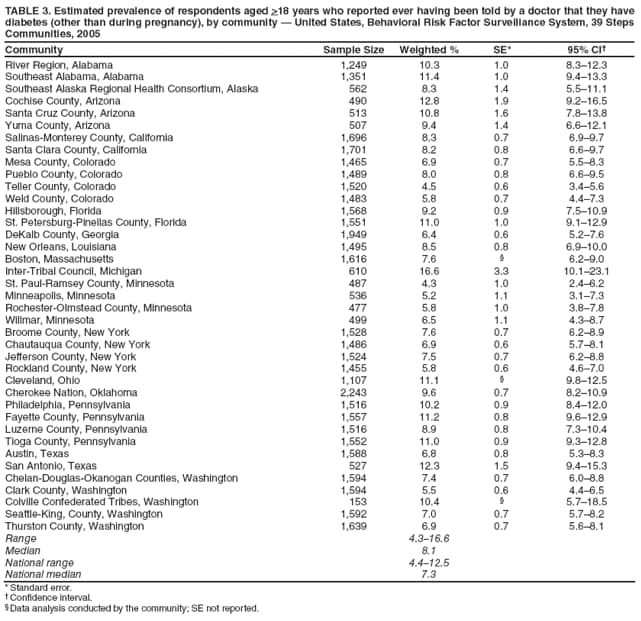
Return to top.
Table 4

TABLE 4. Estimated prevalence of respondents aged >18 years ever told by a doctor that they have diabetes (excluding women who were told only when pregnant) who reported having a clinical foot examination during the preceding 12 months, by community — United States, Behavioral Risk Surveillance System, 39 Steps Communities, 2005
Community
Sample Size
Weighted %
SE*
95% CI†
River Region, Alabama
146
81.0
3.7
73.8–88.2
Southeast Alabama, Alabama
175
79.3
3.3
72.8–85.7
Southeast Alaska Regional Health Consortium, Alaska
46
—§
—
—
Cochise County, Arizona
59
—
—
—
Santa Cruz County, Arizona
59
—
—
—
Yuma County, Arizona
52
—
—
—
Salinas-Monterey County, California
164
65.2
4.2
56.9–73.5
Santa Clara County, California
152
60.4
4.9
50.8–70.0
Mesa County, Colorado
113
81.2
4.4
72.5–89.8
Pueblo County, Colorado
137
74.2
4.1
66.1–82.2
Teller County, Colorado
75
—
—
—
Weld County, Colorado
86
—
—
—
Hillsborough, Florida
154
73.1
4.4
64.5–81.6
St. Petersburg-Pinellas County, Florida
161
64.1
4.9
54.6–73.6
DeKalb County, Georgia
162
72.8
4.8
63.4–82.1
New Orleans, Louisiana
152
83.9
3.5
77.0–90.7
Boston, Massachusetts
145
76.3
Ά
64.9–87.6
Inter-Tribal Council, Michigan
93
93.6
2.5
88.7–98.6
St. Paul-Ramsey County, Minnesota
27
—
—
—
Minneapolis, Minnesota
36
—
—
—
Rochester-Olmstead County, Minnesota
38
—
—
—
Willmar, Minnesota
39
—
—
—
Broome County, New York
149
86.1
3.1
79.9–92.2
Chautauqua County, New York
132
80.2
3.7
72.9–87.6
Jefferson County, New York
147
80.1
3.4
73.4–86.8
Rockland County, New York
105
81.6
4.1
73.5–89.7
Cleveland, Ohio
154
79.7
Ά
68.9–90.5
Cherokee Nation, Oklahoma
0
—
—
—
Philadelphia, Pennsylvania
171
84.0
3.3
77.5–90.5
Fayette County, Pennsylvania
191
75.8
3.3
69.4–82.2
Luzerne County, Pennsylvania
145
73.6
3.9
65.9–81.3
Tioga County, Pennsylvania
166
78.6
3.5
71.8–85.4
Austin, Texas
159
—
—
—
San Antonio, Texas
82
—
—
—
Chelan-Douglas-Okanogan Counties, Washington
131
82.2
3.7
75.0–89.5
Clark County, Washington
114
79.8
4.0
71.9–87.7
Colville Confederated Tribes, Washington
—
—
Ά
—
Seattle-King, County, Washington
128
77.6
4.1
69.7–85.6
Thurston County, Washington
140
80.8
3.6
73.7–87.9
Range
60.4–93.6
Median
79.5
Healthy People 2010 objective
75.0
* Standard error.
† Confidence interval.
§ Not available if the unweighted sample size for the denominator was <50 or if the CI half width is >10.
Ά Data analysis conducted by the community; SE not reported.
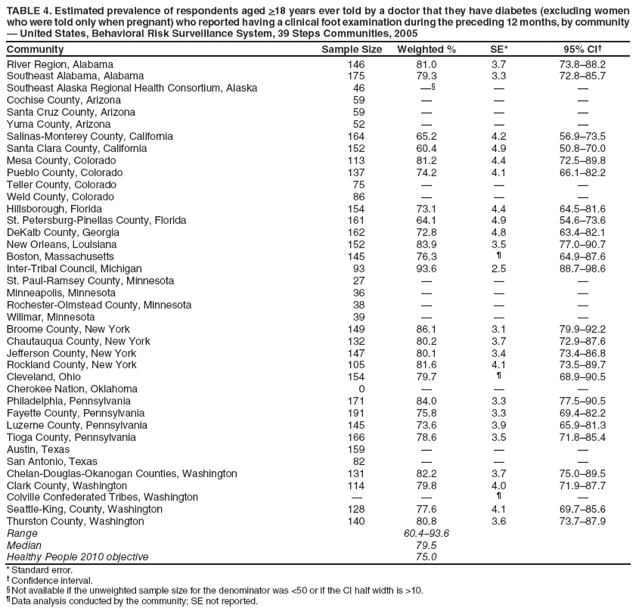
Return to top.
Table 5

TABLE 5. Estimated prevalence of respondents aged >18 years ever told by a doctor that they have diabetes (excluding women who were told only when pregnant) who reported having received a dilated eye examination during the preceding 12 months, by community — United States, Behavioral Risk Factor Surveillance System, 39 Steps Communities, 2005
Community
Sample Size
Weighted %
SE*
95% CI†
River Region, Alabama
146
73.6
4.5
64.8–82.4
Southeast Alabama, Alabama
184
73.6
3.8
66.2–81.0
Southeast Alaska Regional Health Consortium, Alaska
45
—§
—
—
Cochise County, Arizona
60
—
—
—
Santa Cruz County, Arizona
59
—
—
—
Yuma County, Arizona
52
—
—
—
Salinas-Monterey County, California
163
68.9
4.1
60.8–77.0
Santa Clara County, California
152
69.3
4.6
60.4–78.3
Mesa County, Colorado
120
—
—
—
Pueblo County, Colorado
142
75.8
4.0
68.0–83.6
Teller County, Colorado
74
—
—
—
Weld County, Colorado
86
—
—
—
Hillsborough, Florida
159
80.7
3.4
74.0–87.4
St. Petersburg-Pinellas County, Florida
171
72.8
3.9
65.2–80.4
DeKalb County, Georgia
162
—
—
—
New Orleans, Louisiana
158
79.1
4.1
71.0–87.2
Boston, Massachusetts
153
81.9
Ά
74.2–89.7
Inter-Tribal Council, Michigan
93
—
—
—
St. Paul-Ramsey County, Minnesota
27
—
—
—
Minneapolis, Minnesota
36
—
—
—
Rochester-Olmstead County, Minnesota
39
—
—
—
Willmar, Minnesota
41
—
—
—
Broome County, New York
153
72.8
4.1
64.8–80.8
Chautauqua County, New York
136
73.3
4.2
65.1–81.6
Jefferson County, New York
158
66.2
4.3
57.7–74.6
Rockland County, New York
107
81.8
4.2
73.6–90.0
Cleveland, Ohio
154
63.2
Ά
53.5–72.9
Cherokee Nation, Oklahoma
0
—
—
—
Philadelphia, Pennsylvania
172
72.4
4.2
64.1–80.6
Fayette County, Pennsylvania
200
71.6
3.6
64.7–78.6
Luzerne County, Pennsylvania
148
65.9
4.8
56.4–75.3
Tioga County, Pennsylvania
167
63.4
4.4
54.8–71.9
Austin, Texas
167
—
—
—
San Antonio, Texas
84
—
—
—
Chelan-Douglas-Okanogan Counties, Washington
138
—
—
—
Clark County, Washington
115
68.5
4.8
59.0–77.9
Colville Confederated Tribes, Washington
—
—
Ά
—
Seattle-King, County, Washington
131
71.1
4.4
62.4–79.8
Thurston County, Washington
141
71.5
4.6
62.6–80.4
Range
63.2–81.9
Median
72.0
Healthy People 2010 objective
75.0
* Standard error.
† Confidence interval.
§ Not available if the unweighted sample size for the denominator was <50 or if the CI half width is >10.
Ά Data analysis conducted by the community; SE not reported.
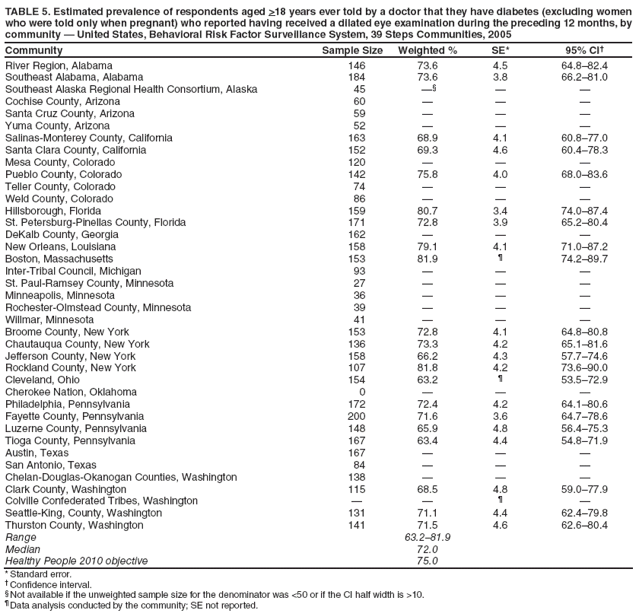
Return to top.
Table 6

TABLE 6. Estimated prevalence of respondents aged >18 years ever told by a doctor that they have diabetes (excluding women who were told only when pregnant) who reported having received a glycosylated hemoglobin measurement (“A1c”) at least twice a year, by community — United States, Behavioral Risk Factor Surveillance System, 39 Steps Communities, 2005
Community
Sample Size
Weighted %
SE*
95% CI†
River Region, Alabama
137
66.9
4.8
57.6–76.2
Southeast Alabama, Alabama
166
73.8
3.9
66.2–81.4
Southeast Alaska Regional Health Consortium, Alaska
40
—§
—
—
Cochise County, Arizona
56
—
—
—
Santa Cruz County, Arizona
54
—
—
—
Yuma County, Arizona
49
—
—
—
Salinas-Monterey County, California
157
61.4
4.3
53.0–69.8
Santa Clara County, California
0
—
—
—
Mesa County, Colorado
108
70.5
4.9
60.8–80.2
Pueblo County, Colorado
122
61.2
4.9
51.6–70.8
Teller County, Colorado
71
—
—
—
Weld County, Colorado
83
—
—
—
Hillsborough, Florida
137
64.7
5.0
54.8–4.5
St. Petersburg-Pinellas County, Florida
147
—
—
—
DeKalb County, Georgia
154
66.6
5.0
56.9–76.4
New Orleans, Louisiana
145
—
—
—
Boston, Massachusetts
122
73.3
Ά
63.7–82.9
Inter-Tribal Council, Michigan
90
89.8
3.2
83.5–96.0
St. Paul-Ramsey County, Minnesota
26
—
—
—
Minneapolis, Minnesota
33
—
—
—
Rochester-Olmstead County, Minnesota
37
—
—
—
Willmar, Minnesota
39
—
—
—
Broome County, New York
146
73.8
4.3
65.4–82.2
Chautauqua County, New York
128
77.2
4.1
69.2–85.2
Jefferson County, New York
143
66.0
4.7
56.8–75.2
Rockland County, New York
94
88.0
3.4
81.4–94.6
Cleveland, Ohio
154
54.8
Ά
45.8–63.8
Cherokee Nation, Oklahoma
NA
—
—
—
Philadelphia, Pennsylvania
157
64.4
4.7
55.2–73.6
Fayette County, Pennsylvania
181
62.1
4.0
54.2–69.9
Luzerne County, Pennsylvania
135
64.4
4.8
55.0–73.7
Tioga County, Pennsylvania
161
75.2
3.7
68.0–82.5
Austin, Texas
145
—
—
—
San Antonio, Texas
68
—
—
—
Chelan-Douglas-Okanogan Counties, Washington
130
79.8
4.0
71.9–87.7
Clark County, Washington
107
77.9
4.2
69.7–86.2
Colville Confederated Tribes, Washington
—
—
Ά
—
Seattle-King, County, Washington
125
69.8
4.7
60.7–78.9
Thurston County, Washington
134
76.1
4.4
67.4–84.8
Range
54.8–89.8
Median
69.8%
* Standard error.
† Confidence interval.
§ Not available if the unweighted sample size for the denominator was <50 or if the CI half width is >10.
Ά Data analysis conducted by the community; SE not reported.
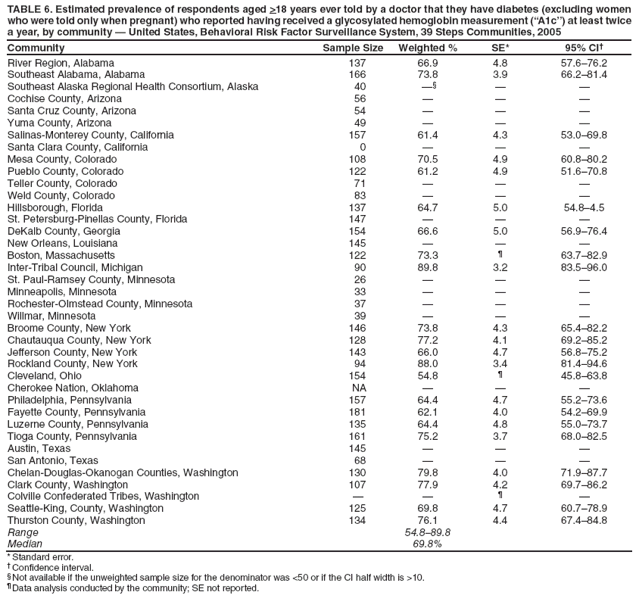
Return to top.
Table 7

TABLE 7. Estimated prevalence of respondents aged >18 years ever told by a doctor that they have diabetes (excluding women who were told only when pregnant) who reported self–blood glucose monitoring at least two times daily, by community — United States Behavioral Risk Factor Surveillance System, 39 Steps Communities, 2005
Community
Sample Size
Weighted %
SE*
95% CI†
River Region, Alabama
146
36.1
5.1
26.2–46.1
Southeast Alabama, Alabama
184
45.0
4.7
35.9–54.1
Southeast Alaska Regional Health Consortium, Alaska
43
—§
—
—
Cochise County, Arizona
60
—
—
—
Santa Cruz County, Arizona
58
—
—
—
Yuma County, Arizona
51
—
—
—
Salinas-Monterey County, California
164
40.2
4.3
31.7–48.6
Santa Clara County, California
150
33.8
4.9
24.3–43.3
Mesa County, Colorado
117
NA
NA
NA
Pueblo County, Colorado
141
44.4
4.8
35.0–53.8
Teller County, Colorado
76
—
—
—
Weld County, Colorado
89
—
—
—
Hillsborough, Florida
159
43.9
4.9
34.3–53.6
St. Petersburg-Pinellas County, Florida
169
38.5
4.8
29.1–47.8
DeKalb County, Georgia
166
40.2
5.0
30.5–49.9
New Orleans, Louisiana
159
42.8
4.8
33.3–52.2
Boston, Massachusetts
148
38.5
Ά
28.7–48.4
Inter-Tribal Council, Michigan
94
—
—
—
St. Paul-Ramsey County, Minnesota
27
—
—
—
Minneapolis, Minnesota
36
—
—
—
Rochester-Olmstead County, Minnesota
38
—
—
—
Willmar, Minnesota
41
—
—
—
Broome County, New York
155
40.2
4.7
30.9-49.4
Chautauqua County, New York
139
44.1
4.6
35.1–53.2
Jefferson County, New York
157
39.2
4.6
30.2–48.1
Rockland County, New York
107
—
—
—
Cleveland, Ohio
154
42.8
Ά
34.8–50.8
Cherokee Nation, Oklahoma
0
—
—
—
Philadelphia, Pennsylvania
173
46.8
4.7
37.5–56.1
Fayette County, Pennsylvania
202
45.4
3.8
38.0–52.9
Luzerne County, Pennsylvania
150
45.5
4.8
36.0–54.9
Tioga County, Pennsylvania
171
40.0
4.2
31.6–48.3
Austin, Texas
165
28.2
4.6
19.2–37.1
San Antonio, Texas
84
—
—
—
Chelan-Douglas-Okanogan Counties, Washington
136
39.0
4.8
29.7–48.4
Clark County, Washington
112
—
—
—
Colville Confederated Tribes, Washington
0
—
Ά
—
Seattle-King, County, Washington
132
43.0
4.8
33.5–52.4
Thurston County, Washington
139
42.9
5.1
33.0–52.8
Range
28.2–46.8
Median
40.2
* Standard error.
† Confidence interval.
§ Not available if the unweighted sample size for the denominator was <50 or if the CI half width is >10.
Ά Data analysis conducted by the community; SE not reported.
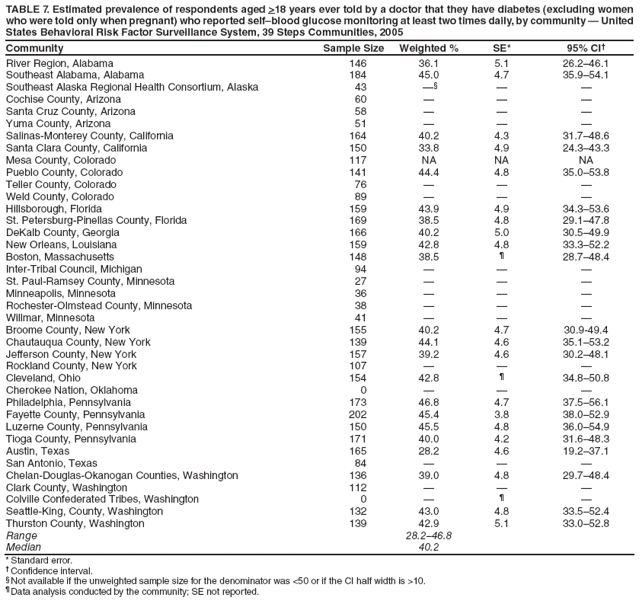
Return to top.
Table 8

TABLE 8. Estimated prevalence of respondents aged >18 years ever told by a doctor that they have diabetes (excluding women who were told only when pregnant, refusals, and unknowns) who reported checking their feet at least one time daily for any sores or irritations, by community — United States, Behavioral Risk Surveillance System, 39 Steps Communities, 2005
Community
Sample Size
Weighted %
SE*
95% CI†
River Region, Alabama
147
74.6
4.3
66.1–83.1
Southeast Alabama, Alabama
178
79.2
3.4
72.5–85.9
Southeast Alaska Regional Health Consortium, Alaska
44
—§
—
—
Cochise County, Arizona
60
—
—
—
Santa Cruz County, Arizona
59
—
—
—
Yuma County, Arizona
51
—
—
—
Salinas-Monterey County, California
163
67.3
4.3
58.9–75.8
Santa Clara County, California
0
—
—
—
Mesa County, Colorado
115
—
—
—
Pueblo County, Colorado
138
77.6
3.9
70.0–85.2
Teller County, Colorado
74
—
—
—
Weld County, Colorado
88
—
—
—
Hillsborough, Florida
158
74.6
4.6
65.6–83.6
St. Petersburg-Pinellas County, Florida
163
65.1
5.0
55.4–74.8
DeKalb County, Georgia
157
NA
NA
NA
New Orleans, Louisiana
157
78.2
4.3
69.8–86.6
Boston, Massachusetts
150
65.3
Ά
54.4–76.3
Inter-Tribal Council, Michigan
91
—
—
—
St. Paul-Ramsey County, Minnesota
27
—
—
—
Minneapolis, Minnesota
35
—
—
—
Rochester-Olmstead County, Minnesota
36
—
—
—
Willmar, Minnesota
38
—
—
—
Broome County, New York
152
64.5
4.4
56.0–73.1
Chautauqua County, New York
136
61.7
4.6
52.7–70.7
Jefferson County, New York
149
78.1
3.5
71.2–85.0
Rockland County, New York
105
74.2
4.5
65.5–83.0
Cleveland, Ohio
154
74.9
Ά
64.4–85.4
Cherokee Nation, Oklahoma
0
—
—
—
Philadelphia, Pennsylvania
169
75.7
4.1
67.8–83.6
Fayette County, Pennsylvania
195
74.8
3.4
68.2–81.3
Luzerne County, Pennsylvania
147
74.7
4.5
65.9–83.4
Tioga County, Pennsylvania
167
69.4
4.0
61.6–77.1
Austin, Texas
162
—
—
—
San Antonio, Texas
83
—
—
—
Chelan-Douglas-Okanogan Counties, Washington
134
65.1
4.7
55.9–74.3
Clark County, Washington
114
—
—
—
Colville Confederated Tribes, Washington
0
—
Ά
—
Seattle-King, County, Washington
131
65.7
4.7
56.5–75.0
Thurston County, Washington
137
75.2
4.1
67.2–83.2
Median
74.6
* Standard error.
† Confidence interval.
§ Not available if the unweighted sample size for the denominator was <50 or if the CI half width is >10.
Ά Data analysis conducted by the community; SE not reported.
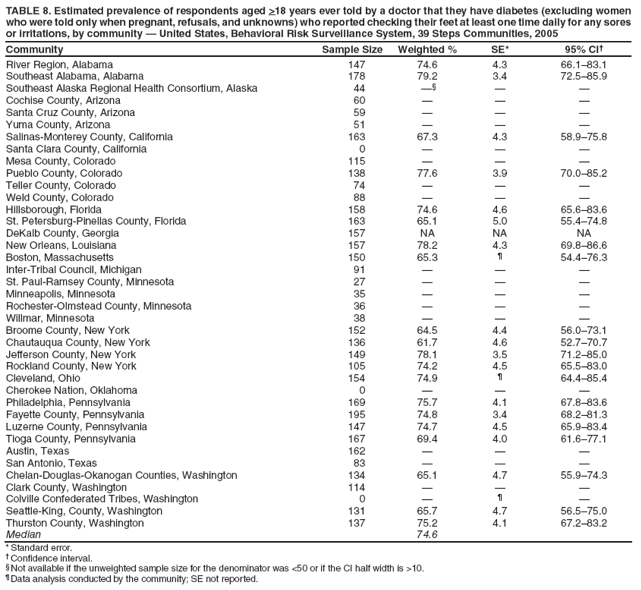
Return to top.
Table 9

TABLE 9. Estimated prevalence of respondents aged >18 years who reported being told by health professional that they had asthma, by community — United States, Behavioral Risk Surveillance System, 39 Steps Communities, 2005
Community
Sample Size
Weighted %
SE*
95% CI†
River Region, Alabama
1,245
10.4
1.1
8.3–12.4
Southeast Alabama, Alabama
1351
14.2
1.4
11.6–16.8
Southeast Alaska Regional Health Consortium, Alaska
561
10.2
1.4
7.4–13.0
Cochise County, Arizona
490
14.5
2.1
10.4–18.6
Santa Cruz County, Arizona
513
7.0
1.4
4.3–9.7
Yuma County, Arizona
507
14.7
2.0
10.8–18.7
Salinas-Monterey County, California
1,695
9.7
0.9
8.0–11.4
Santa Clara County, California
1701
11.9
1.0
10.0-13.8
Mesa County, Colorado
1,465
12.2
1.0
10.3–14.2
Pueblo County, Colorado
1,485
14.2
1.1
12.0–16.4
Teller County, Colorado
1,521
14.1
1.0
12.1–16.1
Weld County, Colorado
1,480
12.3
1.1
10.2–14.4
Hillsborough, Florida
1,562
11.3
1.0
9.4–13.2
St. Petersburg-Pinellas County, Florida
1,547
13.1
1.0
11.1–15.0
DeKalb County, Georgia
1,946
12.4
1.1
10.3–14.5
New Orleans, Louisiana
1,497
10.2
1.0
8.3–12.2
Boston, Massachusetts
§
§
§
§
Inter-Tribal Council, Michigan
613
17.6
2.2
13.4–21.9
St. Paul-Ramsey County, Minnesota
486
13.1
2.2
8.7–17.4
Minneapolis, Minnesota
532
15.6
2.0
11.6–19.6
Rochester-Olmstead County, Minnesota
475
9.4
1.6
6.4–12.4
Willmar, Minnesota
499
9.9
1.6
6.7–13.1
Broome County, New York
1,527
13.4
1.2
11.1–15.8
Chautauqua County, New York
1,484
13.5
1.2
11.2–15.8
Jefferson County, New York
1,521
12.7
1.2
10.4–15.1
Rockland County, New York
1,454
11.8
1.3
9.2–14.4
Cleveland, Ohio
§
§
§
§
Cherokee Nation, Oklahoma
2,239
16.7
1.0
14.6–18.7
Philadelphia, Pennsylvania
1,516
17.6
1.2
15.2–20.0
Fayette County, Pennsylvania
1,553
10.8
0.9
9.1–12.6
Luzerne County, Pennsylvania
1,514
10.0
0.9
8.3–11.7
Tioga County, Pennsylvania
1,553
12.0
0.9
10.2–13.8
Austin, Texas
1,587
10.9
1.2
8.7–13.1
San Antonio, Texas
528
11.7
1.8
8.2–15.2
Chelan-Douglas-Okanogan Counties, Washington
1,589
14.5
1.1
12.3–16.7
Clark County, Washington
1,590
16.2
1.1
14.0–18.5
Colville Confederated Tribes, Washington
§
§
§
§
Seattle-King, County, Washington
1,591
13.2
1.0
11.2–15.1
Thurston County, Washington
1,632
16.6
1.3
14.2–19.1
Range
7.0–17.6
Median
12.4
National range
8.9–19.3
National median
12.6
* Standard error.
† Confidence interval.
§ Data not provided.
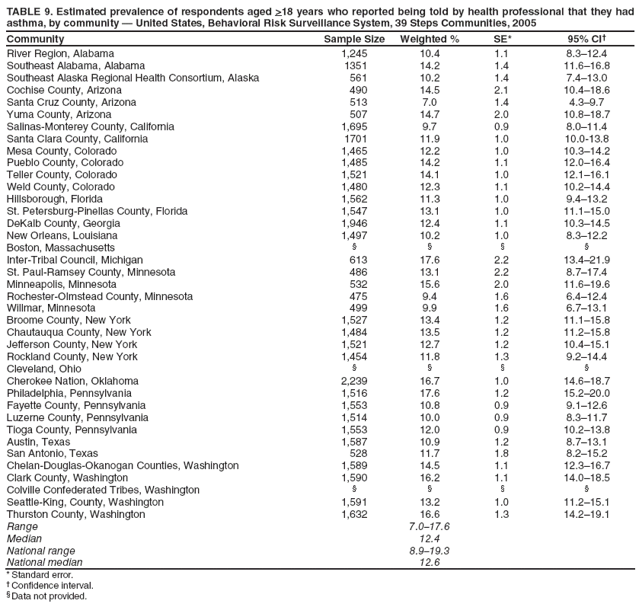
Return to top.
Table 10

TABLE 10. Estimated prevalence of respondents aged >18 years with asthma who reported having no symptoms of asthma during the preceding 30 days, by community — United States, Behavioral Risk Surveillance System, 39 Steps Communities, 2005
Community
Sample Size
Weighted %
SE*
95% CI†
River Region, Alabama
89
—§
—
—
Southeast Alabama, Alabama
101
—
—
—
Southeast Alaska Regional Health Consortium, Alaska
0
—
—
—
Cochise County, Arizona
51
—
—
—
Santa Cruz County, Arizona
18
—
—
—
Yuma County, Arizona
46
—
—
—
Salinas-Monterey County, California
116
—
—
—
Santa Clara County, California
118
—
—
—
Mesa County, Colorado
121
22.8
4.3
14.4–31.1
Pueblo County, Colorado
143
15.4
3.2
9.1–21.7
Teller County, Colorado
119
24.8
4.6
15.7–33.8
Weld County, Colorado
103
—
—
—
Hillsborough, Florida
105
—
—
—
St. Petersburg-Pinellas County, Florida
138
40.3
5.0
30.5–50.1
DeKalb County, Georgia
0
—
—
—
New Orleans, Louisiana
88
—
—
—
Boston, Massachusetts
0
—
Ά
—
Inter-Tribal Council, Michigan
70
16.0
5.0
6.2–5.8
St. Paul-Ramsey County, Minnesota
0
—
—
—
Minneapolis, Minnesota
0
—
—
—
Rochester-Olmstead County, Minnesota
0
—
—
—
Willmar, Minnesota
0
—
—
—
Broome County, New York
0
—
—
—
Chautauqua County, New York
0
—
—
—
Jefferson County, New York
0
—
—
—
Rockland County, New York
0
—
—
—
Cleveland, Ohio
75
—
—
10.3–22.3
Cherokee Nation, Oklahoma
0
—
—
—
Philadelphia, Pennsylvania
172
26.7
4.1
18.6–34.8
Fayette County, Pennsylvania
123
19.8
4.2
11.6–27.9
Luzerne County, Pennsylvania
110
20.9
4.6
11.8–29.9
Tioga County, Pennsylvania
118
21.6
4.0
13.7–29.5
Austin, Texas
123
17.8
4.7
8.5–27.0
San Antonio, Texas
38
—
—
—
Chelan-Douglas-Okanogan Counties, Washington
0
—
—
—
Clark County, Washington
0
—
—
—
Colville Confederated Tribes, Washington
—
—
—
—
Seattle-King, County, Washington
0
—
—
—
Thurston County, Washington
0
—
—
—
Range
15.4–40.3
Median
20.9
* Standard error.
† Confidence interval.
§ Not available if the unweighted sample size for the denominator was <50 or if the CI half width is >10.
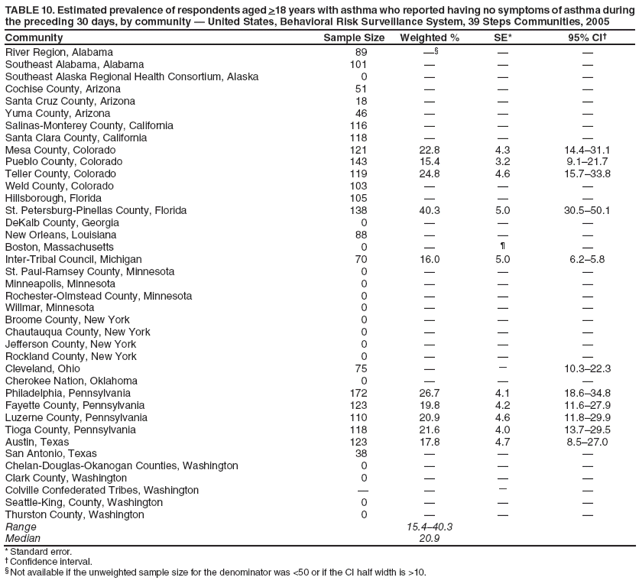
Return to top.
Table 11

TABLE 11. Estimated prevalence of number of adults aged >18 years who reported moderate physical activity for >30 minutes at least five times a week or who reported vigorous physical activity for >20 minutes at least three times a week, by community — United States, Behavioral Risk Surveillance System, 39 Steps Communities, 2005
Community
Sample Size
Weighted %
SE*
95% CI†
River Region, Alabama
1,188
43.5
1.9
39.8–47.2
Southeast Alabama, Alabama
1,263
44.7
1.9
41.0–48.4
Southeast Alaska Regional Health Consortium, Alaska
529
59.9
2.6
54.8–64.9
Cochise County, Arizona
458
54.0
2.9
48.2–59.7
Santa Cruz County, Arizona
476
48.2
2.8
42.8–53.6
Yuma County, Arizona
478
48.0
2.9
42.4–53.6
Salinas-Monterey County, California
1,562
51.7
1.6
48.6–54.8
Santa Clara County, California
1,594
44.9
1.6
41.8–48.0
Mesa County, Colorado
1,358
54.7
1.6
51.7–57.8
Pueblo County, Colorado
1,377
53.6
1.7
50.3–56.9
Teller County, Colorado
1,409
57.6
1.5
54.7–60.5
Weld County, Colorado
1,388
52.0
1.6
48.8–55.2
Hillsborough, Florida
1,469
46.6
1.6
43.4–49.7
St. Petersburg-Pinellas County, Florida
1,454
44.1
1.5
41.1–47.1
DeKalb County, Georgia
1,818
44.6
1.7
41.2–48.0
New Orleans, Louisiana
1,385
42.0
1.7
38.7–45.3
Boston, Massachusetts
1,522
51.1
§
47.7–54.5
Inter-Tribal Council, Michigan
417
52.7
3.2
46.4–59.0
St. Paul-Ramsey County, Minnesota
467
55.2
3.0
49.4–61.0
Minneapolis, Minnesota
496
56.6
2.9
50.9–62.3
Rochester-Olmstead County, Minnesota
445
52.5
2.9
46.8–58.2
Willmar, Minnesota
458
46.5
2.9
40.8–52.2
Broome County, New York
1436
51.3
1.7
47.9–54.6
Chautauqua County, New York
1359
51.8
1.8
48.3–55.3
Jefferson County, New York
1423
62.2
1.6
59.0–65.3
Rockland County, New York
1377
47.0
1.8
43.4–50.5
Cleveland, Ohio
1,020
44.4
§
41.6–47.2
Cherokee Nation, Oklahoma
2,086
43.7
1.4
41.0–46.4
Philadelphia, Pennsylvania
1,373
47.6
1.7
44.3–50.9
Fayette County, Pennsylvania
1,418
47.8
1.5
44.8–50.8
Luzerne County, Pennsylvania
1,384
51.1
1.5
48.1–54.1
Tioga County, Pennsylvania
1,395
52.0
1.5
49.1–54.9
Austin, Texas
1,501
50.6
2.0
46.7–54.4
San Antonio, Texas
482
42.8
2.8
37.3–48.4
Chelan-Douglas-Okanogan Counties, Washington
1,494
55.4
1.5
52.3–58.4
Clark County, Washington
1,520
54.7
1.5
51.6–57.7
Colville Confederated Tribes, Washington
145
48.8
§
37.3–60.4
Seattle-King, County, Washington
1,505
51.1
1.6
48.1–54.2
Thurston County, Washington
1,546
58.9
1.6
55.8–61.9
Range
42.0–62.2
Median
51.1
National range
35.7–59.2
National median
49.1
* Standard error.
† Confidence interval.
§ Data analysis conducted by the community; SE not reported.
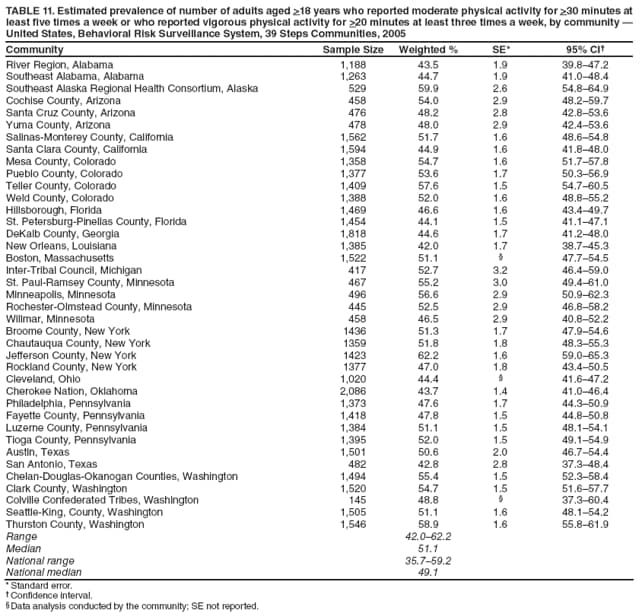
Return to top.
Table 12

TABLE 12. Estimated prevalence of respondents aged >18 years who reported eating at least five fruits and vegetables per day, by community —United States, Behavioral Risk Surveillance System, 39 Steps Communities, 2005
Community
Sample Size
Weighted %
SE*
95% CI†
River Region, Alabama
1,228
23.3
1.6
20.1–26.5
Southeast Alabama, Alabama
1,325
22.6
1.5
19.7–25.5
Southeast Alaska Regional Health Consortium, Alaska
563
20.8
2.1
16.7–24.9
Cochise County, Arizona
484
26.8
2.4
22.0–31.6
Santa Cruz County, Arizona
499
28.4
2.4
23.7–33.1
Yuma County, Arizona
493
21.3
2.2
17.0–25.6
Salinas-Monterey County, California
1,697
30.3
1.4
27.6–33.0
Santa Clara County, California
1,649
28.0
1.4
25.3–30.8
Mesa County, Colorado
1,440
23.6
1.2
21.2–26.0
Pueblo County, Colorado
1,464
18.9
1.2
16.5–21.3
Teller County, Colorado
1,485
22.7
1.2
20.4–25.0
Weld County, Colorado
1,456
20.1
1.3
17.7–22.6
Hillsborough, Florida
1,537
27.7
1.4
24.9–30.5
St. Petersburg-Pinellas County, Florida
1,524
25.9
1.3
23.4–28.4
DeKalb County, Georgia
1,911
28.2
1.5
25.2–31.1
New Orleans, Louisiana
1,482
24.0
1.4
21.3–26.6
Boston, Massachusetts
1,601
24.8
§
21.9–27.6
Inter-Tribal Council, Michigan
613
21.6
3.5
14.8–28.4
St. Paul-Ramsey County, Minnesota
482
24.6
2.5
19.8–29.4
Minneapolis, Minnesota
532
25.4
2.3
20.8–29.9
Rochester-Olmstead County, Minnesota
473
22.5
2.2
18.3–26.8
Willmar, Minnesota
487
20.7
2.3
16.3–25.1
Broome County, New York
1,528
25.5
1.4
22.8–28.3
Chautauqua County, New York
1,87
26.2
1.5
23.3–29.1
Jefferson County, New York
1,526
26.4
1.5
23.5–29.4
Rockland County, New York
1,454
28.3
1.7
24.9–31.6
Cleveland, Ohio
1,031
29.2
§
27.9–31.5
Cherokee Nation, Oklahoma
2,225
15.6
1.0
13.7–17.5
Philadelphia, Pennsylvania
1,459
26.2
1.4
23.4–29.0
Fayette County, Pennsylvania
1,517
20.1
1.2
17.8–22.4
Luzerne County, Pennsylvania
1,481
23.8
1.2
21.4–26.2
Tioga County, Pennsylvania
1,533
26.0
1.2
23.6–28.5
Austin, Texas
1,586
25.3
1.6
22.1–28.4
San Antonio, Texas
511
18.8
2.1
14.7–23.0
Chelan-Douglas-Okanogan Counties, Washington
1,572
24.9
1.4
22.3–27.6
Clark County, Washington
1,584
25.0
1.3
22.5–27.4
Colville Confederated Tribes, Washington
153
24.8
§
16.2–36.0
Seattle-King, County, Washington
1,583
26.7
1.3
24.1–29.2
Thurston County, Washington
1,627
26.2
1.3
23.6–28.8
Range
15.6–30.3
Median
24.9
National range
14.3–32.3
National median
23.2
* Standard error.
† Confidence interval.
§ Data analysis conducted by the community; SE not reported.
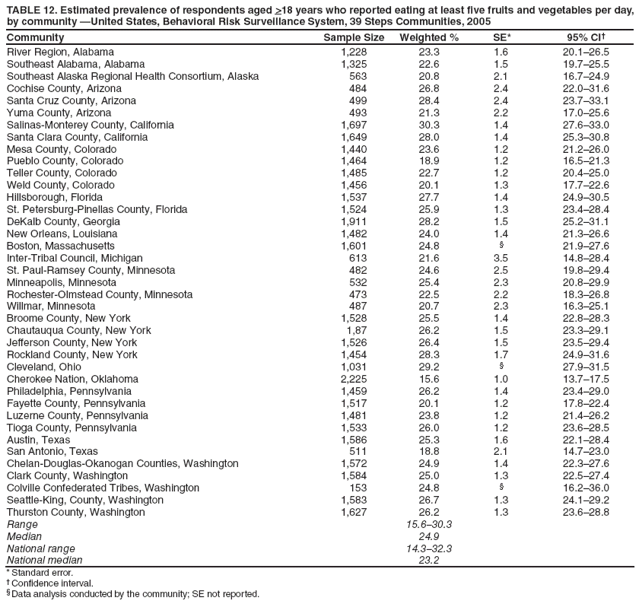
Return to top.
Table 13

TABLE 13. Estimated prevalence of respondents aged >18 years who reported having smoked >100 cigarettes in their lifetime and who are current smokers on every day or some days, by community — United States, Behavioral Risk Surveillance System, 39 Steps Communities, 2005
Community
Sample Size
Weighted %
SE*
95% CI†
River Region, Alabama
1,246
21.7
1.6
18.6–24.8
Southeast Alabama, Alabama
1,349
22.4
1.6
19.3–25.5
Southeast Alaska Regional Health Consortium, Alaska
557
34.7
2.5
29.8–39.6
Cochise County, Arizona
487
20.8
2.4
16.2–25.5
Santa Cruz County, Arizona
512
21.3
2.3
16.8–25.7
Yuma County, Arizona
504
13.1
2.0
9.2–17.0
Salinas-Monterey County, California
1,697
14.8
1.1
12.6–17.0
Santa Clara County, California
1,698
14.9
1.1
12.8–17.1
Mesa County, Colorado
1,462
22.6
1.4
19.9–25.2
Pueblo County, Colorado
1,485
24.9
1.5
22.1–27.8
Teller County, Colorado
1,513
22.2
1.2
19.8–24.6
Weld County, Colorado
1,478
21.4
1.3
18.9–24.0
Hillsborough, Florida
1,558
24.8
1.5
21.9–27.8
St. Petersburg-Pinellas County, Florida
1,544
28.9
1.4
26.2–31.7
DeKalb County, Georgia
1,943
14.1
1.2
11.8–16.4
New Orleans, Louisiana
1,491
18.8
1.3
16.3–21.3
Boston, Massachusetts
1,612
17.1
§
14.7–19.5
Inter-Tribal Council, Michigan
612
33.6
2.5
28.8–38.5
St. Paul-Ramsey County, Minnesota
486
18.7
2.6
13.7–23.7
Minneapolis, Minnesota
532
22.0
2.3
17.4–26.6
Rochester-Olmstead County, Minnesota
476
11.0
1.7
7.6–14.4
Willmar, Minnesota
497
20.6
2.5
15.6–25.5
Broome County, New York
1,525
24.3
1.6
21.2–27.3
Chautauqua County, New York
1,484
23.6
1.5
20.7–26.6
Jefferson County, New York
1,519
22.4
1.4
19.6–25.2
Rockland County, New York
1,450
14.1
1.3
11.6–16.5
Cleveland, Ohio
1,103
31.6
§
29.3–33.9
Cherokee Nation, Oklahoma
2,238
28.5
1.2
26.0–30.9
Philadelphia, Pennsylvania
1,509
25.5
1.4
22.7–28.3
Fayette County, Pennsylvania
1,555
25.9
1.3
23.4–28.4
Luzerne County, Pennsylvania
1,510
27.7
1.3
25.1–30.3
Tioga County, Pennsylvania
1,547
23.4
1.2
21.1–25.7
Austin, Texas
1,584
20.2
1.6
17.0–23.4
San Antonio, Texas
528
19.8
2.2
15.4–24.1
Chelan-Douglas-Okanogan Counties, Washington
1,587
21.0
1.3
18.4–23.5
Clark County, Washington
1,587
19.5
1.2
17.1–21.9
Colville Confederated Tribes, Washington
151
39.7
§
28.8–51.6
Seattle-King, County, Washington
1,587
18.6
1.2
16.3–21.0
Thurston County, Washington
1,632
19.1
1.3
16.6–21.6
Range
11.0–39.7
Median
21.6
National range
8.1–28.7
National median
20.6
Healthy People 2010 objective
12.0
* Standard error.
† Confidence interval.
§ Data analysis conducted by the community; SE not reported.
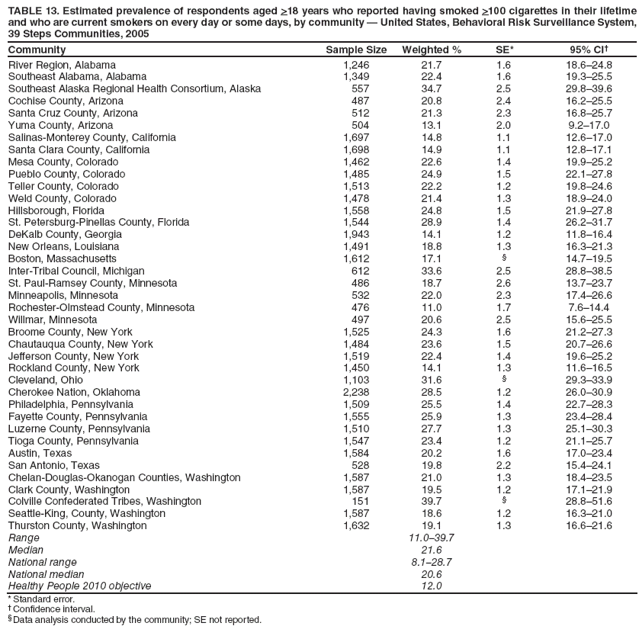
Return to top.
Table 14
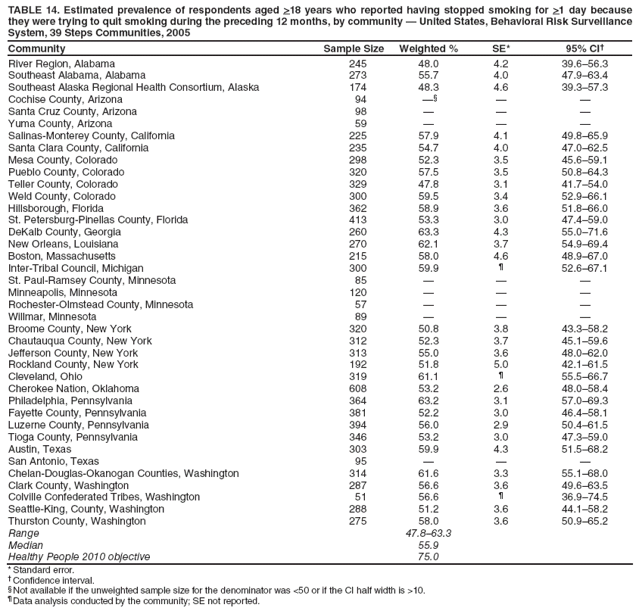
TABLE 14. Estimated prevalence of respondents aged >18 years who reported having stopped smoking for >1 day because they were trying to quit smoking during the preceding 12 months, by community — United States, Behavioral Risk Surveillance System, 39 Steps Communities, 2005
Community
Sample Size
Weighted %
SE*
95% CI†
River Region, Alabama
245
48.0
4.2
39.6–56.3
Southeast Alabama, Alabama
273
55.7
4.0
47.9–63.4
Southeast Alaska Regional Health Consortium, Alaska
174
48.3
4.6
39.3–57.3
Cochise County, Arizona
94
—§
—
—
Santa Cruz County, Arizona
98
—
—
—
Yuma County, Arizona
59
—
—
—
Salinas-Monterey County, California
225
57.9
4.1
49.8–65.9
Santa Clara County, California
235
54.7
4.0
47.0–62.5
Mesa County, Colorado
298
52.3
3.5
45.6–59.1
Pueblo County, Colorado
320
57.5
3.5
50.8–64.3
Teller County, Colorado
329
47.8
3.1
41.7–54.0
Weld County, Colorado
300
59.5
3.4
52.9–66.1
Hillsborough, Florida
362
58.9
3.6
51.8–66.0
St. Petersburg-Pinellas County, Florida
413
53.3
3.0
47.4–59.0
DeKalb County, Georgia
260
63.3
4.3
55.0–71.6
New Orleans, Louisiana
270
62.1
3.7
54.9–69.4
Boston, Massachusetts
215
58.0
4.6
48.9–67.0
Inter-Tribal Council, Michigan
300
59.9
Ά
52.6–67.1
St. Paul-Ramsey County, Minnesota
85
—
—
—
Minneapolis, Minnesota
120
—
—
—
Rochester-Olmstead County, Minnesota
57
—
—
—
Willmar, Minnesota
89
—
—
—
Broome County, New York
320
50.8
3.8
43.3–58.2
Chautauqua County, New York
312
52.3
3.7
45.1–59.6
Jefferson County, New York
313
55.0
3.6
48.0–62.0
Rockland County, New York
192
51.8
5.0
42.1–61.5
Cleveland, Ohio
319
61.1
Ά
55.5–66.7
Cherokee Nation, Oklahoma
608
53.2
2.6
48.0–58.4
Philadelphia, Pennsylvania
364
63.2
3.1
57.0–69.3
Fayette County, Pennsylvania
381
52.2
3.0
46.4–58.1
Luzerne County, Pennsylvania
394
56.0
2.9
50.4–61.5
Tioga County, Pennsylvania
346
53.2
3.0
47.3–59.0
Austin, Texas
303
59.9
4.3
51.5–68.2
San Antonio, Texas
95
—
—
—
Chelan-Douglas-Okanogan Counties, Washington
314
61.6
3.3
55.1–68.0
Clark County, Washington
287
56.6
3.6
49.6–63.5
Colville Confederated Tribes, Washington
51
56.6
Ά
36.9–74.5
Seattle-King, County, Washington
288
51.2
3.6
44.1–58.2
Thurston County, Washington
275
58.0
3.6
50.9–65.2
Range
47.8–63.3
Median
55.9
Healthy People 2010 objective
75.0
* Standard error.
† Confidence interval.
§ Not available if the unweighted sample size for the denominator was <50 or if the CI half width is >10.
Ά Data analysis conducted by the community; SE not reported.
Return to top.

Use of trade names and commercial sources is for identification only and does not imply endorsement by the U.S. Department of Health and Human Services.


References to non-CDC sites on the Internet are provided as a service to MMWR readers and do not constitute or imply endorsement of these organizations or their programs by CDC or the U.S. Department of Health and Human Services. CDC is not responsible for the content of pages found at these sites. URL addresses listed in MMWR were current as of the date of publication.

All MMWR HTML versions of articles are electronic conversions from typeset documents. This conversion might result in character translation or format errors in the HTML version. Users are referred to the electronic PDF version (http://www.cdc.gov/mmwr) and/or the original MMWR paper copy for printable versions of official text, figures, and tables. An original paper copy of this issue can be obtained from the Superintendent of Documents, U.S. Government Printing Office (GPO), Washington, DC 20402-9371; telephone: (202) 512-1800. Contact GPO for current prices.

**Questions or messages regarding errors in formatting should be addressed to mmwrq@cdc.gov.

Date last reviewed: 10/17/2008

HOME  |  ABOUT MMWR  |  MMWR SEARCH  |  DOWNLOADS  |  RSSCONTACT
POLICY  |  DISCLAIMER  |  ACCESSIBILITY

Safer, Healthier People

Morbidity and Mortality Weekly Report
Centers for Disease Control and Prevention
1600 Clifton Rd, MailStop E-90, Atlanta, GA 30333, U.S.A

USA.GovDHHS

Department of Health
and Human Services